

 PDF
PDF ePub
ePub Citation
 Print
Print


INTRODUCTION
The increase in the elderly population has resulted in an increase in the number of patients with chronic diseases. According to data released by Statistics Korea in 2015, the elderly, those aged ≥ 65 years, constituted 13.1% of the total population in Korea [1]. In addition, the prevalence of cognitive functional impairment in patients with Alzheimer's disease (AD) increases with age. In a study conducted by Lee et al., mild cognitive impairment (MCI) was defined as the intermediate stage between normal age-related impairment in cognitive abilities and the progression of AD [2]. Geda et al. have reported that the morbidity rate of MCI in AD patients is 10–15%, which is significantly higher than the 1–2% rate in the normal population [3]. Based on the results of a study by Koepsell in 2012 [4], the cognitive function of 15–20% of patients who were screened and diagnosed with MCI had improved after 1–2 years of managing their MCI risk factors. Furthermore, in 2015, Cooper et al. [5] reported that 40–70% of patients with MCI did not progress to AD after 10 years. Furthermore, Dean et al. reported in 2008 that the dietary intake of the elderly is likely to decline with age for both physiological and psychological reasons [6].
Practical guidelines should be established to help manage the factors that are likely to cause progression to AD. Numerous studies have shown that the Mediterranean diet (MeDi), which emphasizes the intake of fish, vegetables, fruits, nuts, olive oil, and certain fat ingredients, but less meat, can prevent cognitive functional impairment [789]. An epidemiological survey conducted by Ye et al. [10] and a study by Loef and Walach [11] revealed that antioxidants, vitamins, and folic acid in vegetables and fruits are effective in enhancing memory and cognitive function. Loef and Walach [11] also reported that simple sugars in fruits and a high glycemic index can decrease temporal lobe and hippocampal volumes, regions that supervise hearing, olfaction, and sensory language, and such factors may also increase the risk for mild cognitive functional impairment. A cross-sectional survey of 672 participants with normal cognitive function (mean age: 79.8 years) used a questionnaire survey to determine the frequency of intake of 128 different foods, and the results revealed a high intake of soybeans, fish, vegetables, and whole grains. The participants in that study presented with good nutritional status and magnetic resonance imaging (MRI) results (based on cortical thickness) [12]. In other studies, the intake of eggs, seaweeds [13], and nuts [14] have been associated with cognitive function. In addition, a recent study showed that a neurodegenerative delay diet (commonly called the MIND diet), which combines the dietary approaches to stop hypertension (DASH) diet and the Mediterranean diet was correlated to neuroprotection and the prevention of AD [15]. The MIND diet includes recommendation on the intake of 10 food groups that are good for brain health, including green, leafy, and other kinds of vegetables, nuts, berries, beans, whole grains, fish, poultry, olive oil, and wine, and it emphasizes a reduction in the consumption of red meat, butter, margarine, cheese, pastries, sweets, and fried/fast foods. Ozawa and colleagues [16] have shown that a high intake of red meat, processed meat, peas and other legumes, and fried foods and a reduced intake of whole grains increased the levels of interleukin (IL)-6 and led to a two-fold increase in the risk of a mini-mental state examination (MMSE) score reduction of more than three points. The MMSE, as well as the global deterioration scale (GDS) and the short form geriatric depression scale (SGDS), are commonly used neuropsychological tests.
The above mentioned studies have revealed that dietary patterns have been correlated with brain damage. Previous studies have shown significant correlations between cognitive function and dietary intake as well as with nutrition status; however, there have been contrasting results, and the inconsistencies appear to depend on the method of selection of participants, the research approach, and the analytical technique.
Equally importantly, Koreans have unique and traditional dietary patterns and a distinct eating culture compared to the populations in Western and other Asian countries; hence, it is appropriate to identify country-specific dietary patterns in aging populations and to analyze their associations with disease. Thus, the purpose of this study was to investigate the association of dietary intake with cognitive function in Korea, while considering the diverse living environment and general characteristics of the study population.
SUBJECTS AND METHODS
Participants and study design
This study was conducted in Gwangju Sun-Han hospital and was approved by the institutional bioethics committee of Chonnam National University with the study designed to analyze the association between dietary environment and cognitive function in adults aged over 50 years (approval: 1040198-170620-HR-049-02). Between July 2017 and March 2018, 324 adults aged over 50 years from Gwangju Sun-Han hospital participated in the dietary survey and underwent cognitive function testing. The study was carried out to investigate dietary-related items by examining semi-quantitative food frequency questionnaires (SQ-FFQ) and cognitive-related items by using the MMSE, GDS, and SGDS. In addition, various physical and general characteristics were assessed.
Initially, 324 subjects aged 50 years or older who had participated in all tests and surveys were selected for further screening. Individuals with chronic liver or kidney disease, which would affect their ordinary dietary intake; those undergoing a dietary therapy within the last year, which would change their normal dietary intake patterns; those who had undergone gastrectomy and enterectomy; those with severe mental diseases, such as schizophrenia, which might affect their cognitive function; those with congenital metabolic diseases, cancer, or alcohol abuse problems, AD, and Parkinson's disease; those who took drugs for nervous system diseases for a long period of time; and those whose daily caloric intake was < 500 or > 5,000 kcal were excluded from the survey. As a result of that screening, 276 participants were enrolled in this study.
Data collection
The participants' general characteristics such as age, sex, education level, inhabitation status, self-measured health status level, medications, self-reported dental condition level, and sleep duration were determined. With regard to lifestyle, we examined alcohol consumption and smoking status and evaluated the level of daily activity. To analyze daily eating habits, the frequency of intake of breakfast and the status of nutritional supplements were investigated. In terms of clinical characteristics, height (m), weight (kg), body mass index (BMI; kg/m2), systolic blood pressure (SBP), and diastolic blood pressure (DBP) were measured. Anthropometric measurements were obtained by a nurse specialist by using a standardized method. The participants' weights and heights were measured to the first decimal point of each unit. BMI was classified into < 18.5 kg/m2, 18.5–24.9 kg/m2, 25.0–30.0 kg/m2, and > 30.0 kg/m2 classes, and significant differences in various factors were analyzed according to the participants' BMI class. To measure the correct blood pressure, a resting period of 5 minutes before pressure measurement was enforced, a cuff suitable for measurement around the arm was selected, and measurements were performed with an automatic blood pressure monitor (HBP-9020, Omron healthcare Co, Kyoto, Japan).
Assessment of cognitive function
To evaluate the cognitive function of the participants, the medical team conducted neuropsychological tests including MMSE, GDS, and SGDS assessments. The MMSE is advantageous because it has high reliability and validity for the evaluation of cognitive function. Moreover, it can be easily applied and executed within a short period of time [17]. The MMSE consisted of 30 questions on cognitive domains including time and place orientation, memory registration and recall, attention and calculation, language function, as well as understanding and judgment. Scores were adjusted according to the participants' level of education and ranged from 0 to 30. A higher MMSE score indicates better cognitive function. In a preceding study, a total of 19–24 points were required to obtain a clinical diagnosis of a cognitive functional impairment. Regarding the cut-off value, its sensitivity was 80–90% and its accuracy was 80–100% [18]. For illiterate participants or those with no academic background, one point was added for time orientation, two points for attention and calculation, and one point for language. This modification was included so that the participants could not obtain perfect scores for each question. Of the participants, those with an MMSE score of 19–24 were assigned to the MCI group, while those with an MMSE score of 25–30 were assigned to the normal cognitive function (normal) group [19]. Finally, a medical team confirmed the status of the participants who were diagnosed with mild cognitive functional impairment or normal cognitive function. Another cognitive function assessment scale, the GDS, is an evaluation method that focuses on daily life functions and behavioral abnormalities as well as cognitive function. The severity of cognitive impairment assessed by the GDS is divided into seven stages [20]. An individual who is close to stage 7 has severe deterioration of cognitive function. The self-reported SGDS was also used. It is a tool used to screen for the risk of depression [21] with a higher score (of a possible 0–15 points) indicating a higher risk of displaying symptoms of depression [22].
Assessment of dietary intake
To investigate the dietary intake level of the participants, the food frequency questionnaire used in this study was based on the SQ-FFQ used by the Korea National Health and Nutrition Survey of the Korea Centers for Disease Control & Prevention [23]. The SQ-FFQ was used to assess accurately the participants' dietary intake level. By quantitatively determining participants' intake levels of specific food items, it is easy to analyze the effect of a single nutrient on health. All the participants completed SQ-FFQ in a face-to-face manner with the help of a trained hospital nutritionist. The SQ-FFQ consisted of 112 detailed food items and it was used to assess the frequency of total food and food item intake over a range of almost no food to eating three times a day. In order to calculate the frequency of intake of the participants, the monthly and weekly frequency of food intake was converted to a daily food intake frequency. In addition, portion sizes of the 112 detailed food items and the average daily intake of each food were determined.
Food grouping
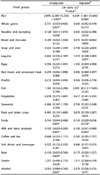
Since the SQ-FFQ used in this study assessed the intake of foods and nutrients in a limited number of food items or food lists, the lists are presented according to the participants' food habit characteristics. Therefore, this study used 112 verified questionnaire items that included energy and the intake of 14 according to MMSE score kinds of nutrients, which resulted in individual differences in statistical explanatory power of 87.0% and 81.7%, respectively. Data in the 4th National nutrition survey (2007–2009), using foods and food lists whose validity has been verified [23], was used to conduct the research. The categorized food items in the questionnaire included rice (5); noodles and dumplings (6); bread and rice cakes (8); soups and stews (12); beans, egg, meats, and fish (23); vegetables, seaweeds, roots, and tuber crops (27); milk (4); fruits (13); beverages (5); confectionery (6); and alcoholic beverages (3). However, to analyze the correlations between cognitive function, symptoms of depression, and food intake, this study reorganized the foods containing similar nutrients into new groups based on previous studies [2425], as a result, the foods were categorized into 20 groups as shown in Table 1. Thus, the foods were categorized based on the results of previous studies on the correlations between cognitive function and symptoms of depression with the intake of cooked rice with other grains and legumes [12], beans [26], eggs [13], meat and processed foods [16], poultry [27], fish [8], vegetables [8], seaweeds [13], and nuts [8]. In addition, coffee (54.53%), cooked rice with other grains and legumes (54.39%), and cooked rice (47.24%) were considered the most frequently consumed food items in Korea based on the 2015 National nutrition statistics [28], and, in particular, the intake of coffee was reported to affect health [293031]. The food items were then classified and categorized in detail as presented in Table 1.
Statistical analysis
The statistical package for the social science software version 22 (SPSS Inc., Chicago, IL, the USA) was used. To assess the significance of differences in the participants' general and clinical characteristics according to sex and MMSE level, the chi-square test and t-test were used, and a P-value < 0.05 was considered statistically significant. To analyze the odds ratio (OR) of the participant's general and clinical characteristics, as well as OR associated with food groups and detailed food items that were consumed according to MMSE level, a logistic regression analysis was utilized. To assess the validity of the results of the effect of food intake on cognitive function, the variables that showed significant results on the differences in terms of the general and clinical characteristics in the regression analysis, which included sex, education level, inhabitation status, medications, sleep duration, alcohol consumption, activity level, SBP, and SGDS, were set as confounding factors, and the OR was checked after validation.
RESULTS
General and clinical characteristics of the participants according to MMSE score
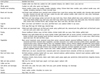
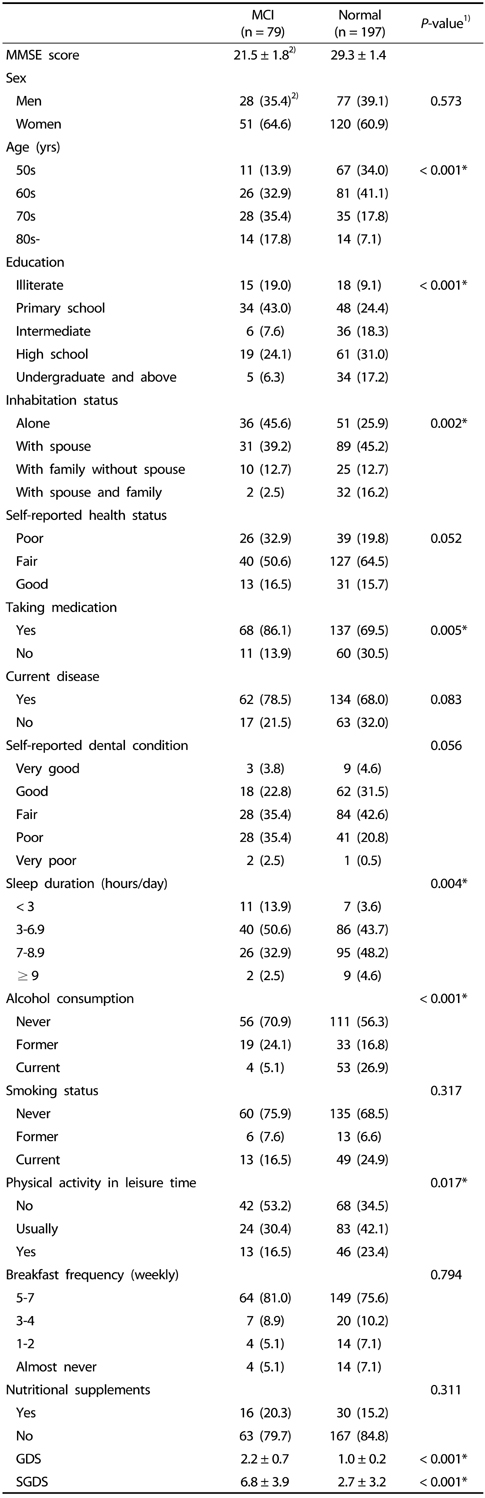
The general characteristics of the participants according to MMSE scores were analyzed, and the results are summarized in Table 2. Among the participants, 79 were assigned to the MCI group and 197 to the normal group. Significant differences were observed in terms of age, education level, inhabitation status, medications, sleep duration, alcohol consumption, and daily activity level between the two groups (P < 0.05). The GDS, a tool used to analyze the degree of overall degeneration in the elderly, was used to assess cognitive function in the study groups. The scores were 2.2 ± 0.7 for the MCI group and 1.0 ± 0.2 for the normal group, a significant difference (P < 0.001). The SGDS scores were 6.8 ± 3.9 for the MCI group and 2.7 ± 3.2 for the normal group, also a significant difference (P < 0.001). The clinical characteristics of the participants are presented in Table 3.
Association between the general and clinical characteristics of the participants and MMSE score
The OR of the general characteristics of the participants according to the MMSE level were analyzed, and the data are presented in Table 4. An increased age was associated with an increased OR (1.076 [95% CI: 1.045–1.108; P < 0.001]) of MCI. Intermediate education level (OR 0.111 [95% CI: 0.015–0.810; P = 0.030]) and medication (no) (OR 0.369 [95% CI: 0.182–0.748; P = 0.006]) were associated with a reduced risk of MCI. In contrast, sleep duration of < 3 hours/day (OR 7.071 [95% CI: 1.167–42.846; P = 0.033]), alcohol consumption (never) (OR 6.685 [95% CI: 2.302–19.408; P < 0.001]), and alcohol consumption (former) (OR 7.629 [95% CI: 2.386–24.397; P = 0.001]) were associated with an increased risk of MCI. In addition, physical activity (no) (OR 2.186 [95% CI: 1.058–4.517; P = 0.035]) was associated with an increased risk of MCI. An increased SGDS score (OR 1.346 [95% CI: 1.238–1.465; P < 0.001]), and an increased SBP score (OR 1.024 (95% CI: 1.003–1.047; P = 0.028]) were associated with an increased risk of MCI.
Association between daily food groups intake frequency and MMSE score
The OR of MCI according to the daily food intake frequency level of 20 food groups, are presented in Table 5. Variables that showed significant differences in cognitive function levels between participants' general and clinical characteristics were selected and adjusted. The adjusted OR (AOR) are shown in Table 5. Based on increasing the once per day rice intake frequency, the AOR of MCI increased to 6.639-fold [95% CI: 1.861–23.684; P = 0.004]). In contrast, according to increasing the once per day whole grains intake frequency, the AOR of MCI decreased to 0.645-fold [95% CI: 0.452–0.919; P = 0.015]), and according to increasing the once per day fruits intake frequency, the AOR of MCI decreased by 0.134-fold [95% CI: 0.029–0.616; P = 0.010]). Similarly, according to increasing the once per day milk and dairy products intake frequency, the AOR of MCI decreased to 0.100-fold [95% CI: 0.021–0.469; P = 0.003]).
The frequency of daily intake detailed food items using SQ-FFQ
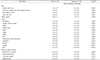
The frequency of intake of detailed food items each day by the MCI and normal groups was analyzed and the results are presented in Table 6. The frequency of intake of rice items except cooked white rice was significantly increased in the normal group (P < 0.05). The frequency of intake of whole grains was 0.9 ± 1.1 times/day in the MCI group and 1.2 ± 1.0 times/day in the normal group (P = 0.030). The intake frequency of all fruits items was significantly increased in the normal group compared with the MCI group (P < 0.05). The intake frequency of milk and dairy products, including milk (low fat, normal) and liquid-type and curd-type yogurt, was significantly higher in the normal group (P < 0.05).
Daily detailed food items intake frequency and MMSE score
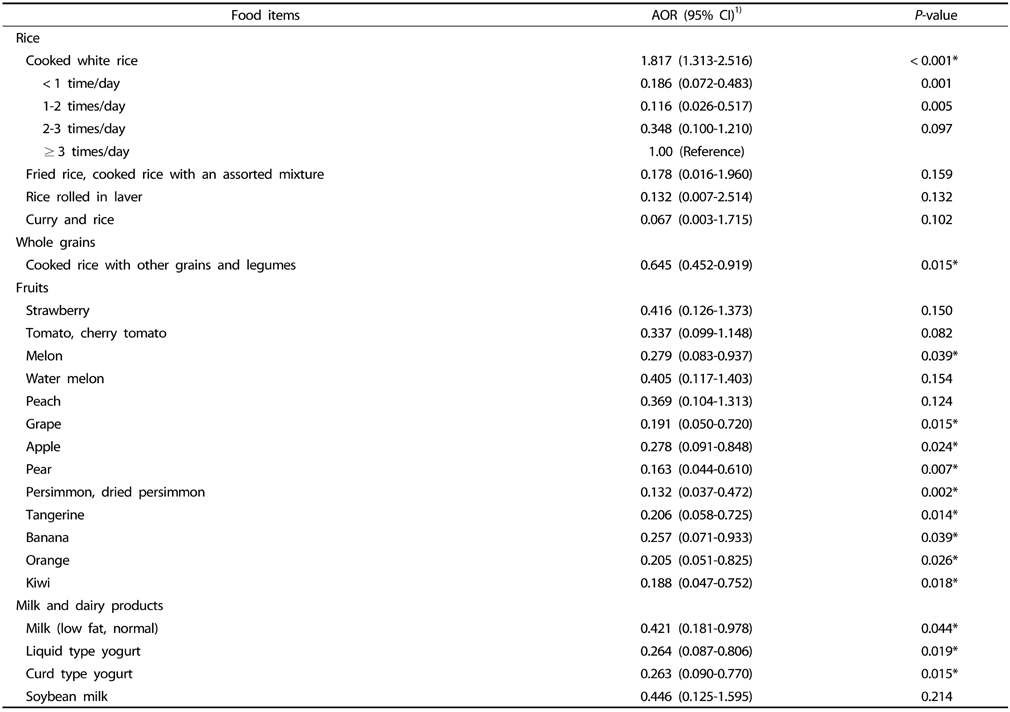
Detailed food items, including rice (4 items), whole grains (1 item), fruits (13 items), and milk and dairy products (4 items), that showed significant differences in terms of food intake frequency between the two groups and significant causality for cognitive function level were selected (Table 6). After adjusting for covariance, the results of the analysis on the AOR of MCI according to daily intake frequency are presented in Table 7. Based on increasing the once per day cooked white rice intake frequency, the AOR of MCI was 1.817-fold [95% CI: 1.313–2.516; P < 0.001]). In addition, when the intake level of cooked white rice was 1–2 times per day, the OR of MCI was 0.116-fold [95% CI: 0.026–0.517; P = 0.005]) compared with the reference level for ≥ 3 times per day rice intake frequency. When intake level of cooked white rice was less than once per day, the OR was 0.186-fold [95% CI: 0.072–0.483; P = 0.001]) of that for the ≥ 3 times per day intake frequency. In contrast, according to increasing the once per day cooked rice with other grains and legumes intake frequency, the AOR of MCI was 0.645-fold [95% CI: 0.452–0.919; P = 0.015]). In addition, according to increasing the once per day intake frequency for specific fruits, the AOR of MCI were as follows: melon (AOR 0.279 [95% CI: 0.083–0.937; P = 0.039]), grape (AOR 0.191 [95% CI: 0.050–0.720; P = 0.015]), apple (AOR 0.278 [95% CI: 0.091–0.848; P = 0.024]), pear (AOR 0.163 [95% CI: 0.044–0.610; P = 0.007]), persimmon and dried persimmon (AOR 0.132 [95% CI: 0.037–0.472; P = 0.002]), tangerine (AOR 0.206 [95% CI: 0.058–0.725; P = 0.014]), banana (AOR 0.257 [95% CI: 0.071–0.933; P = 0.039]), orange (AOR 0.205 [95% CI: 0.051–0.825; P = 0.026]), and kiwi (AOR 0.188 [95% CI: 0.047–0.752; P = 0.018]).
Based on increasing the once per day intake frequency of specific milk and dairy products, the AOR of MCI were: milk (low fat, normal) (AOR 0.421 [95% CI: 0.181–0.978; P = 0.044]), liquid-type yogurt (AOR 0.264 [95% CI: 0.087–0.806; P = 0.019]), and curd-type yogurt (AOR 0.263 [95% CI: 0.090–0.770; P = 0.015]).
DISCUSSION
Food intake can be a powerful risk factor in the development of non-communicable diseases, including cardiovascular disease, AD, and vascular cognitive functional impairment, and can act through multiple mechanisms that are related to the lack of nutrients necessary for neuronal regeneration [32]. However, there are few studies on the correlation between food intake and cognitive functional impairment. Thus, this study aimed to (1) assess ordinary food intake patterns in an elderly population for a long period of time and (2) analyze the association of the participants' food habits, including dietary intake, with their cognitive function. With regard to age, participants in their 70s comprised 35.4% of the MCI group, while those in their 60s comprised 41.4 % in the normal group. Age is a risk factor for cognitive impairment [5], and, in this study, there was a significantly higher frequency of occurrence of older participants in the MCI group. Our results showed that increased age was associated with an increased OR (1.076 [95% CI: 1.045–1.108; P < 0.001]) of MCI. Of the factors that might cause cognitive impairment, a previous study [6] observed no significant differences in cognition in terms of sleep duration or sex. However, in the present study, 50.6% of the participants in the MCI group responded that they slept for more than 3 hours and less than 7 hours a day, whereas 48.2% of participants in the normal group responded that they slept for more than 7 hours and less than 9 hours, and these sleep patterns differed significantly. In our study, MCI risk increased with reduced sleep duration (< 3 hours/day) (OR: 7.071 [95% CI: 1.167–42.846; P = 0.033]) and this result was similar to those in previous studies.
Approximately 95.0% of the participants in the MCI group and 73.1% of those in the normal group responded that they did not currently consume alcohol. Alcohol consumption (never) (OR 6.685 [95% CI: 2.302–19.408; P < 0.001]), and alcohol consumption (former) (OR 7.629 [95% CI: 2.386–24.397; P = 0.001]) were associated with an increased risk of MCI. These results were similar to that of a previous study reporting that an appropriate alcohol intake level (approximately 1–2 times a day) decreased symptoms of depression, prevalence of AD, and improved cognitive function in adults over the age of 55 years [33].
A study conducted in 2016 showed that symptoms of depression were associated with physical and mental disorders in approximately 350 million individuals worldwide [34], and, in a 2012 World health organization report, depression was listed as the 4th most common cause of a disease burden. Moreover, it was predicted that depression would become the disease with the highest global disease burden, apart from cardiovascular disease, by 2020 [35]. As shown in Table 2, the SGDS score was 6.8 ± 3.9 in the MCI group and 2.7 ± 3.2 in the normal group. Thus, the risk associated with symptoms of depression was higher in the MCI group. In addition, as the SGDS score increased, the OR of MCI increased by 1.346-fold [95% CI: 1.238–1.465; P < 0.001]). Although there is a relationship between cognitive function and depression, there are limitations in identifying appropriate drug treatments for depression [36], suggesting that studies of non-drug-based nutritional therapies for patients diagnosed with depression are needed. Previous studies have shown that healthy/prudent dietary patterns are inversely related to the risk of exhibiting symptoms of depression [37]. Additionally, in 2017, nutritional and psychiatric researchers reported on dietary recommendations to prevent five of the symptoms of depression [38]. Therefore, people with symptoms of depression may benefit from undergoing nutritional therapy to prevent a progression of cognitive dysfunction.
Although the effect of individual nutrients on health may be relatively easy to analyze, it is difficult to obtain accurate results because of the extinction or synergistic effects of nutrient interactions depending on the dietary patterns, even if the effects of single nutrients are analyzed [39]. Using an SQ-FFQ to analyze the frequency and trends of the overall dietary intake of subjects is believed to be an accurate way to determine the link between disease and diet [40]. Thus, an accurate method for the identification of the correlation between disease and food intake involves the use of an SQ-FFQ to analyze intake frequency and overall dietary intake of the participants. In this study, increasing the once per day rice intake frequency increased the AOR of MCI (95% CI: 1.861–23.684; P = 0.004), whereas increasing the once per day cooked rice with other grains and legumes intake frequency decreased the AOR of MCI (95% CI: 0.452–0.919; P = 0.015). Similarly, increasing the once per day fruit intake frequency decreased the AOR of MCI (95% CI: 0.029–0.616; P = 0.010), and increasing the once per day milk and dairy products intake frequency also decreased the AOR of MCI (95% CI: 0.021–0.469; P = 0.003). In a previous study [15], the 10 food groups that were good for brain health, such as green leafy vegetables, other vegetables, nuts, berries, beans, whole grains, fish, poultry, olive oil, and wine were slightly different from those in a regular Korean diet. Korea, unlike Western countries, has a unique eating culture and traditional meal patterns. Recently, the dietary life of Koreans has diversified, but grain (rice) consumption is still the main food staple.
Staubo et al. [12] reported that whole-grain intake is associated with the size of the temporal lobe of the brain and with the thickness of the arteria cerebri media; in contrast, when whole-grain intake is low, the level of the inflammatory marker IL-6 increases. Archana et al. [41] reported that IL-6 level is associated with cognitive function. The MMSE score was significantly reduced (1.81-fold; 95% CI: 1.20–2.71) in participants with increased IL-6 level compared to that of those with a low IL-6 level [41]. In other words, elderly populations have a high risk of inadequate micronutrient intake (i.e., whole-grain and fruit intakes), which is essential for brain function, and that inadequacy has a negative effect on cognitive function in the elderly.
The frequency of whole-grain intake of the participants in this study (0.9 ± 1.1 times/day in the MCI group, and 1.2 ± 1.0 times/day in the normal group) was relatively low compared to that reported in a study conducted with 409 individuals aged over 60 years in 2012 [38] (1.90 ± 0.08 time/day on average, 1.86 ± 0.11 in the group of participants with cognitive deterioration, and 1.91 ± 0.08 in the normal group), which investigated food and nutrient intake with respect to cognitive function. Based on the 2015 Korean national dietary guidelines [42], consuming grains 2–4 times/day is recommended. According to a USDA guideline, daily intake of at least 3 ounce-equivalents of whole grains per day is recommended. In other words, most of the recommended amount of grain intake is recommended to be whole grains instead of refined white rice. Omid Sadeghi et al. [43] reported that a moderate consumption of whole-grain foods is inversely associated with anxiety and depression in female adults. In addition, they reported a significant positive association between refined grains consumption and depression and anxiety in women [43].
In our study, the participants in the MCI and normal groups had fruit intake frequency levels of 0.2 ± 0.2 time/day and 0.3 ± 0.3 time/day, respectively (Table 6). The level of fruit intake among our study participants was low compared to that of the subjects who participated in a previous study in 2015 [44] in which study a proper fruit intake level significantly decreased the risk of MCI. Thus, the intake of fruit can be an important risk factor in MCI. Moreover, in our study, with regard to fruit intake of specific fruit, the association on risk for MCI was observed to depend on the kind of fruit.
Considering that fruit food groups can be consumed raw, they may be convenient for elderly members of a population because such fruits can be easily consumed. Studies that establish a level of adequate fruit intake for the maintenance of cognitive function, whether raw or cooked, are needed.
In this study, when intake level of cooked white rice was 1–2 times per day, the OR of MCI was 0.116-fold [95% CI: 0.026–0.517; P = 0.005]) of that of an intake ≥ 3 times per day. Similarly, when the intake level of cooked white rice was less than once per day, the OR of MCI was 0.186-fold [95% CI: 0.072–0.483; P =0.001]) of that when consuming cooked white rice ≥ 3 times per day. Recent studies have shown that glucose regulation is associated with regulation of cognitive function. Poor glucose regulation may negatively affect speech and memory recall ability, which may cause chronic cognitive impairment [3945]. Moreover, several studies have shown that glycemic control is associated with the regulation of cognitive function. Poor glucose regulation could lead to chronic cognitive impairment by reducing language ability and memory recall [3945]. Therefore, a follow-up study is needed to investigate the correlations among the intake of white rice, glucose regulation, and MCI. Although guidelines for the recommended food intake for healthy individuals in Korea have been established, a study on the improvement of cognitive function of the rapidly growing elderly population is needed; moreover, the effects of the intake of cooked white rice, whole grains, fruits, and milk and dairy products on cognitive function and glucose regulation must also be assessed.
This study has some limitations. In the SQ-FFQ used in the food intake survey, the participants recalled their intake frequency over a 1-year period. Thus, there may be recollection errors in our data. In an attempt to reduce errors in the SQ-FFQ, we used face-to-face interviews. In addition, the research design has limitations with respect to identifying causality due to its cross-sectional design; thus, it is difficult to generalize from the results. Moreover, generalization is difficult because the participants were recruited from hospitals rather than the general population.
In conclusion, this study investigated the association of food intake on cognitive function in adults aged over 50 years. The interest and efforts of both MCI-affected individuals and their families are needed to improve the cognitive function level of the elderly population, to manage chronic disease resulting from a reduction of medication, to regulate lifestyle habits to encourage a sleep duration for more than 3 hours/day, to moderate alcohol consumption, and to alleviate symptoms of depression. Appropriate intake of whole-grain, fruits, milk, and dairy products was observed to be significantly associated with a decreased risk of MCI. Based on the 2015 Korean national dietary guidelines, it suggested that consuming grain 2–4 times/day, fruit 1–2 times/day, and milk and dairy products 1–2 cups/day can promote the health of an individual [42]. We suggest that further studies should be conducted to analyze the effects of the intake of other commonly consumed foods in addition to cooked white rice. Future studies aimed at developing recommendations for appropriate frequency intake level of commonly consumed food items, other than rice, must be undertaken.
 XML Download