

 PDF
PDF ePub
ePub Citation
 Print
Print


INTRODUCTION
The world's population is aging rapidly. According to United States Census Bureau [1], individuals aged 65 years and over represented 8.5% of the world population in 2015. By 2050, the proportion of the older population is expected to increase to 16.7%. Asian countries are also experiencing a rapid demographic shift towards older population structures, and South Korea is no exception. While life expectancy has increased due to advances in health care, problems in social structure, such as career discontinuity for women and economic difficulties, have led to a decreased marriage rate, and ultimately, a low birth rate in South Korea. By 2000, South Korea was considered an aging society with the proportion of elderly in their population having reached 7.2%. South Korea officially became an aged society in 2018 as people over 65 years old made up 14.3% of the population and it is expected that South Korea will become a super-aged society in 2026 [2]. According to the World Health Statistics 2016 by the World Health Organization, Korea's life expectancy at birth is 82.3 years while its healthy life expectancy at birth is 73.2 years, suggesting that Korean elderly live the last decade of their lives in poor health [3].
Dysphagia is a common health problems related to aging [45]. It is a dietary intake disorders characterized by difficulty or discomfort during the progression of the alimentary bolus from the mouth to the stomach [6]. Dysphagia is caused by changes that impair swallowing, such as weakness or spasticity of various muscles of the upper aerodigestive tract [7], diminished pharyngeal sensory discrimination [4], poor masticatory ability due to fewer remaining teeth [8], and dry mouth and diminished salivary output [9]. According to National Health Statistics Report 2016, 46.7% of the elderly over 65 years old were reported to have functional limitation in oral health, and 44.1% were reported to have difficulty in mastication [10].
Dysphagia can cause serious health problems such as dehydration, suffocation, and death [61112]. Indeed, dysphagia is one of the major causes of aspiration pneumonia in the elderly [1314]. Dysphagia can also lead to malnutrition due to limited food and liquid intake [15] as well as poor dietary quality [16]. Up to 55% of older patients with dysphagia are at risk for malnutrition [6]. In addition, older people with dysphagia may become self-conscious or even anxious about their slow eating, coughing owing to certain foods or liquids, and difficult chewing or swallowing. As a result, older people with dysphagia frequently avoid eating with others which could lead to psychosocial problems that may reduce their quality of life [171819].
Dysphagia generally occurs with certain diseases, such as stroke, Parkinson's disease, Alzheimer's disease, dementia syndromes, and gastro-esophageal reflux disease [1119]. However, dysphagia symptoms have been frequently reported in the elderly due to physiological changes that occur as part of the normal aging process [4514]. Consequently, individuals who do not have diseases related to dysphagia may inaccurately ascribe their swallowing problems to normal aging [720] and therefore never seek appropriate assessment or treatment, despite symptoms of dysphagia [17].
Estimates for the prevalence of dysphagia in older populations living in their own home range from 11% to 35% [8182021222324]. According to the 2008 survey on elderly status in South Korea, 17.1% of the elderly over 60 years old reported to having experienced symptoms of dysphagia [25]. In addition, previous studies targeting elders living at home estimated that 50–65% of older individuals are at risk for dysphagia [26272829]. Therefore, dysphagia should not be ignored even in healthy individuals and it is crucial to screen for dysphagia at an early stage.
Most recent studies on dysphagia have investigated specific populations, such as patients with stroke, aspiration pneumonia, or Parkinson's disease who were either hospitalized or residents of a nursing home [133031]. Few studies have determined the risk of dysphagia in the community-dwelling elderly living at home without any dysphagia-related diseases [2126272829]. These studies aimed to assess the effectiveness of intervention programs, such as oral exercises [3233] and singing interventions [34], develop a screening tool for dysphagia [3536], identify factors affecting dysphagia [1837], or examine the correlation between swallowing disorders and quality of life [29]. However, there are insufficient studies analyzing nutritional problems and food intake behaviors of elderly persons at risk for dysphagia. Therefore, we aimed to determine the risk of dysphagia in community-dwelling elderly and evaluate their nutritional status. In addition, we analyzed the relationship between demographic factors and dysphagia risk as well as dietary characteristics and dysphagia risk to develop future health and nutrition interventions for elderly individuals at risk for dysphagia.
SUBJECTS AND METHODS
Participants
The study sample was composed of 568 community- dwelling individuals, aged 65 years and older, living independently at their own home in Seoul, Gyeonggi, or Gwangju in South Korea. We used convenience sampling in collaboration with civil senior centers. Participants were recruited from 5 senior welfare centers and 12 senior citizen centers. Among subjects who agreed to participate, only those who were capable of feeding themselves without assistance and without any dysphagia-related diseases were included in the study.
Questionnaire development and measures
The questionnaire included questions concerning the individual's general characteristics, symptoms of dysphagia, mastication ability, diet-related characteristics, and nutritional status. Socio-demographic characteristics included sex, age, education level, living status, and perceived economic status.
Dysphagia risk was measured using a translated tool, the revised Dysphagia Risk Assessment Scale developed and validated by Fukada et al. [36], to screen for dysphagia risk in the elderly. The questionnaire is composed of 23 questions in four sections to evaluate a risk of dysphagia. Questionnaire are divided into four sections; oral preparatory and oral dysphagia (8 questions), pharyngeal dysphagia (7 questions), esophageal dysphagia (3 questions), and aspiration (5 questions). The answers to the questions were scored as follows: always = 3, sometimes = 2, rarely = 1, and almost never = 0. The maximum possible score is 69. A total score greater than six points was used to indicate a risk for dysphagia. Regarding the reliability of the questionnaire, the calculated Cronbach's alpha coefficient for the 23-item dysphagia screening questionnaire was 0.85 in the current study.
Mastication ability was evaluated using a method developed by Choi [38]. A total of 10 different foods (Tofu, cooked rice, boiled egg white, napa cabbage kimchi [Korean traditional side dish made form salted and fermented vegetables], meat, kkakdugi [sliced radish kimchi], apple, peanut, dried squid, and candy) were selected based on their hardness and each of foods was given a rating on a scale of 1 to 10. The answers to the question asking difficulty for masticating each food were scored 5-point scale from 1 = very difficult to 5 = very easy. Final mastication ability score was calculated summing the rating scores for every food multiplied by difficulty score replied by respondents. The final score was used to determine the mastication ability according to the following defined threshold: ≥ 155 = able to consume meat, ≥ 129 = able to consume ordinary Korean meal including kimchi, ≥ 107 = able to consume egg, and ≥ 89 = able to consume cooked rice [38]. The construct validity of the tool was evaluated with exploratory factor analysis with varimax rotation. The total explained variance was 77.8%.
Nutritional status was assessed using the the Mini nutritional assessment (MNA) [39]. MNA is a reliable tool for evaluating the nutritional status of older people [40], and has been validated against clinical status and comprehensive nutrition assessment [41]. It is composed of 18 items including 4 anthropometric measures (maximum 8 points), 6 general status questions (maximum 9 points), 6 diet questions (maximum 9 points), 2 self-perceived health and nutrition status questions (maximum 4 points) [42]. After its completion, the final score (maximum 30 points) is used to determine nutritional status according to the following defined thresholds: ≥ 24 = good status, 23.5–17 = risk of malnutrition, < 17 =malnutrition [42].
Data collection
Data were collected from June 30, 2015 to August 11, 2015 after receiving the approval of Institutional Review Board of Myongji University (MJU-2015-06-001-04). The survey was conducted with 584 elderly individuals from 5 senior welfare centers and 12 senior citizen centers in Seoul, Gyeonggi and Gwangju in South Korea. After excluding 16 questionnaires due to missing data, a total of 568 questionnaires were used in the final analysis. Data were obtained by face-to-face interviews. All subjects provided written informed consent to participate in this study.
For consistency of survey methods and procedures, we conducted pre-training for research assistants on conducting interviews and obtaining anthropometric measurements. Height (cm) was measured in the standing position after straightening one's back, from the heel to the top of the head, using a tape accurate to 0.1cm. Weight (kg) was measured using a scale accurate to 0.1 kg. We calculated body mass index (BMI) using height and weight and categorized BMI according to the World Health Organization Asia Pacific cut-offs (< 18.5, underweight; 18.5–22.9, normal weight; ≥ 23, overweight or obesity) [43].
Statistical analysis
Participants who scored 6 or higher using the dysphagia risk assessment tool were classified into the ‘dysphagia risk group (DR),’ and those who scored less than 6 were classified into the ‘normal group (non-DR)’, according to Fukada et al. [36]. The differences between the two groups were analyzed using the χ2 test or Student's t-test.
We performed logistic regression analyses to determine the impact of socio-demographic variables on dysphagia risk. Logistic regression analyses were used to assess the following variables in the DR group: odds for obesity, lowered mastication ability, being at risk for malnutrition or malnourished, lowered appetite, and decrease of food intake. Odds Ratios (OR) and 95% confidence intervals (CIs) were estimated for each variable and the independence of any association was controlled for sex and age.
All data were analyzed using SPSS version 23.0 software (SPSS Inc., Chicago, IL, USA). A P-value < 0.05 was considered statistically significant. Less than 10% of the data were missing from each variable, and thus we excluded missing data from the analysis, rather than using imputation or other methods to account for missing data.
RESULTS
Socio-demographic characteristics, BMI, and dysphagia risk score
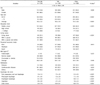
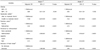
Socio-demographic characteristics, BMI, and dysphagia risk score are presented in Table 1. Of the 568 subjects, 350 (61.6%) were classified into the DR group and 218 (38.4%) were classified into the non-DR group. Significant differences in socio-demographic characteristics, such as sex, age, education level, living status, and perceived economic status, were observed between the DR and non-DR groups. Specifically, the percentage of subjects at risk for dysphagia was 55.0% among men and 66.9% among women, indicating that the risk of dysphagia was significantly higher in women (P = 0.004). In addition, a smaller percentage of subjects with dysphagia risk were between the ages of 65 and 74 years (37.5%) compared to 75 years of age and older (62.5%) (P < 0.001). The average age of the DR group was 76.5 years, which was significantly higher than that of the non-DR group (74.3 years) (P < 0.001).
The education level of the non-DR group was higher than that of the DR group; 43.5% of subjects in the non-DR group had a high school diploma or higher, compared to only 29.3% of subjects in the DR group. For living status, the percentage of subjects living alone was higher in the DR group (28.4%) than in the non-DR group (22.1%). The proportion of subjects who reported “good” economic status was slightly higher in the non-DR group (27.1%) than in the DR group (21.5%), while the proportion of those who reported “poor” economic status was significantly higher in the DR group (33.6%) than in the non-DR group (20.2%) (P = 0.013).
BMI was not significantly different between the two groups. The DR group was taking more medication for diabetes (P < 0.001), cardiovascular diseases (P = 0.018), and other diseases (P < 0.001) compared to the non-DR group.
Mastication ability and nutritional status
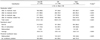
Table 2 shows mastication ability scores and nutritional status of the participants. The mastication ability score of the DR group (165.9) was significantly lower than the non-DR group (215.5) (P < 0.001). Most of the non-DR group (98.6%) were able to masticate kimchi, whereas less of the DR group (76.7%) were able to masticate kimchi (P < 0.001). In addition, only about half of the DR group (56.4%) were able to masticate meat, which was significantly lower than that of the non-DR group (P < 0.001).
We also observed significant differences in nutritional status between the DR and non-DR groups. Overall, the percentage of subjects classified as normal, at risk for malnutrition, and malnourished was 66.2%, 30.8%, and 2.9%, respectively, and the average MNA score (24.4 points) was within normal limits. In the DR group, 39.1% and 4.4% of subjects were classified as at risk for malnutrition and malnourished, respectively, whereas only 17.6% and 0.5% of subjects in the non-DR group were similarly classified (P < 0.001). The average score for the non-DR group (25.9 points) fell within the normal range, while the average score for the DR group (23.5 points) indicated malnutrition risk (P < 0.001). Perceived malnutrition was significantly more prevalent in the DR group (33.7%) compared to that in the non-DR group (10.1%) (P < 0.001).
Diet-related characteristics
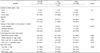
Table 3 shows the results of diet-related questions. Number of meals taken a day did not show any significant differences between the two groups. However, the percentage of the participants reporting their appetite as “bad” was significantly higher in the DR group (51.1%) than in the non-DR group (23.0%) (P < 0.001). Significantly more subjects in the DR group (33.2%) reported a decrease in food intake in the previous 3 months due to reduced appetite, digestive problems, or chewing or swallowing difficulties, compared to those in the non-DR group (12.5%) (P < 0.001). Overall, daily consumption of dairy products was very low, reported by 38.5% of participants. Similarly, only 24.2% of participants reported consuming meat, fish, or poultry on a daily basis. Daily intake of meat, fish, or poultry was reported by significantly fewer participants in the DR group (18.9%) compared to the non-DR group (32.7%) (P < 0.001). In addition, the percentage of participants who reported daily consumption of fruits or vegetables was significantly lower in the DR group (74.6%) than the non-DR group (85.3%) (P = 0.002). Fluid intake was not significantly different between the two groups.
Socio-demographic factors linked to dysphagia risk
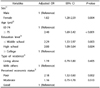
Adjusting for sex and age, logistic regression analysis revealed a significant relationship between dysphagia risk and select socio-demographic characteristics (Table 4).
Women had dysphagia risk significantly more often than men (OR = 1.82, 95% CI = 1.28–2.59) and the subjects aged 75 years or older (OR = 2.40, 95% CI = 1.69–3.42) were more likely to have dysphagia risk compared to those in aged 65–74 years.
With regard to education level, most of dysphagia risk is found in persons with a middle school diploma or lower education (OR = 2.29, 95% CI = 1.33–3.97), followed by persons with high school diploma (OR = 2.00, 95% CI = 1.09–3.64) as compared to those with college graduation or higher education level. The subjects reporting “poor” economic status were more likely to have dysphagia risk (OR = 2.18, 95% CI = 1.32–3.60) compared to those reporting “good” economic status. However, living status (whether living alone or with others) in elderly individuals did not show any relationship with dysphagia risk.
Relationship between dysphagia risk and diet-related characteristics
Adjusted odds ratios for dysphagia risk according to obesity, mastication ability, and diet-related characteristics were presented in Table 5. When adjusting for sex and age (Model 1), the DR were more likely to have lowered mastication ability (OR = 17.00, 95% CI = 5.26–54.91) and risk of malnutrition or malnourished (OR = 3.20, 95% CI = 2.09–4.91) compared to the non-DR group. Participants in the DR group perceived their nutritional status as “malnourished” significantly more frequently compared to those in the non-DR group (OR = 4.15, 95% CI = 2.49–6.93). Lastly, appetite was lower in the DR group (OR = 3.15, 95% CI = 2.13–4.68) and decrease of food intake in the previous 3 months was more frequent in the DR group (OR = 3.17, 95% CI = 1.98–5.08) compared to the non-DR group. When adjusting for education level, living status, and perceived economic status in addition to sex and age (Model 2), similar results were obtained.
DISCUSSION
The objective of this study was to determine the nutritional status and dysphagia risk of Korean elderly living at their own home. We found that 61.6% of participants were at risk for dysphagia. Overall, the average score for dysphagia risk was 8.9 points, which exceeded the cut-off value for dysphagia risk. Previous studies targeting elders who were living at home in Korea have estimated 50 to 65% of subjects are at risk for dysphagia [26272829], which is consistent with our findings. These results suggest that dysphagia risk must not be overlooked in the elderly. Although more than half of the elderly living at home were at risk for difficulty in swallowing, the rate of apparent dysphagia was reported as only 13.5% [28]. The considerable gap can be explained by the tendency of older individuals to inaccurately ascribe swallowing problems to normal aging or their inability to recognize dysphagia risk [202228]. Therefore, it is necessary to identify high-risk groups prior to the appearance of symptoms and to determine the factors that influence dysphagia risk. In addition, there is a need for the development and application of programs to raise awareness among the elderly and educate them on prevention and treatment for dysphagia, because various complications often accompany dysphagia.
Our study showed that the nutritional status of the DR group was poorer than that of the non-DR group. This finding is consistent with a previous study reporting that the annual incidence of ‘malnutrition or malnutrition risk’ (MNA ≤ 23.5) was 18.6% in subjects with basal signs of oropharyngeal dysphagia and 12.3% in those without signs [24]. Furthermore, perceived nutrition status was poorer in the DR group compared to the non-DR group. The average score for nutritional status for all participants was 24.4 points, which fell in the upper normal range. However, approximately one-third (33.7%) of participants were classified as malnourished or at risk for malnutrition. Though this estimate is lower than reported in a previous study [29], our results support the need for nutritional management in the community-dwelling elderly, regardless of dysphagia risk. Older individuals at risk for dysphagia require more intensive management.
A previous study reported that older individuals suffering from poor dentition or dysphagia tend to reduce their intake of vegetables and meat and replace them with high-carbohydrate foods, which are easier to chew and swallow [44]. Our study showed similar results indicating that daily intake of meat, fish or poultry, fruits, and vegetables was significantly lower in the DR group than in the non-DR group. The lower ability of mastication of the DR group could lead to lower consumption of meat fish or poultry, fruits, and vegetables. More than 40% of the DR group was evaluated as not being able to masticate meat and those evaluated as not being able to masticate kimchi amounted to 23.3%. kimchi is basal element of Korean meal as well as a representative menu contributing to vegetable consumption of Korean [45]. Meals of those who are not able to masticate kimchi are limited to high-carbohydrate foods. Moreover, a significant decrease in food intake in the previous 3 months was reported more frequently in the DR group compared to the non-DR group in our study. The DR group also reported significantly lower appetite than the non-DR group. These dietary changes could lead to nutritional imbalances. In particular, nutrients associated with consumption of meat and vegetable, such as protein, vitamins, and dietary fiber, could be deficient in DR group. A previous study demonstrated that elderly with chewing difficulty had a significantly lower intake of potassium, thiamine, niacin, and vitamin C [46].
Our study indicated that dysphagia risk showed a significant association with some socio-demographic variables including sex, age, education level, and economic status. Elderly women had a 1.8 times greater chance of dysphagia risk than elderly men and elderly individuals aged 75 years and older had a 2.4 times greater chance than those aged 65-74 years. Lower educational and economic levels were also related to dysphagia risk. A nationwide survey of the Korean elderly in 2008 reported that the prevalence of dysphagia was greater in women (19.2%) than men (14.2%), and that the prevalence increased with age [25]. The higher rate of dysphagia risk among the elderly aged 75 years and older is the results of physiologic changes that occur during the aging process, such as dry mouth caused by changes of the composition and amount of saliva [9], and decreased strength of the muscles associated with swallowing [47].
Elderly individuals with dysphagia risk showed lowered mastication ability 14.4 times more frequently than those without dysphagia risk and were estimated to be 2.7 times more likely to be at risk for malnutrition after adjusting for potential confounding factors. In addition, the participants with dysphagia risk reported lowered appetite 3.3 times more frequently compared to those without dysphagia risk, which could cause more frequent decrease of food intake in the previous 3 months. Therefore, to efficiently manage the nutritional problems of elderly individuals at risk for dysphagia, women aged 75 years and older with lower education and income levels need to be prioritized in related intervention programs. Particularly, to prevent and manage nutritional imbalances caused by loss of appetite or decrease of food intake in elderly individuals at risk for dysphagia, customized menu plans and education programs must be developed with consideration for their chewing and swallowing problems. These programs should include education in menu planning and cooking methods to encourage variety in the diet, as well as occupational therapy, such as self-exercises, to improve swallowing function.
Our study has several limitations. First, participants in this study were not randomly selected, which makes it difficult to generalize the results to all elderly populations living at home. Therefore, more research is needed to assess dysphagia risk, and to analyze nutritional status and food intake at the community level. Second, MNA is currently used in various populations [42], but it has not yet been validated for the Asian population. As such, further refinement of nutritional assessment tools is needed for community-living older adults in Asian societies. Third, since an interviewer collected data, data could be subject to response bias. Despite these limitations, this study adds valuable information to the limited literature on the relationship of dysphagia risk and nutritional status of elderly living at home. The results of the current study can help develop future health and nutrition interventions for the community-dwelling elderly populations.
 XML Download