

 PDF
PDF ePub
ePub Citation
 Print
Print


INTRODUCTION
Breast cancer, a malignancy that originates from breast tissue, is the most common type of cancer in females [1]. It is estimated that more than 10% of women will be affected by breast cancer during their lifetime [23]. Due to intrinsic resistance mechanisms, breast cancer is usually quite resistant to currently available antitumor drugs [4], and the development of drug resistance during long-term chemical treatment is a major cause of unsatisfactory treatment outcomes, and poor prognosis, in breast cancer patients [56]. In spite of the efforts that have been made to improve breast cancer treatment, the 5-year survival rate is 27%, if the cancer has spread to other body part [1]. At present, early diagnosis and treatment still play key roles in improving the survival of patients with breast cancer.
Hypoxia-inducible factor 1α (HIF-1α) is a subunit of the heterodimeric transcription factor hypoxia-inducible factor 1, which plays pivotal roles in various pathological processes including the development of different types of human malignancies [7]. Because HIF-1α promotes the development of different types of tumors by promoting cancer cell survival and inhibiting cell apoptosis [8], it has become a target for the treatment of a variety of cancer types. The involvement of HIF-1α in breast cancer has been reported by several previous studies [910]. However, HIF-1α signaling transduction and the mechanism of its function have not been fully elucidated. Therefore, our study aimed to investigate the involvement of HIF-1α in breast cancer and to explore the molecular mechanism of its action.
METHODS
Patients
A total of 102 patients with breast cancer were selected in the First Affiliated Hospital of Chongqing Medical University from January 2011 to January 2012. Their ages ranged from 22 to 71 years with an average age of 46±6.7 years. All patients were diagnosed by pathological and imaging examinations, and primary tumors were divided into four stages, namely T1, T2, T3, and T4. Diagnostic criteria were as follows: greatest dimension of tumor ≤20 mm, T1; greatest dimension of tumor >20 mm, ≤50 mm, T2; greatest dimension of tumor >50 mm, T3; tumor of any size with direct invasion of the skin (ulceration or skin nodules) or chest wall, T4. There were 22 patients in T1, 28 in T2, 26 in T3, and 26 in T4. At the same time, 32 healthy females with similar age distribution were enrolled to serve as the control group. The Ethics Committee of the First Affiliated Hospital of Chongqing Medical University approved this study (number: FAHCMU 101020), and all participants signed informed consent forms.
Cell lines and cell culture
Human breast cancer cell lines BT-483 and MCF-7 were purchased from ATCC (Manassas, USA). BT-483 cells were cultured with ATCC-formulated RPMI-1640 medium (cat. no. 30-2001; ATCC) containing 0.01 mg/mL bovine insulin and 20% fetal bovine serum (FBS). MCF-7 cells were cultured in ATCC-formulated Eagle's minimum essential medium (cat. no. 30-2003; ATCC) containing 0.01 mg/mL human recombinant insulin and 10% FBS. Cells were cultured at 37℃ and harvested during logarithmic growth phase for subsequent experiments.
Construction of SMAD family member 3- and HIF-1α-overexpressing cell lines
SMAD family member 3 (SMAD3) and HIF-1α expression vectors were constructed by inserting full-length SMAD3 (T1951; GeneCopoeia, Rockville, USA) and HIF-1α cDNA (T0096; GeneCopoeia) into pIRSE2-EGFP vector (Clontech, Palo Alto, USA). Cells were cultured overnight in Eagle's minimum essential medium (ATCC) containing 10% FBS (FBS was not added in case of chemical treatment) in an incubator (37℃, 5% CO2) to reach 80%–90% confluence. Empty vector without any insertion was used as a negative control. Lipofectamine 2000 reagent (cat. no. 11668-019; Thermo Fisher Scientific Inc., Waltham, USA) was used to transfect 10 nM vector into 4×10⁵ cells. After transfection, cells were cultured in RPMI-1640 medium (Hyclone; GE Healthcare Life Sciences, Logan, USA) at 37℃ for 48 hours before subsequent experiments.
Preparation of serum samples
Fasting blood (15 mL) was extracted from both patients and healthy controls in the morning on the day of admission. Serum was separated from blood by keeping the blood at room temperature for 3 hours followed by centrifugation at 2,000 rpm for 20 minutes.
Cell proliferation assay
Cells were collected during logarithmic growth phase and cell suspension was made. Then, 100 µL of diluted cell suspension containing 4×10⁴ cells was added to each well of a 96-well plate. Cells were cultured and 10 µL cell counting kit-8 (CCK-8) solution (Sigma-Aldrich, St. Louis, USA) was added to each well 24, 48, 72, and 96 hours later. Cells were then cultured at 37℃ for another 4 hours. A Fisherbrand™ accuSkan™ GO UV/Vis Microplate Spectrophotometer (Fisher Scientific Co., Pittsburgh, USA) was used to measure optical density (OD) values at 450 nm. All experiments were performed three times, and three wells were set for each treatment to calculate mean values.
MTT assay
Cells were collected during the logarithmic growth phase and cell suspension was prepared by diluting cells with culture medium containing 10 mM tetraethylammonium (Sigma-Aldrich) to make a final cell density of 5×10⁴ cells/mL. One hundred microliters of cell suspension (6×10³ cells) was then added to each well of a 96-well plate. Cells were cultured at 37℃ for 6 hours, and 10 µL of 3-(4,5-dimethylthiazol-2-yl)-2,5-diphenyltetrazolium bromide (MTT) was then added to each well. Following that, cells were cultured for another 4 hours, OD values were measured at 570 nm using a Fisherbrand™ accuSkan™ GO UV/Vis Microplate Spectrophotometer. Relative cell apoptosis rate was normalized to control cells.
Quantitative reverse transcription polymerase chain reaction
Total RNA was extracted from serum and in vitro cultured cells using Trizol reagent (Thermo Fisher Scientific Inc.). A NanoDrop™ 2000 Spectrophotometer (Thermo Fisher Scientific Inc.) was used to test RNA quality, and RNA samples with an A260/A280 ratio between 1.8 and 2.0 were used to synthesize cDNA through reverse transcription. Polymerase chain reaction (PCR) reactions were prepared using SYBR® Green Real-Time PCR Master Mixes (Thermo Fisher Scientific Inc.). The following primers were used: 5'-TTCACCTGAGCCTAATAGTCC-3' (forward) and 5'-CAAGTCTAAATCTGTGTCCTG-3' (reverse) for HIF-1α; 5'-GCCTGTGCTGGAACATCATC-3' (forward) and 5'-TTGCCCTCATGTGTGCTCTT-3' (reverse) for SMAD3; 5'-GACCTCTATGCCAACACAGT-3' (forward) and 5'-AGTACTTGCGCTCAGGAGGA-3' (reverse) for β-actin. PCR reaction conditions were: 95℃ for 1 minute, followed by 40 cycles of 95℃ for 12 seconds and 62℃ or 58℃ for 38 seconds. The 2−ΔΔCT method was used to process Ct values, and relative expression levels of HIF-1α and SMAD3 were normalized to endogenous control β-actin.
Western blot
Total protein was extracted from in vitro cultured cells using radioimmunoprecipitation assay buffer (RIPA) solution (Thermo Fisher Scientific Inc.), and protein samples were quantified by bicinchoninic acid assay. Following that, 12% sodium dodecyl sulfate polyacrylamide gel electrophoresis was performed using 30 µg protein from each of the samples. After transfer to polyvinylidene difluoride membrane (Thermo Fisher Scientific Inc.), blocking was performed by incubating membranes with 5% skimmed milk at room temperature for 1 hour. This was followed by incubation with primary antibodies, including rabbit anti-TGF-β1 (1:2,000, ab92486; Abcam, Cambridge, UK), anti-HIF-1α (1:2,000, ab51608; Abcam), anti-SMAD3 (1:2,000, ab40854; Abcam), and anti-glyceraldehyde 3-phosphate dehydrogenase (GAPDH) (1:1,000, ab8245; Abcam) overnight at 4℃. After washing with phosphate buffered saline (PBS) for 15 minutes, membranes were incubated with anti-rabbit immunoglobulin G-horseradish peroxidase secondary antibody (1:1,000, MBS435036; MyBioSource, San Diego, USA) at room temperature for 4 hours. Enhanced chemiluminescence (Sigma-Aldrich) was then added and signal was detected using a MYECL™ Imager (Thermo Fisher Scientific Inc.). Relative expression level of each protein was normalized to endogenous control GAPDH using Image J software.
Mouse transplantation
A total of 24 BALB/c-nu mice (20±2 g) were provided by Guangdong Medical Laboratory Animal Center (Guangzhou, China). Mice were randomly divided into three groups with eight mice in each group. One hundred microliters of matrigel (Sigma-Aldrich)/PBS mixture containing 106 MCF-7 cells, HIF-1α-overexpressing MCF-7 cells, or MCF-7 cells transfected with empty vector were subcutaneously injected into the left intercostal space of each mouse. Tumor growth was monitored from day 7 until the end of the 6th week. Slide calipers were used to measure the long diameter (L) and short diameter (W) of tumors. Tumor volume (TV) was calculated every 7 days using the following formula: TV=L×W×0.5. Mice were sacrificed 6 weeks after transplantation and tumor weight was measured.
Statistical analysis
Statistical analyses were conducted using SPSS version 19.0 (IBM Corp., Armonk, USA). The chi-square test was used to process count data. Measurement data were expressed as mean±standard deviation, and Student t-test was used for comparisons between two groups. Analysis of variance and least significant difference tests were used to compare data among multiple groups. Statistical significance was inferred where p<0.05.
RESULTS
Expression of HIF-1α messenger RNA in serum of healthy controls and patients with different stages of breast cancer
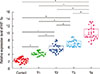
Expression of HIF-1α messenger RNA (mRNA) in serum of healthy controls and patients with different stages of breast cancer was detected by quantitative real-time PCR (qRT-PCR). As shown in Figure 1, expression level of HIF-1α mRNA in serum was upregulated in patients with different stages of breast cancer compared with that in healthy controls. In addition, the expression level of HIF-1α mRNA significantly increased with increasing primary tumor stage (T1–T4). These results suggest that upregulation of HIF-1α expression is very likely to be involved in the progression of breast cancer.
Potential of HIF-1α mRNA in the diagnosis and prognosis of breast cancer
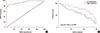
Receiver operating characteristic (ROC) curve analysis showed that the area under the curve (AUC) of HIF-1α mRNA in distinguishing breast cancer patients from healthy controls was 0.9407, with a 95% confidence interval of 0.9041–0.9774 (p<0.0001) (Figure 2A). Based on the median serum level of HIF-1α mRNA, patients were divided into high and low HIF-1α mRNA expression groups. Survival curves were plotted using the Kaplan-Meier method based on data collected during 5-years' follow-up, which was analyzed by log-rank t-test. As shown in Figure 2B, overall survival rate of patients with a high expression level of HIF-1α mRNA in serum was significantly lower than that of patients with lower serum level of HIF-1α mRNA. These data suggest that HIF-1α mRNA expression level may provide a biomarker for the diagnosis and prognosis of breast cancer.
Effects of HIF-1α and SMAD3 on cell proliferation and apoptosis of breast cancer cells
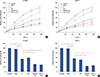
Overexpression of HIF-1α and SMAD3 in cell lines was validated by qRT-PCR (data not shown). Overexpression of HIF-1α and SMAD3 promoted cell proliferation in two breast cancer cell lines (Figure 3A and 3B), and the HIF-1α inhibitor chrysin (5 µM; Santa Cruz Biotechnology, Dallas, USA) also promoted cell proliferation. Treatment with the SMAD3 inhibitor (SIS3) (6 µM; Santa Cruz Biotechnology) reduced cell proliferation. In addition, HIF-1α and SMAD3 overexpression significantly inhibited cell apoptosis in two breast cancer cell lines (p<0.05) (Figure 3C and 3D). Apoptosis was also significantly promoted by the HIF-1α inhibitor chrysin and by SIS3 treatment (p<0.05) (Figure 3C and 3D).
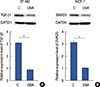
HIF-1α is a positive upstream regulator of the TGF-β1/SMAD3 pathway in breast cancer
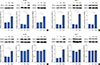
As shown in Figure 4A and 4B, HIF-1α overexpression significantly increased the expression levels of TGF-β1 and SMAD3 in two breast cancer cell lines (p<0.05). However, SMAD3 overexpression showed no significant effects on the expression of HIF-1α or TGF-β1 in these two cell lines (p<0.05) (Figure 4C and 4D). Dimethyl-bisphenol A (DBA) is an HIF inhibitor that promotes HIF-1α degradation. In our study, DBA (0.05 mM, sc-205650; Santa Cruz Biotechnology) significantly reduced the accumulation levels of HIF-1α in two cell lines (data not shown). In addition, DBA treatment significantly decreased the expression levels of TGF-β1 and SMAD3 in two cell lines (p<0.05) (Figure 5). These data suggest that HIF-1α is a positive upstream regulator of the TGF-β1/SMAD3 pathway in breast cancer.
HIF-1α overexpression promoted growth of transplanted tumors in mice
Figure 6A shows representative tumors collected 6 weeks after the injection. Tumor volume was recorded every week from week 1 to week 6. As shown in Figure 5B, the growth of tumors derived from HIF-1α-overexpressing MCF-7 breast cancer cell lines was faster than that of tumors that derived from MCF-7 cells or MCF-7 cells transfected with empty vector (Figure 6B). In addition, weight of tumors derived from the HIF-1α-overexpressing MCF-7 breast cancer cell line was also significantly higher than that of tumors derived from MCF-7 cells or MCF-7 cells with empty vector transfection (Figure 6C). These data suggest that HIF-1α overexpression may promote breast tumor growth in vivo.
DISCUSSION
Previous work has shown that HIF-1 can regulate genes involved in a wide range of biological processes including cell survival, glucose metabolism, angiogenesis, and cell invasion, and these are all important for both the growth and the development of cancers [7]. Expression of HIF-1α, which is a subunit of HIF-1, is upregulated by intratumoral hypoxia and genetic alterations. Overexpression of HIF-1α therefore occurs during the onset, development, and progression of human malignancies [7]. In a recent study, Wang et al. [11] reported that HIF-1α is highly expressed in patients with breast cancer compared with that in healthy controls, and they showed significant correlations between HIF-1α expression and features of aggressive tumors. High expression of HIF-1α has also been seen during the development of prostate cancer, in which it is involved in regulating cancer cell invasion [12]. Other relevant work on elevated HIF-1α expression in cancer includes a study linking it with the development and progression of breast cancer in Africa [13]. Furthermore, inhibition of HIF-1α shows promise as an anticancer strategy, for example tanshinone IIA, an active ingredient of Salvia miltiorrhiza bunge, has been proved to achieve anticancer activity through inhibition of HIF-1α expression [14]. In our study, HIF-1α was found to be significantly upregulated in patients with different stages of breast cancer compared with that in healthy controls. In addition, the expression level of HIF-1α mRNA significantly increased with increasing primary tumor stage. These data provide an advance on previous work by demonstrating a correlation between HIF-1α expression level and disease progression in patients with breast cancer, since previous studies have not included tumor staging [1112]. Our study therefore provides substantial support to the hypothesis that upregulation of HIF-1α expression is involved in the pathogenesis of breast cancer.
At present, the key to survival for patients with breast cancer is early diagnosis and treatment, which require highly sensitive and accurate biomarkers. Level of HIF-1α mRNA has been used previously in the diagnosis of certain types of malignancies including prostate cancer [15], and has achieved satisfactory diagnostic specificity as well as sensitivity. In addition, overexpression of HIF-1α has long been considered a marker of unfavorable prognosis in different types of malignant tumors including early-stage invasive cervical cancer [16]. In our study, ROC curve analysis showed that serum HIF-1α mRNA level can be used to accurately and effectively distinguish breast cancer patients from normal healthy controls. In addition, overall survival rate of patients with high expression levels of HIF-1α mRNA in serum was significantly lower than that of patients with lower serum level of HIF-1α mRNA. These data suggest that measurement of HIF-1α mRNA expression levels in serum may provide a reference for the diagnosis and prognosis of breast cancer. However, it is worth noting that overexpression of HIF-1α is observed in various other of human diseases, including lung cancer [17], and liver cancer [18], so, multiple biomarkers are required for diagnostic specificity.
Understanding the mechanism of HIF-1α activity remains incomplete. It can affect multiple pathways, including glucose metabolism, to promote tumor growth and inhibit apoptosis [19]. In our study, HIF-1α overexpression promoted cell proliferation and inhibited apoptosis in two breast cancer cells lines, while HIF-1α inhibitors produced the opposite effects. We also showed that HIF-1α overexpression promoted the growth of transplanted tumors in nude mice. Involvement of the TGF-β/SMAD3 axis in the regulation of proliferation and apoptosis in breast cancer cells has been demonstrated previously [20]. In this study, SMAD3 overexpression showed similar effects on breast cancer cell proliferation and apoptosis to those of HIF-1α overexpression. It has been reported that HIF-1α activates the participation of the TGF-β/SMAD3 pathway in certain physiological processes [21]. In the present study, HIF-1α overexpression significantly increased the expression levels of TGF-β1 and SMAD3 in breast cancer cells, while SMAD3 overexpression showed no significant effects on the expression of HIF-1α or TGF-β1. These data suggest that HIF-1α is a positive upstream regulator of the TGF-β1/SMAD3 pathway in breast cancer.
In conclusion, increased serum levels of HIF-1α effectively distinguish breast cancer patients from healthy controls. HIF-1α may serve as an upstream regulator of the TGF-β1/SMAD3 pathway to promote the growth of breast cancer.

 XML Download