

 PDF
PDF ePub
ePub Citation
 Print
Print


Abstract
Objectives
Methods
Results
Conclusions
Figures and Tables
Fig. 1
National Food Analysis System
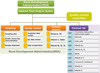
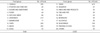
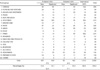
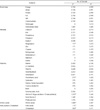
Table 3
The source of nutrient data in 9th revision Korean Food Composition Table
1) Rural Development Administration, Food Composition Table
2) National Institute of Fisheries Science, Chemical Composition of Marine Products in Korea
3) Ministry of Food and Drug Safety, Food Composition Database
4) National Institute of Health, Journal of National Institute of Health
5) Research articles published in Korea
6) Ministry of Education, Culture, Sports, Science and Technology (MEXT), Standard Tables of Food Composition in Japan (Seventh Revised Edition)
7) United States Department of Agriculture. Food Composition Database, Standard Reference 28
Table 4
Number of foods in 9th revision Korean Food Composition Table by listing for each nutrients (proximates)
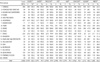
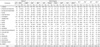
Table 5
Number of foods in 9th revision Korean Food Composition Table by listing for each nutrients (amino acids)
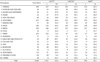
Table 6
Number of foods in 9th revision Korean Food Composition Table by listing for each nutrients(fatty acids and cholesterol)
1) FAFRE: Total fatty acid, 2) FAESS: Total essential fatty acid, 3) FASAT: Saturated Fatty acid, 4) FAMS: Monounsaturated fatty acid, 5) FAPU: Polyunsaturated fatty acid, 6) CHOLE: Cholesterol, 7) The comprehensiveness(%) of the database by listing for each nutrient the number of food items that contain data
Table 7
Number of foods in 9th revision Korean Food Composition Table by listing for each nutrients (minerals)
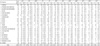
1) CA: Calcium, 2) FE: Iron, 3) MG: Magnesium, 4) P: Phosphorus, 5) K: Potassium, 6) NA: Sodium, 7) ZN: Zinc, 8) CU: Copper, 9) MN: Manganese, 10) SE: Selenium, 11) MO: Molybdenum, 12) ID: Iodine, 13) The comprehensiveness (%) of the database by listing for each nutrient the number of food items that contain data
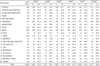
Table 8
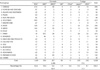
Number of foods in 9th revision Korean Food Composition Table by listing for each nutrients (vitamins)
1) RETOL: Retinol, 2) CARTB: β-Carotene, 3) THIA: Thiamin, 4) RIBF: Total Riboflavin, 5) NIA: Total Niacin, 6) PANTAC: Pantothenic acid, 7) PYRXN: Pyridoxine, 8) BIOT: Biotin, 9) FOL: Dietary Folate Equivalent, 10) VITB12: Cyanocobalamin, 11) VITC: Total Ascorbic Acid, 12) VITD: Vitamin D (Ergocalciferol + Cholecalciferol), 13) VITE: Total Vitamin E, 14) VITK1: Phylloquinone, 15) The comprehensiveness (%) of the database by listing for each nutrient the number of food items that contain data
Table 9
Summary of number of food items in 8th and 9th revision Korean Food Composition Table
1) Tables of Food Functional Composition – Mineral/Fatty acid, 2010
2) Tables of Food Functional Composition – 1st edition, 2009
3) Tables of Food Functional Composition – Fat-soluble vitamin, 2012
4) Tables of Food Functional Composition – Amino acid, 2011
5) Tables of Food Functional Composition – Cholesterol, 2012
 XML Download