

 PDF
PDF ePub
ePub Citation
 Print
Print


INTRODUCTION
Obesity is a global public health issue that has generated great interest [12] because of the increased risk of chronic diseases associated with it, such as cardiovascular disease and metabolic syndrome (MetS) [3,4,5]. Recently, there has been a worldwide increase in the prevalence of obesity in children, adolescents and adults [678910], including Korea. The prevalence of obesity in Korean boys aged 6–18 years has increased from 10.3% in 2001 to 13.4% in the 4th Korea National Health and Nutrition Examination Survey (KNHANES) period (2007–2009) and 13.7% in the 6th KNAHNES period (2013–2015). The prevalence of obesity in girls aged 6–18 years increased from 7.6% in 2001 to a stable 9.5% observed in the 5th KNHANES period (2010–2012) [1112]. In particular, childhood obesity leads to adult obesity, thereby increasing the prevalence of chronic diseases and mortality caused by associated diseases [131415]; a national management is therefore required to reduce and prevent obesity at the consequent ages [1617].
Factors affecting childhood obesity include diet, physical activity, and socioeconomic factors [1819]. Among the dietary factors, sugar intake is the main cause for childhood obesity. Many studies have focused on the association between childhood obesity and sugar intake included in cookies and beverages [2021222324]. With westernized eating habits and increased development of the food industry in Korea [25], processed food intake has also multiplied [26]. Although some studies have published the relation between sugar intake from processed food and childhood obesity [2728], it remains poorly understood.
According to the Ministry of Food and Drug Safety (MFDS) [29], the primary source of total sugar intake from processed foods in 2013 was beverage (31.1%) and the second highest source was bread, cookie and rice cake (13.6%). In terms of age, the primary source for children aged 3–5 years was bread, cookie and rice cake, whereas the primary source for children aged 6 years or above was beverage. The primary beverage source for children aged 1–5 years was fruits and vegetable beverages, and for children aged 6–29 years it was carbonated beverage. In addition, Lee HS et al. [27] ranked the total sugar intake from several beverage sources in Korean people from 2008–2011; carbonated beverages topped the total sugar intake from among the different beverage sources in subjects aged 6–29 years.
By 2020, the MFDS is implementing ‘the first phase of sugar intake reduction plan (2016–2020)’ to maintain total sugar intake from processed food to within 10% of daily calories [29]. In Korea, the beverage and carbonated beverages intake has increased in children aged 6 years or above; in-depth studies will therefore be conducted on the increased beverage intake which is the main source for total sugar intake from processed foods. In particular, it is important to manage dietary habits during childhood [30], since these habits are usually retained in adulthood [31].
This study examined the association between beverage intake and childhood obesity by using a database for sugar contents of all foods, presented in the results of the nutrition survey of the 6th KNHANES (2013–2015).
SUBJECTS AND METHODS
Study design and subjects
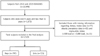
In this study, we used data from the 6th KNHANES (2013–2015) of Korea Centers for Disease Control & Prevention (KCDC) belonging to Ministry of Health and Welfare. This survey was reviewed by the Institutional Review Board of the Korea Centers for Disease Control and Prevention (2013-07CON-03-4C, 2013-12EXP-03-5C) for the years 2013 and 2014. KNHANES has been exempted from review following the Bioethics and Safety Act since 2015. Fig. 1 shows the flow chart of subjects included in the analysis. Of the total 22,948 individuals from the 2013–2015 KNHANES, 1,673 subjects were aged 6–11 years. Of these, the following subjects were excluded: 77 subjects with missing information regarding dietary intake data, 65 subjects with missing information regarding obesity prevalence data, and 11 subjects with implausible intake (< 500 kcal or > 5,000 kcal). A total of 1,520 subjects (797 boys and 723 girls) were included in the final analysis.
Measurements
Determination of obesity
To determine obesity, Body Mass Index (BMI; kg/m2) was calculated using the height and weight included in the physical measurement data of KNHANES. According to the 2007 standard growth chart for children and adolescents, subjects were classified as obese (BMI at or higher than 95th percentile or at or higher than 25) and overweight (BMI between the 85th and 94th percentiles) (‘2014 Clinical Practice Guidelines for Overweight and Obesity in Korea’ provided by Korean Society for the Study of Obesity) [32].
Classification of beverages in processed foods and total sugar intake
In this study, a database for classification of beverages in processed foods and total sugar intake was established using the ‘Sugar database compilation for commonly consumed foods 2015’ by MFDS [33]. The intake was calculated by combining the database and nutrition survey using the 24-hour recall method provided by the KNHANES.
To identify the main food sources for total sugar, all foods were divided into four groups: (i) raw foods (agricultural, fishery, aquatic products), (ii) fruits (excluding juice), (iii) milk (includes white milk and powdered milk), and (iv) processed foods (excluding white milk and powdered milk). In the processed foods, beverages were further sub-divided into 5 groups: fruits & vegetable beverages, tea, coffee, carbonated beverages, and other drinks including soybean milk. According to the classification of food codes by MFDS, beverages are categorized into 8 groups: fruits & vegetable beverages, tea, coffee, carbonated beverages, soybean milk, fermented drinks, ginseng & red ginseng drinks, and other drinks. In our study, ‘other drinks including soybean milk’ included soybean milk, fermented drinks, ginseng & red ginseng drinks, and other drinks. We grouped all the foods and beverages based on an earlier study on dietary total sugar intake of Koreans [27].
The mean daily total food intake, processed food intake, energy intake, carbohydrate intake, and total sugar intake from total food are presented. We further calculated the proportion of subjects consuming more than 20% daily energy intake from total sugar and more than 10% daily energy intake from total sugar in processed food. Among the processed foods, the beverage intake and total sugar intake included in beverages are presented. To calculate the odds ratio for obesity according to daily beverage intake, carbonated beverage intake, and fruits and vegetable beverage intake, the data is divided into two groups: 200 mL/day or less (< 200 mL/day) and 200 mL/day or more (≥ 200 mL/day). One serving size of beverages presented in food labeling is commonly 200 mL.
Statistical Analysis
Because the data of the KNHANES were acquired using the complex sampling design method, variance of cluster sampling (PSU), variance of stratified sampling (KSTRATA), and the individual integrated weights were applied. Analysis of continuous variables across the sex and beverage intake groups was done using the Chi-square test. Categorical variables were analyzed with T-test of general linear model and are presented as percentage and standard error. Multiple logistic regressions were analyzed to obtain odd ratios (OR) and 95% confidence interval (CI) adjusting for covariates. Three models are presented as follows: confounding variables which affected odds ratio were not adjusted (Model 1); only sex and age were adjusted (Model 2); sex, age, household income, energy density, and region were adjusted (Model 3). ‘Physical activity’ does not exist in the study as a variable, since the KNHANES data has no variable for physical activity in children aged less than 12 years. All data were analyzed using the SPSS Statistics 24.0 (SPSS Inc., IBM corp., NY, USA). All P-values were two-sided, and statistical significance was set at P < 0.05.
RESULTS
General characteristics of subjects
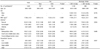
Table 1 shows the general characteristics of the subjects according to sex and beverage intake. The mean age of all subjects was 8.64 years. BMI of boys and girls was 18.04 kg/m2 and 17.29 kg/m2, respectively. BMI of boys was significantly higher than that of girls (P < 0.001). In terms of obesity, 82.34%, 11.07% and 6.58% of subjects were normal weight, overweight and obese, respectively. Obese boys and obese girls were 5.88% and 7.33%, respectively.
BMI of the beverage intake group that consumed ≥ 200 mL/day was significantly higher than that of group that consumed < 200 mL/day, being 18.23 kg/m2 and 17.48 kg/m2, respectively (P = 0.002). The obesity ratio of beverage drinkers who consumed ≥ 200 mL/day was higher than that of subjects who consumed < 200 mL/day, but there was no significant difference. No difference was observed in the region and household income according to sex and beverage intake.
Mean daily nutrient intake and total sugar intake of subjects in food
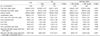
Results of the average daily food intake and total sugar intake of the subjects are listed in Table 2. The average daily total food intake (g/day) and average daily energy intake (kcal/day) of boys was 1,335.96 g/day and 2,009.33 kcal/day, respectively, whereas those of girls was 1,229.11 g/day and 1,769.46 kcal/day, respectively. Both factors were significantly higher in boys (P = 0.001 and P < 0.001, respectively). The average daily carbohydrate intake of boys (303.54 g/day) was also significantly higher than that of girls (271.85 g/day) (P < 0.001). However, no significant difference was observed in the average daily processed food intake according to the gender. To identify main food source of total sugars, the foods were divided into commodity type foods, fruits, milk, and processed foods. Daily total sugar intake from milk in girls (5.32 g/day) was significantly lower than that in boys (7.54 g/day) (P < 0.001), whereas daily total sugar intake from fruits in girls (17.29 g/day) was higher than that in boys (14.79 g/day) but with no significant difference. The ratio of girls consuming more than 20% daily energy intake from total sugars (33.6%) and more than 10% daily energy intake from total sugar in processed foods (51.16%) was significantly higher than that of boys (25.74% and 44.84%, respectively) (P = 0.002 and 0.026, respectively).
The average daily total food intake, processed food intake, average daily energy intake, and average daily carbohydrate intake of beverage drinkers who consumed < 200 mL/day was 1,180.65 g/day, 446.71 g/day, 1,809.94 kcal/day and 276.05 g/day, respectively. The average intake of subjects who consumed ≥ 200 mL/day was significantly higher (P < 0.001), being 1,576.76 g/day, 869.70 g/day, 2,129.42 kcal/day and 322.64 g/day, respectively. Total sugars from total food and processed food consumed by subjects drinking ≥ 200 mL/day (107.97 g/day and 81.22 g/day, respectively) was significantly higher than subjects drinking < 200 mL/day (69.13 g/day and 40.25 g/day, respectively) (P < 0.001). However, total sugar from milk consumed by beverage drinkers having < 200 mL/day (7.05 g/day) was significantly higher than that of subjects drinking ≥ 200 mL/day (4.82 g/day) (P < 0.001). The ratios of > 20% daily energy intake from total sugars and > 10% daily energy intake from total sugar in processed foods was significantly greater in subjects who consumed ≥ 200 mL/day (49.47% and 82.28%, respectively) as compared to subjects who consumed < 200 mL/day (22.45% and 35.68%, respectively) (P < 0.001).
Beverage intake and total sugar intake in beverage according to beverage intake
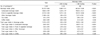
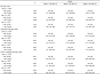
Table 3 shows the daily beverage intake and total sugar intake in beverages, according to the amount of beverage consumed. Daily beverage intake of all subjects was 131.75 g/day. The daily beverage intake of beverage drinkers ≥ 200 mL/day (407.42 g/day) was significantly higher than that of beverage drinkers < 200 mL/day (33.89 g/day) (P < 0.001). Considering the type of beverages consumed, significant differences were observed between carbonated beverage intake, fruit & vegetable beverages, and other beverages (P < 0.001); the ratios in subjects who consumed ≥ 200 mL/day were 190.01 g/day, 135.75 g/day and 72.57 g/day, respectively, and in subjects who consumed < 200 mL/day were 12.29 g/day, 15.75 g/day and 3.90 g/day, respectively. Also, the daily total sugar intake in beverages for all subjects was 13.76 g/day; consumption in beverage drinkers ≥ 200 mL/day (40.42 g/day) was significantly higher than that of beverage drinkers < 200 mL/day (4.30 g/day) (P < 0.001). Significant differences were also observed in daily total sugar intake from carbonated beverages, fruits & vegetable beverages, and other beverages depending on the beverage intake (P < 0.001); the respective ratios in subjects consuming ≥ 200 mL/day were 20.57 g/day, 15.04 g/day and 4.22 g/day, respectively. and in subjects consuming < 200 mL/day were 1.32 g/day, 2.29 g/day and 0.31 g/day, respectively.
Carbonated beverages had the highest beverage intake and total sugar intake when considering total children and beverage drinkers ≥ 200 mL/day, followed by fruits & vegetable beverages, other beverages, tea, and coffee. However, fruits & vegetable beverages were the highest beverages consumed and contributed total sugar intake in beverage drinkers < 200 mL/day.
Odds ratios for obesity according to beverage intake, carbonated beverage intake and fruits and vegetable beverage intake
To examine the odds ratios between obesity and beverage intake, carbonated beverages intake and fruits and vegetable beverage intake, the data were divided into three different models: Model 1 (no adjustment), Model 2 (sex, age), and Model 3 (sex, age, household income, region, and energy density). The results are presented in Table 4. Analysis of Models 1 and 2 revealed that odds ratio for obesity was significantly increased in beverage intake of total children and girls when ≥ 200 mL/day were consumed, as compared to consumption of < 200 mL/day. It was also observed that odds ratio for obesity was significantly increased considering the intake of carbonated beverages in total children and boys when subjects consumed ≥ 200 mL/day as compared to those who consumed < 200 mL/day. Particularly in Model 3 (further adjusted for all factors), the odds ratio for obesity according to beverage intake in total children who consumed ≥ 200 mL/day significantly increased 1.83 times (95% CI, 1.11–3.00) when compared to total children who consumed < 200 mL/day. The odds ratio for obesity according to carbonated beverages intake in total children and boys significantly increased by 2.41 times (95% CI, 1.35–4.33) and 3.15 times (95% CI, 1.53–6.49), respectively. However, no differences were observed in odds ratio for obesity when considering fruits & vegetable beverage intake in Models 1, 2, and 3.
DISCUSSION
Our goal was to investigate the association between childhood obesity and beverage intake, which is one of the main sources of total sugar intake from processed foods. This study analyzed the daily total sugar intake in Korean children; the mean daily total sugar intake was 79.31 g/day (boys: 80.00 g/day, girls: 78.57 g/day), as compared to the daily total sugar intake of boys and girls aged 6–11 years in the United States (126 g/day and 120 g/day, respectively) and Austria (daily total sugar intake of children aged 4–8 years was 103 g/day) [34]. These results show that the total sugar intake of Korean children is lower than that of children in Western countries [34].
In the current study, the ratio of the subjects consuming more than 10% of energy intake from total sugar in processed foods was 47.9%; almost half the children consumed more than 10% of energy intake from total sugar in processed food. Although recommended levels of dietary restriction of added sugar and free sugar differ slightly in each country, most countries recommend less than 10% of total energy intake. The World Health Organization (WHO) recommends that intake of free sugars should be less than 10% of total energy intake [35], which has recently under review whether the recommended levels of dietary restriction of sugars should be reduced to 5% or less. The 2015 edition of the Dietary Guidelines for Americans recommends that added sugar intake should be less than 10% of total energy [36]. Nordic Nutrition Recommendations 2012 advises the added sugar intake should be less than 10% of total energy intake [37]. The Korean Nutrition Society recommends that the daily total sugar intake of Korean people should be less than 10–20% of the total energy intake. Taken together, all studies recommend that sugars added in cooking or processing foods should be less than 10% of total energy intake [38]. Therefore, it is necessary to have a national management of total sugar intake from processed foods for children. In particular, the beverages in processed foods account for a large portion of total sugar intake [39404142]. As the results of this study reveal, since carbonated beverages are the primary source of beverage consumption in children, there is an urgent requirement for a national management of total sugar intake from processed food and the differentiated sugar reduction policy in beverages for children.
Analysis of the odds ratio for obesity according to beverage intake reveals that the odds ratio of the group with intake of ≥ 200 mL/day increased by 1.83 times (95% CI, 1.11–3.00) when compared with the group having an intake < 200 mL/day. However, no significant difference was observed between fruits & vegetable beverages intake and obesity, although fruits & vegetable beverages constitute the second largest consumption. In a previous domestic study, the odds ratio for obesity in girls of the group with highest sugar intake from milk and fruits was 0.42 times lower (95% CI, 0.23–0.79) when compared with the group with lowest sugar intake [43]. On the other hand, an external study showed a positive association between calories from fruit juices and obesity [44]. Generally, since fruits & vegetable beverages contain a lot of sugar, researches on the relationship between fruits & vegetable beverage and chronic diseases need to be reported. Also, previous studies of children in western countries have shown that beverage intake is associated with weight gain and obesity [2345]. There are few studies presenting the association between beverage intake and childhood obesity in Asian countries, and these too have no consistency [43]. Thus, there is a requirement to conduct further studies on sugars included in beverages.
We further analyzed the odds ratio for obesity according to carbonated beverages which was the primary source of total sugar intake. Although no odds ratio of obesity was observed in girls, the odds ratio of obesity in total children and boys was significantly increased. This could be because the carbonated beverage intake of girls is lower than that of boys. Although more studies are required to investigate sugar intakes from beverages in Korean children, previous studies have shown that obesity is associated with intake of carbonated beverages [464748]. Carbonated beverages include high contents of high-fructose corn syrup with high energy density thereby increasing the calorie intake leading to increased risk of obesity [45495051]. Thus, the results of this study can be used as scientific evidence for a sugar reduction policy in Korea.
There are some limitations to this study. First, as the contents of added sugars could not be clearly identified through a database for total sugars, the total sugar intake from processed foods was presented. Second, since this study was a cross-sectional study, we were able to present the association between beverage intake and obesity prevalence, but it was difficult to clarify the causal relationship with occurrence of obesity. Third, since the intake was calculated by the food code that appeared in the 24-hour recall method of KNHANES, the amount reported could be more or less than the usual intake.
Despite these limitations, there are several advantages in this study. First, since very few studies have researched the association of beverage intake and chronic diseases, this study can be used as scientific evidence for introducing a sugar reduction policy for children in Korea. Second, although the research was conducted using the limited databases for contents of sugars in Korea, this study used a database for total sugar intake in all foods shown in the 6th KNHANES which has been recently presented. Thus, we were able to study the beverage intake and sugar intake of Korean children and present the main sources of beverage. The study data could be utilized for implementing a sugar reduction policy in future.
In conclusion, our study accomplished in obtaining data showing a positive association between obesity and beverage intake and carbonated beverages intake in Korean children. In particular, carbonated beverages were the primary source of beverage consumption in Korean children, with total sugar intake from carbonated beverage being the highest total sugar intake from beverages. There are few prior studies that reveal the association between beverage intake and childhood obesity in Asian countries, including Korea. Thus, future researches are required to study the sugars included in beverages.
 XML Download