Journal List > Nutr Res Pract > v.12(4) > 1099397

Ndahimana, Choi, Park, Ju, and Kim: Validity of predictive equations for resting energy expenditure in Korean non-obese adults

Abstract

BACKGROUND/OBJECTIVES

Indirect calorimetry is the gold-standard method for the measurement of resting energy expenditure. However, this method is time consuming, expensive, and requires highly trained personnel. To overcome these limitations, various predictive equations have been developed. The objective of this study was to assess the validity of predictive equations for resting energy expenditure (REE) in Korean non-obese adults.

SUBJECTS/METHODS

The present study involved 109 participants (54 men and 55 women) aged between 20 and 64 years. The REE was measured by indirect calorimetry. Nineteen REE equations were evaluated for validity, by comparing predicted and measured REE results. Predictive equation accuracy was assessed by determining percent bias, root mean squared prediction error (RMSE), and percentage of accurate predictions.

RESULTS

The measured REE was significantly higher in men than in women (P < 0.001), but the difference was not significant after adjusting for body weight (P > 0.05). The equation developed in this study had an accuracy rate of 71%, a bias of 0%, and an RMSE of 155 kcal/day. Among published equations, the FAOweight equation gave the highest accuracy rate (70%), along with a bias of −4.4% and an RMSE of 184 kcal/day.

CONCLUSIONS

The newly developed equation provided the best accuracy in predicting REE for Korean non-obese adults. Among the previously published equations, the FAOweight equation showed the highest overall accuracy. Regardless, at an individual level, the equations could lead to inaccuracies in a considerable number of subjects.

INTRODUCTION

Obesity and its associated chronic diseases have become among the most worrying public health concerns, and their rates of occurrence have been increasing [12]. Appropriate obesity prevention and management strategies involve the ability to accurately measure energy expenditure and to use the results as a basis for estimating energy requirements in clinical practice, in epidemiologic studies, and in community interventions. Resting energy expenditure (REE) represents the largest component (60% to 75%) of total daily energy expenditure (TEE) [3]. Therefore, REE is an important contributor to the person's energy balance and its assessment is critical for effective weight management. REE is defined as the energy expended by a fasting person at rest and in a thermo-neutral environment. It is the energy required to maintain basic metabolic activities, including maintaining body temperature and the functioning of vital organs such as brain, kidneys, heart, and lungs [3]. Indirect calorimetry is the gold-standard method for determining REE [4]. However, this method is time consuming and not always practical, especially due to the high cost of machines and the requirement of highly trained personnel.
To overcome these limitations, various predictive equations have been developed based on the body weight, height, age, and sex, as well as other variables such as fat-free mass, fat mass, and body mass index (BMI) [56]. Most of these equations have been developed in Caucasians and, considering ethnic variations, may be invalid in Asian populations such as that in Korea. Studies have shown that, compared to Caucasians, Asians tend to have a lower REE, which has been attributed to differences in body composition [78]. Until now, few studies have been conducted to validate the REE predictive equations in Korean adults. The objective of this study was to assess the validity of predictive equations for REE in Korean non-obese adults.

SUBJECTS AND METHODS

Study participants

One hundred and nine participants (54 men and 55 women) aged between 20 and 64 years (yrs) were involved in the present study. They were recruited from Gangwon province, Korea. Recruitment was done by posting an online announcement, as well as recruitment posters that were displayed at Gangneung-Wonju National University notice board and at local community centers. Applications for participation were received through Email, as well, direct visits to community centers were conducted for recruitment. To be included in the study, the participants had to: (1) be a healthy adult between 20 and 64 yrs old, (2) not be underweight or obese (18.5 ≤ BMI < 30), (3) not be regularly involved in extreme activities (e.g., an athlete), and (4) not be taking medicines that affect energy metabolism. To ensure good representativeness, we used a quota sampling approach, based on the participants' gender and age group. The study included the same percentage of men and women, and five age groups were formed (20–29 yrs, 30–39 yrs, 40–49 yrs, 50–59 yrs, and 60–64 yrs) with balanced male/female percentages (Table 2). Before undertaking measurements, approval was obtained from the Gangneung-Wonju National University Institutional Review Board (approval number: GWNUIRB-2014-2). In addition, every participant signed an informed consent before enrolling in the study.

Anthropometric measurements and body composition

Anthropometric measurements were obtained with participants wearing light-weight clothing. Height was determined to the nearest 0.5 cm by using a stadiometer, and weight was measured to the nearest 0.1 kg by using the physician's scale. BMI was calculated as weight (kg) divided by the square of height (m). The participants' body composition was assessed by applying the bioelectrical impedance analysis (BIA) method and using an Inbody 720 body composition analyzer (Biospace, Korea).

Indirect calorimetry

The REE was measured by indirect calorimetry in a thermoneutral environment with a ventilated canopy and a dilution pump system (ParvoMedics Trueone 2400, ParvoMedics Corp. UT, USA). The system was calibrated daily with a gas standard and it was automatically recalibrated every 5 min during measurement. The participants arrived at the laboratory after fasting for at least 4 hours (h); in addition, they had been instructed to abstain from intense physical activity during the 24 h preceding the measurement. After having their anthropometric measurements taken, they were instructed to sit quietly for at least 10 min after which they reclined in a supine position and a ventilated canopy was placed over their head. Measurement duration was at least 15 min. The first 5 min of each measurement were routinely discarded and only the steady-state period of measurement (10 min) was used for calculation of REE. The REE was determined from the volume of consumed oxygen (VO2) and produced carbon dioxide (VCO2) by using an abbreviated Weir's equation [427]:
REE (kcal/day) = (3.941 × VO2 [L/min] + 1.106 × VCO2 [L/min]) × 1,440.

Predictive equations for REE

To obtain the REE predictive equations for this study, previous publications were reviewed. The following criteria were applied in selecting the equations to be included: (i) equations based on age, sex, body weight, and/or height; and (ii) equations developed in adults (subjects aged 18 yrs or more). Exclusion criteria were: (i) equations developed only from older adults; (ii) equations developed only from patients; and (iii) equations developed only from athletic subjects. Based on these criteria, a total of 19 equations were retained (Table 1). Additional details on these equations are given elsewhere [56]. We also used our subjects' measured REE data to develop a new equation, which was then compared to the 19 published equations. For each equation, an estimated REE was calculated and compared with the REE obtained through indirect calorimetry.

Statistical analysis

Statistical analysis was conducted by using SPSS version 23.0 for Windows (SPSS Inc., Chicago, IL, USA). To summarize data on participants' characteristics and variables, descriptive statistics were used and independent samples t-tests were performed for comparing data from men and women. Using a step-wise regression method, we developed a predictive equation for REE based on anthropometry and body composition variables; subsequently, the equation was cross-validated by applying the leave-one-out method. Accuracy of the predictive equations was assessed by determining percent bias, root mean squared prediction error (RMSE), and percentage of accurate predictions, which was defined as the percentage of subjects predicted by each predictive equation within 10% of the measured value. The Bland-Altman method was used to assess agreement between the two methods. In all tests, the alpha value was set at 0.05 for evaluation of statistical significance.

RESULTS

Characteristics of participants

A total of 109 participants (54 men and 55 women) were included in this study; their characteristics are presented in Table 2. The mean age of the participants was 40.3 ± 12.9 yrs, and the mean BMI was 23.5 ± 2.8 kg/m2. In comparison to women, men had significantly lower percentage of body fat (P < 0.001) and significantly lower fat mass (P = 0.047). On the other hand, both the FFM and the muscle mass were significantly higher in men than in women (P < 0.001). Men had significantly higher measured REE than women (P < 0.001), but this difference was not significant after adjusting for body weight (P > 0.05).

Correlation between participants' measured REE and other variables

The correlation between the participants' measured REE and other variables is presented in Table 3. The highest Pearson's correlation value was observed with FFM, which was positively correlated with the measured REE (r = 0.862, P < 0.001). Other positively correlated variables included muscle mass (r = 0.861, P < 0.001), participants' weight (r=0.813, P < 0.001), and participants' height (r=0.766, P < 0.001). On the other hand, the measured REE was negatively associated with the percentage of body fat (r = −0.357, P < 0.001).

Accuracy of the resting energy expenditure predictive equations

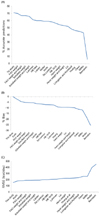
Table 4 presents a summary of the obtained REE data including kcal/day, percentage bias, maximum values found for negative error (underprediction) and positive error (overprediction), RMSE (in kcal/day), the percentage of accurate predictions, the percentage of underpredictions, and the percentage of overpredictions. Fig. 1 shows the percentage of accurate predictions, percentage bias, and RMSE for the participants.
The following predictive equation was developed by using a step-wise regression analysis:
REE (kcal/day)=19.324×FFM+4.588×WT−2.479×AGE (R2 = 0.768),
where REE=resting energy expenditure; FFM=fata-free mass; WT=weight.
Compared to previously published equations, this new equation provided the best predictive accuracy, with a 71% accuracy rate, a bias of 0%, and an RMSE of 155 kcal/day. Among the 19 published equations, the highest rate of accurate predictions was observed with the FAOweight equation for which 70% of the participants had their REE predicted within 10% of the measured value. The FAOweight equation resulted in a bias of −4.4% and an RMSE of 184 kcal/day. The Bernstein equation produced the lowest percentage of accurate predictions (6%), the largest bias (−25.6%), and the largest RMSE (453 kcal/day).
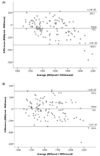
Fig. 2 presents the results of the Bland-Altman test to assess the agreement between predictive equations and indirect calorimetry. In comparison to the newly developed formula, a strong proportional bias was observed in the equation of FAOweight with a tendency for underprediction among the subjects having high REE values.

DISCUSSION

In this study, we assessed the validity of various REE predictive equations in 109 Korean non-obese adults, by comparing the predicted REE with the REE measured by indirect calorimetry. Several equations resulted in a non-significant bias from the measured REE (bias within the range of ± 10%), but further analysis showed a low percentage of accurate predictions in most equations. According to the study results, the FAOweight equation had the best overall performance in predicting REE among the published equations that were evaluated. At the group level, this equation resulted in a bias of −4.4%, which is deemed acceptable. At the individual level, the accuracy rate was 70%, implying that 30% of the subjects could have their REE inaccurately predicted. Though the new equation developed in this study had better performance than that provided by the FAOweight equation, it was observed that as much as 29% of the individual subjects could have had their REE inaccurately predicted. Therefore, whenever possible, measuring the REE by using indirect calorimetry remains the best option for individual subjects.
As expected, and in support of the results in previous studies [2829], the measured REE was higher in men than in women; 1,793 ± 266 kcal/day and 1,368 ± 179 kcal/day, respectively (P < 0.05). This difference can be explained by the observation that men in our study had significantly higher body weight and higher FFM than those in women, two factors that have previously been shown to positively correlate with an individual's REE [330]. In our study, REE had the highest correlations with FFM, muscle mass, and body weight (Pearson's r = 0.862, 0.861, and 0.813, respectively; P < 0.001). These results are in agreement with those in previous reports about different factors affecting an individual's REE [330]; those reports indicating that FFM was the strongest factor affecting an individual's REE. The gender difference in REE was not significant after adjustment for body weight (P > 0.05), and women had significantly higher REE/FFM than that in men (P < 0.001). A study reported by de la Torre et al. [28] also observed that the gender difference in REE disappeared after adjusting for body weight or FFM. In a report by Kim et al. [29], the REE did not differ between genders after adjustment for body weight, although women did have a higher REE/FFM than that in men (P < 0.001).
Our calorimetrically measured REE results are comparable to those in previous studies of Korean adults. In a study conducted by Son et al. [31], the REE was measured in Korean farmers (50 men aged 50.2 ± 8.7 yrs with mean BMI of 25.0 ± 2.9 and 111 women aged 52.3 ± 6.6 yrs with mean BMI of 25.1 ± 2.8), and they reported that REE was 1,703 ± 205 kcal/day in men and 1,343 ± 139 kcal/day in women. Another study by Lee and Kim [32], which involved 28 male police officers aged 23 to 46 yrs (BMI = 24.6 ± 3.0), reported that the REE measured by indirect calorimetry was 1,748.3 ± 205.9 kcal/day. Our results are also comparable to those obtained by Kim et al. [29], in a study that included 35 men aged 33.5 ± 8.8 yrs (BMI = 23.2 ± 2.1) and 36 women aged 33.3 ± 8.5 yrs (BMI = 22.2 ± 3.2). In that study, the measured REE was 1,695.3 ± 118.2 in men and 1,375.3 ± 160.1 in women.
The indirect calorimetry determined REE in our study was lower than that reported for participants from western countries. A study [28] involving healthy Puerto Rican adults (23 men aged 38.2 ± 12.3 yrs and 25 women aged 41.6 ± 10.0 yrs) reported measured REE of 1,865.7 ± 189.3 kcal/day in men and 1,418.7 ± 207.5 kcal/day in women; values that are higher than those in this study. This difference could be explained by the subjects' body weight, which was lower in our participants (71.3 vs. 83.6 kg in men and 56.7 vs. 63.9 kg in women). In fact, the REE has been reported to be positively correlated with an individual's body size [33]. However, contrary to our expectations, and considering that the percent body fat in [28] was higher than that in our subjects (22.2% vs. 18.7% in men, and 31.6% vs. 29.7% in women), the REE adjusted for body weight was higher in our participants than in those in the de la Torre et al. [28] study (25.2 vs. 22.6 kcal/kg/day in men and 24.3 vs 22.5 kcal/kg/day in women). We suggest that this could be related to a difference in the methods used to assess body composition. In our study, the percent body fat was measured by applying the BIA method and using the In-Body (720) body composition analyzer, which has been previously reported to provide high reliability and accuracy [3435]. In the report by de la Torre et al. [28], percent body fat was estimated based on skinfold measurement with a caliper and applying the equations reported by Jackson et al. [3637]. A study by Jackson et al. [38] showed that these equations systematically underestimate the percent body fat in Hispanic men and women.
The accuracy of REE predictive equations was assessed by examining the percent bias, percentage of accurate predictions, and RMSE results. Percent bias has been used in various studies for validation of methods [53940], and bias level indicates an accurate prediction when the predicted value is within 10% of the measured value. However, this indicator has limitations as it does not reflect accuracy in the context of individual participants. Therefore, a predictive equation's validity for individuals can be assessed by calculating the percentage of participants having accurate predictions [5].
The equation newly developed in the present study had the smallest bias (0%), the highest accuracy rate (71%), and the smallest RMSE (155 kcal/day). Among published equations, the highest percentage of accurate predictions was given by the FAOweight equation for which 70% of the participants had their REE accurately predicted. The accuracy rates obtained in these two equations appear acceptable when compared to previous results from a study similar to ours, in which de la Torre et al. [28] validated the predictive equations for REE in healthy Puerto Rican adults. Moreover, de la Torre et al. [28] concluded that the Harris-Benedict and Mifflin-St Jeor equations for the prediction of REE were valid, as they provided accurate prediction percentages of 69% and 60%, respectively.
The FAO equations were published in a 1985 report [24], from a team of FAO/WHO/UNU experts. According to that report, the equations were developed based on Schofield et al. [26], after extending the database to include 11,000 healthy subjects of both sexes and all ages. The data for the basal metabolic rate (BMR) measurements were compiled from previous reports and included data for developed countries and some developing countries. The adult subjects were divided into 3 age ranges (18–30 yrs, 30–60 yrs and 60+ yrs); after which, sex group and age range FAOweight equations were developed.
Previous reports on REE equation validation for Koreans include one study conducted with college students [41] that involved 60 participants (30 men and 30 women) aged 18–25 yrs. The results indicated that all tested equations were inaccurate in predicting REE, with low percentages of accurate predictions. Application of the FAOweight equation to that study group resulted in a bias of −1.9%, and only 55% of participants had their REE accurately predicted. Another study, which involved Korean farmers [31], reported that the Cunningham equation [42], which is based on FFM, was the most accurate in predicting the subjects' REE. This equation had a bias of −0.47% in men and 1.4% in women, and the percentage of accurate predictions was 80% in men and 81% in women. In this sample of Korean farmers, the FAOweight equation also performed well with a bias of −0.59% in men and 0.1% in women and accurate prediction rates of 76% in men and 84% in women.
Ganpule et al. [43] developed predictive equations for basal metabolic rate (BMR) and sleeping metabolic rate (SMR) in adult Japanese (71 men aged 36 ± 16 yrs and 66 women aged 37 ± 16 yrs). As Japanese share similar ethnic characteristics with Koreans, it was thought their results may be applicable to Koreans. In their study, the SMR was measured based on average energy expenditure during 8 h of sleep, then during 3 h of sleep. The best BMR prediction equation accounted for 84% of the variance in BMR with a bias of 7.6%. For the 8 h SMR prediction, the best equation explained 87.6% of the variance and the bias was 6.2%, whereas the 3 h SMR prediction explained 89.1% of the variance with a bias of 5.9%. In all of the equations assessed by Ganpule et al. [43], the percentage of variance explained was higher than that in our results for REE prediction (76.8%), but we observed a smaller bias (1.1%) in our study. In contrast to our study, Ganpule et al. [43] did not compare their results with those from previously published REE predictive equations.
The present study was limited to assessing non-obese Korean adults and, thus, our results may not be generalizable to other categories of the population. REE is affected by factors such as age and body composition [344]. A study conducted by Marra et al. [40] assessed the accuracy of REE predictive equations in obese adolescents and obtained a higher accuracy with equations developed in obese patients and for specific age groups than the accuracy of equations developed for the general population. Therefore, further studies are recommended, especially in other population groups such as older adults, children, and obese people.
In conclusion, the new equation developed in this study had the best accuracy in predicting REE for Korean non-obese adults. Among the previously published equations, the FAOweight equation produced the highest overall accuracy. However, at an individual level, these equations could lead to inaccuracies in a considerable number of subjects.

Figures and Tables

Fig. 1

Percentage of accurate predictions (A), percentage bias (B), and root mean squared prediction error (RMSE) (C) for the study participants obtained from 19 published resting energy expenditure predictive equations and the equation developed in this study.

nrp-12-283-g001
Fig. 2

Bland-Altman plots for the FAOWeight equation (A) and the equation developed in this study (B). REEpred, predicted REE; REEmeas, measured REE.

nrp-12-283-g002
Table 1

Description of assessed equations

nrp-12-283-i001

WT, weight in kg; HTCM, height in cm; HTM, height in meters; FFM, fat-free mass; FM, fat mass; AGE, age in y; SEX (M=1, F=0); REE, resting energy expenditure; FAO, Food and Agriculture Organization; CL, confidence limits; RSD, residual SD.

Table 2

Characteristics of participants

nrp-12-283-i002

1)Mean ± SD

2)Obtained by the independent sample t-test between men and women

3)N (%)

N, Number of subjects; REE, Resting energy expenditure; REE/BW, REE adjusted for body weight; REE/FFM, REE adjusted for fat-free mass.

Table 3

Correlation between the participant's measured REE and other variables (n = 109)

nrp-12-283-i003

REE: Resting energy expenditure

Table 4

Evaluation of resting energy expenditure predictive equations based on bias, root mean squared prediction error, and percentage of accurate predictions

nrp-12-283-i004

REE, Resting energy expenditure; RMSE, Root mean squared prediction error.

1)Mean ± SD

2)Mean percentage error between predicted and measured REE.

3)The largest underprediction observed with this predictive equation as a percentage of the measured REE.

4)The largest overprediction observed with this predictive equation as a percentage of the measured REE.

5)The percentage of subjects predicted by this predictive equation within 10% of the measured REE.

6)The percentage of subjects predicted by this predictive equation < 10% of the measured REE.

7)The percentage of subjects predicted by this predictive equation > 10% of the measured REE.

Notes

This study was supported by the Korean Centers for Disease Control and Prevention (KCDC), under project no. 2014-E35002-00.

CONFLICT OF INTEREST The authors declare no potential conflicts of interest.

References

1. Yatsuya H, Li Y, Hilawe EH, Ota A, Wang C, Chiang C, Zhang Y, Uemura M, Osako A, Ozaki Y, Aoyama A. Global trend in overweight and obesity and its association with cardiovascular disease incidence. Circ J. 2014; 78:2807–2818.
crossref
2. Pérez Rodrigo C. Current mapping of obesity. Nutr Hosp. 2013; 28:Suppl 5. 21–31.
3. Nahikian-Nelms M, Sucher KP, Lacey K, Roth SL. Nutrition Therapy and Pathophysiology. 2nd ed. Belmont (CA): Wadsworth, Cengage Learning;2011. p. 240.
4. Ndahimana D, Kim EK. Measurement methods for physical activity and energy expenditure: a review. Clin Nutr Res. 2017; 6:68–80.
crossref
5. Weijs PJ. Validity of predictive equations for resting energy expenditure in US and Dutch overweight and obese class I and II adults aged 18-65 y. Am J Clin Nutr. 2008; 88:959–970.
crossref
6. Siervo M, Bertoli S, Battezzati A, Wells JC, Lara J, Ferraris C, Tagliabue A. Accuracy of predictive equations for the measurement of resting energy expenditure in older subjects. Clin Nutr. 2014; 33:613–619.
crossref
7. Wouters-Adriaens MP, Westerterp KR. Low resting energy expenditure in Asians can be attributed to body composition. Obesity (Silver Spring). 2008; 16:2212–2216.
crossref
8. Wulan SN, Westerterp KR, Plasqui G. Ethnic differences in body composition and the associated metabolic profile: a comparative study between Asians and Caucasians. Maturitas. 2010; 65:315–319.
crossref
9. Bernstein RS, Thornton JC, Yang MU, Wang J, Redmond AM, Pierson RN Jr, Pi-Sunyer FX, Van Itallie TB. Prediction of the resting metabolic rate in obese patients. Am J Clin Nutr. 1983; 37:595–602.
crossref
10. de Lorenzo A, Tagliabue A, Andreoli A, Testolin G, Comelli M, Deurenberg P. Measured and predicted resting metabolic rate in Italian males and females, aged 18-59 y. Eur J Clin Nutr. 2001; 55:208–214.
crossref
11. Harris JA, Benedict FG. A biometric study of human basal metabolism. Proc Natl Acad Sci U S A. 1918; 4:370–373.
crossref
12. Roza AM, Shizgal HM. The Harris Benedict equation reevaluated: resting energy requirements and the body cell mass. Am J Clin Nutr. 1984; 40:168–182.
crossref
13. Mifflin MD, St Jeor ST, Hill LA, Scott BJ, Daugherty SA, Koh YO. A new predictive equation for resting energy expenditure in healthy individuals. Am J Clin Nutr. 1990; 51:241–247.
crossref
14. Müller MJ, Bosy-Westphal A, Klaus S, Kreymann G, Lührmann PM, Neuhäuser-Berthold M, Noack R, Pirke KM, Platte P, Selberg O, Steiniger J. World Health Organization equations have shortcomings for predicting resting energy expenditure in persons from a modern, affluent population: generation of a new reference standard from a retrospective analysis of a German database of resting energy expenditure. Am J Clin Nutr. 2004; 80:1379–1390.
crossref
15. Owen OE, Kavle E, Owen RS, Polansky M, Caprio S, Mozzoli MA, Kendrick ZV, Bushman MC, Boden G. A reappraisal of caloric requirements in healthy women. Am J Clin Nutr. 1986; 44:1–19.
crossref
16. Owen OE, Holup JL, D'Alessio DA, Craig ES, Polansky M, Smalley KJ, Kavle EC, Bushman MC, Owen LR, Mozzoli MA. A reappraisal of the caloric requirements of men. Am J Clin Nutr. 1987; 46:875–885.
crossref
17. Livingston EH, Kohlstadt I. Simplified resting metabolic rate-predicting formulas for normal-sized and obese individuals. Obes Res. 2005; 13:1255–1262.
crossref
18. Korth O, Bosy-Westphal A, Zschoche P, Glüer CC, Heller M, Müller MJ. Influence of methods used in body composition analysis on the prediction of resting energy expenditure. Eur J Clin Nutr. 2007; 61:582–589.
crossref
19. Huang KC, Kormas N, Steinbeck K, Loughnan G, Caterson ID. Resting metabolic rate in severely obese diabetic and nondiabetic subjects. Obes Res. 2004; 12:840–845.
crossref
20. Lazzer S, Agosti F, Silvestri P, Derumeaux-Burel H, Sartorio A. Prediction of resting energy expenditure in severely obese Italian women. J Endocrinol Invest. 2007; 30:20–27.
crossref
21. Lazzer S, Agosti F, Resnik M, Marazzi N, Mornati D, Sartorio A. Prediction of resting energy expenditure in severely obese Italian males. J Endocrinol Invest. 2007; 30:754–761.
crossref
22. Liu HY, Lu YF, Chen WJ. Predictive equations for basal metabolic rate in Chinese adults: a cross-validation study. J Am Diet Assoc. 1995; 95:1403–1408.
23. Luhrmann PM, Edelmann-Schafer B, Neuhauser-Berthold M. Changes in resting metabolic rate in an elderly German population: cross-sectional and longitudinal data. J Nutr Health Aging. 2010; 14:232–236.
crossref
24. Food and Agriculture Organization of the United Nations. World Health Organization. United Nations University. Energy and Protein Requirements: Report of a Joint FAO/WHO/UNU Expert Consultation. Geneva: World Health Organization;1985.
25. Henry CJ. Basal metabolic rate studies in humans: measurement and development of new equations. Public Health Nutr. 2005; 8:1133–1152.
crossref
26. Schofield WN. Predicting basal metabolic rate, new standards and review of previous work. Hum Nutr Clin Nutr. 1985; 39:Suppl 1. 5–41.
27. Weir JB. New methods for calculating metabolic rate with special reference to protein metabolism. J Physiol. 1949; 109:1–9.
crossref
28. de la Torre CL, Ramírez-Marrero FA, Martínez LR, Nevárez C. Predicting resting energy expenditure in healthy Puerto Rican adults. J Am Diet Assoc. 2010; 110:1523–1526.
crossref
29. Kim EK, Kim JH, Kim MH, Ndahimana D, Yean SE, Yoon JS, Kim JH, Park J, Ishikawa-Takata K. Validation of dietary reference intake equations for estimating energy requirements in Korean adults by using the doubly labeled water method. Nutr Res Pract. 2017; 11:300–306.
crossref
30. Rolfes SR, Pinna K, Whitney EN. Understanding Normal and Clinical Nutrition. 9th ed. Belmont (CA): Wadsworth, Cengage Learning;2012. p. 246–247.
31. Son HR, Yeon SE, Choi JS, Kim EK. The measurements of the resting metabolic rate (RMR) and the accuracy of RMR predictive equations for Korean farmers. Korean J Community Nutr. 2014; 19:568–580.
crossref
32. Lee SH, Kim EK. Accuracy of predictive equations for resting metabolic rates and daily energy expenditures of police officials doing shift work by type of work. Clin Nutr Res. 2012; 1:66–77.
crossref
33. Westerterp KR. Control of energy expenditure in humans. Eur J Clin Nutr. 2017; 71:340–344.
crossref
34. Ling CH, de Craen AJ, Slagboom PE, Gunn DA, Stokkel MP, Westendorp RG, Maier AB. Accuracy of direct segmental multifrequency bioimpedance analysis in the assessment of total body and segmental body composition in middle-aged adult population. Clin Nutr. 2011; 30:610–615.
crossref
35. Gibson AL, Holmes JC, Desautels RL, Edmonds LB, Nuudi L. Ability of new octapolar bioimpedance spectroscopy analyzers to predict 4-component-model percentage body fat in Hispanic, black, and white adults. Am J Clin Nutr. 2008; 87:332–338.
crossref
36. Jackson AS, Pollock ML. Generalized equations for predicting body density of men. Br J Nutr. 1978; 40:497–504.
crossref
37. Jackson AS, Pollock ML, Ward A. Generalized equations for predicting body density of women. Med Sci Sports Exerc. 1980; 12:175–182.
crossref
38. Jackson AS, Ellis KJ, McFarlin BK, Sailors MH, Bray MS. Cross-validation of generalised body composition equations with diverse young men and women: the Training Intervention and Genetics of Exercise Response (TIGER) Study. Br J Nutr. 2009; 101:871–878.
crossref
39. Hofsteenge GH, Chinapaw MJ, Weijs PJ. Fat-free mass prediction equations for bioelectric impedance analysis compared to dual energy X-ray absorptiometry in obese adolescents: a validation study. BMC Pediatr. 2015; 15:158.
crossref
40. Marra M, Montagnese C, Sammarco R, Amato V, Della Valle E, Franzese A, Contaldo F, Pasanisi F. Accuracy of predictive equations for estimating resting energy expenditure in obese adolescents. J Pediatr. 2015; 166:1390–1396.e1.
crossref
41. Lee GH, Kim MH, Kim EK. Accuracy of predictive equations for resting metabolic rate in Korean college students. Korean J Community Nutr. 2009; 14:462–473.
42. Cunningham JJ. A reanalysis of the factors influencing basal metabolic rate in normal adults. Am J Clin Nutr. 1980; 33(11):2372–2374.
crossref
43. Ganpule AA, Tanaka S, Ishikawa-Takata K, Tabata I. Interindividual variability in sleeping metabolic rate in Japanese subjects. Eur J Clin Nutr. 2007; 61:1256–1261.
crossref
44. Frisard MI, Broussard A, Davies SS, Roberts LJ 2nd, Rood J, de Jonge L, Fang X, Jazwinski SM, Deutsch WA, Ravussin E. Aging, resting metabolic rate, and oxidative damage: results from the Louisiana Healthy Aging Study. J Gerontol A Biol Sci Med Sci. 2007; 62:752–759.
crossref
TOOLS
ORCID iDs

Didace Ndahimana
https://orcid.org/0000-0001-7070-3973

Yeon-Jung Choi
https://orcid.org/0000-0001-9590-6697

Jung-Hye Park
https://orcid.org/0000-0002-9755-6050

Mun-Jeong Ju
https://orcid.org/0000-0002-5093-4667

Eun-Kyung Kim
https://orcid.org/0000-0003-1292-7586

Similar articles