Abstract
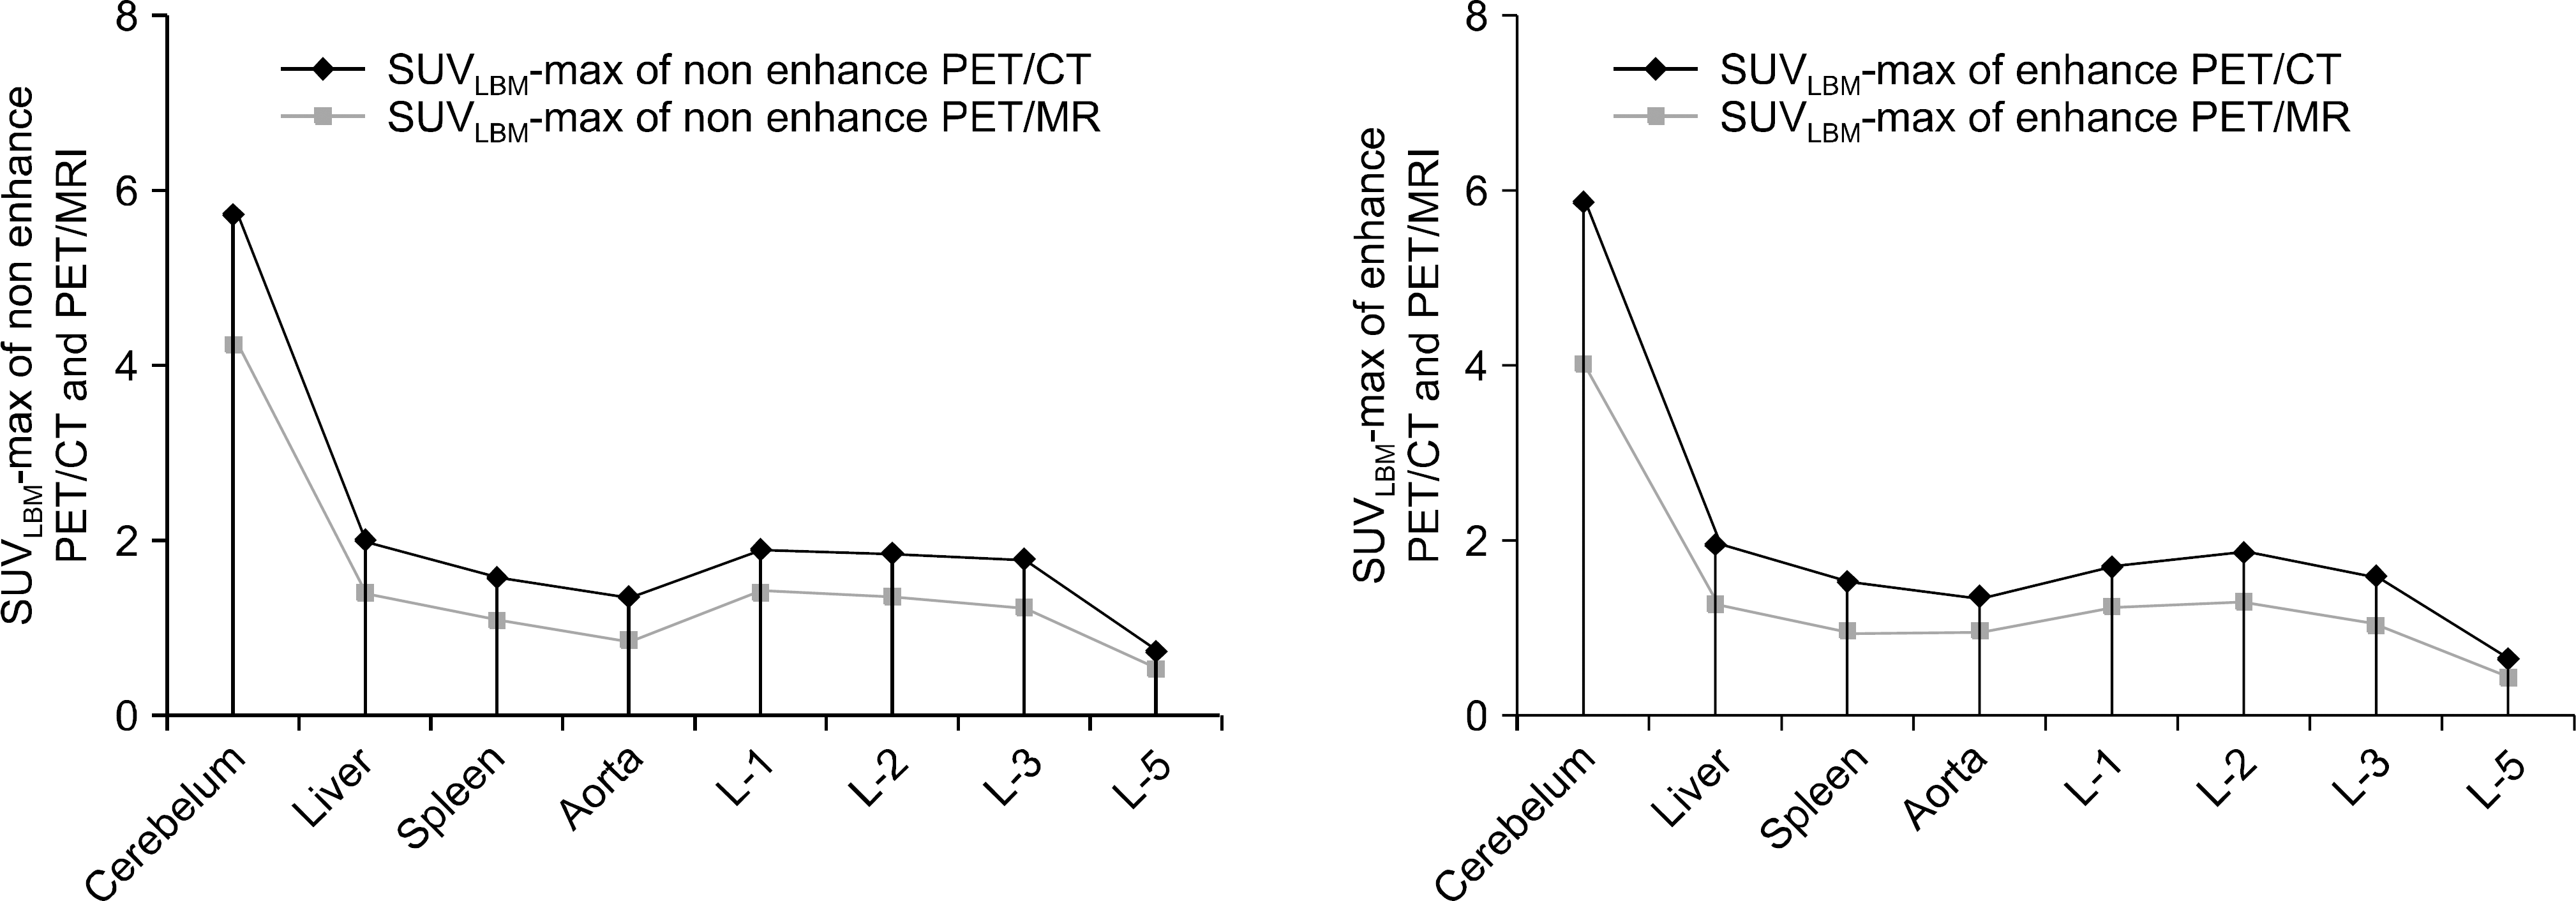
The purpose of this research is to compare and analyze SUVLBM-maximum of normal regions using VOI (the volume of interest) in order to enhance the diagnostic level in whole body images of PET/CT and PET/MRI for 26 health check-up participants. In particular, we try to set up SUVLBM-maximum data that can be used in synchronous evaluation for PET/CT and PET/MRI without contrast media. The evaluation of SUVLBM-maximum for normal regions of whole body PET/CT and whole body PET/MRI shows that the image of PET/MRI differs very significantly from the reference image of PET/CT (p<0.0001). However, they exhibit high correlations in view of statistics (R>0.8). From this research, we suggest that the decision in the evaluation of SUVLBM-maximum for PET/MRI should be made with the reduction of about 26.3%, while one should decide with the reduction of about 29.3% when the contrast media is used. It is helpful to interpret all image of PET/CT and PET/MRI using SUVLBM-maximum for convenience and efficiency.
References
1. Antoch G, Bockisch A. Combined PET/MRI: a new dimension inwhole-body oncology imaging? Eur J Nucl Med Mol Imaging. 36:113–120. 2009.
2. Antoch G, Vogt FM, Freudenberg LS, et al. Whole-body dual-modality PET/CT and whole-body MRI for tumor staging in oncology. JAMA. 290:3199–3206. 2003.

3. Beer AJ, Eiber M, Souvatzoglou M, Schwaiger M, Krause BJ. Radionuclide and hybrid imaging of recurrent prostate cancer. Lancet Oncology. 12:181–191. 2011.

4. Kinahan PE, Hasegawa BH, Beyer T. X-ray-based attenuation correction for positron emission tomography/computed tomography scanners. Semin Nucl Med. 33:166–179. 2003.

5. Zaidi H. Is MRI-guided attenuation correction a viable option for dual modality PET/MRI imaging? Radiology. 244:639–642. 2007.
6. Martinez-Möller A, Souvatzoglou M, Delso G, et al. Tissue classification as a potential approach for attenuation correction in whole-body PET/MRI: evaluation with PET/CT data. J Nucl Med. 50:520–526. 2009.

7. Zincirkeser S, Sahin E, Halac M, Sager S. Standardized uptake values of normal organs on 18F-Fluorodeoxyglucose positron emission tomography and computed tomography imaging. J Int Med Res. 35:231–236. 2007.

8. Boellaard R. Standards for PET image acquisition and quantitative data analysis. J Nucl Med. 50:11–20. 2009.

9. Hong SL. A study for distortion of standardized uptake value according to the does and lesion size using 18F-FDG PET/CT. Graduates school Korea Univ, Seoul, Korea (. 2012.
10. Menda Y, Bushnell DL, Madsen MT, McLaughlin K, Kahn D, Kernstine KH. Evaluation of various corrections to the standardized uptake value for diagnosis of pulmonary malignancy. Nucl Med Common. 22:1077–1081. 2001.

11. Zasadny KR, Wahl RL. Standardized uptake values of normal tissues at PET with2-[fluorine-18]-fluoro-2-deoxy-D-glucose: variations with body weight and a method for correction. Radiology. 189:847–850. 1993.
12. Wahl RL, Jacene H, Kasamon Y, Lodge MA. From RECIST to PERCIST: Evolving Considerations for PET response criteria in solid tumors. J Nucl Med 50 Suppl. 1:122S–150S. 2009.

13. Matthias E, Axel MM, Michael S, et al. Value of a dixon-based MRI/PET attenuation correction sequence for the localization and evaluation of PET-positive lesions. Eur J Nucl Med Mol Imaging. 38:1691–1701. 2011.
14. Katrine Å: PET/CT: nuclear medicine imaging in the future. Radiation Protection Dosimetry. 139:8–11. 2010.
15. Hofmann M, Steinke F, Scheel V, et al. MRI-based attenuation correction for PET/MRI: a novel approach combining pattern recognition and atlas registration. J Nucl Med. 49:1875–1883. 2008.

16. Schulz V, Torres-Espallardo I, Renisch S, et al. Automatic, three-segment, MRI-based attenuation correction for whole-body PET/MRI data. Eur J Nucl Med Mol Imaging. 38:138–152. 2011.
17. Boellaard R, O'Doherty MJ, Weber WA, et al. FDG PET and PET/CT: EANM procedure guidelines for tumour PET imaging: version 1.0. Eur J Nucl Med Mol Imaging. 37:181–200. 2010.
18. Lauenstein TC, Semelka RC. Emerging techniques: whole body screening and staging with MRI. J Magn Reson Imaging. 24:489–498. 2006.
19. Castelijns JA, van den Brekel MWM. Imaging of lymphadenopathy in the neck. Eur Radiology. 12:727–738. 2002.

20. Kim WP. Statistical analysis lecture fundamentals. Statistics & Society. 90:97–289. 2007.
Fig. 1.
(a∼c) SUVs measurements confirm anatomical location in the PET/CT coronal, sagittal, and transverse images, (d∼f) SUVs measurements confirm anatomical location in the PET/MRI coronal, sagittal, and transverse images.

Fig. 2.
According to non-contrast media or contrast media used, SUVLBM-maximum normal volumes corresponding.

Table 1.
Comparison of PET/CT SUVLBM-maximum and PET/MRI SUVLBM-maximum.
Table 2.
Comparison of PET/CT SUVLBM-maximum and PET/MRI SUVLBM-maximum using a contrast media.
Table 3.
According to non-contrast media or contrast media used, SUVLBM-maximum normal volumes corresponding of PET/CT and PET/MRI.


 PDF
PDF ePub
ePub Citation
 Print
Print


 XML Download