

 PDF
PDF ePub
ePub Citation
 Print
Print


INTRODUCTION
SUBJECTS AND METHODS
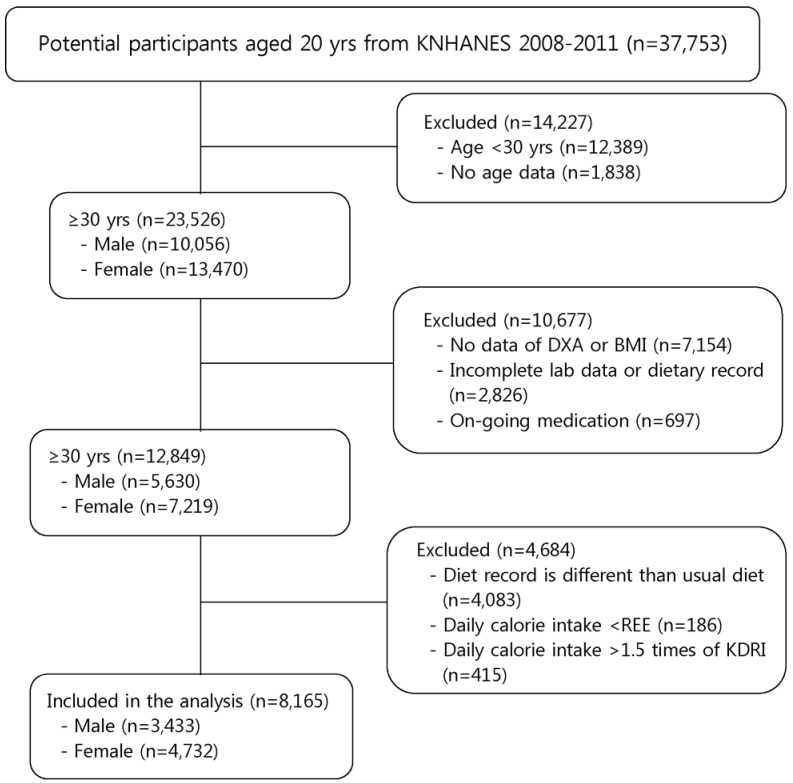
Study subjects
Assessment of anthropometric measurement and lean body mass
Calculation of sarcopenia index (SI)
Assessment of dietary intake
Measurement of biochemical indicators and assessment of other covariates
Statistical analysis
RESULTS
Anthropometric and biochemical characteristics of the study subjects
Table 1
Anthropometric and biochemical characteristics related to energy metabolism of the study subjects by quartile of the sarcopenia index (SI)
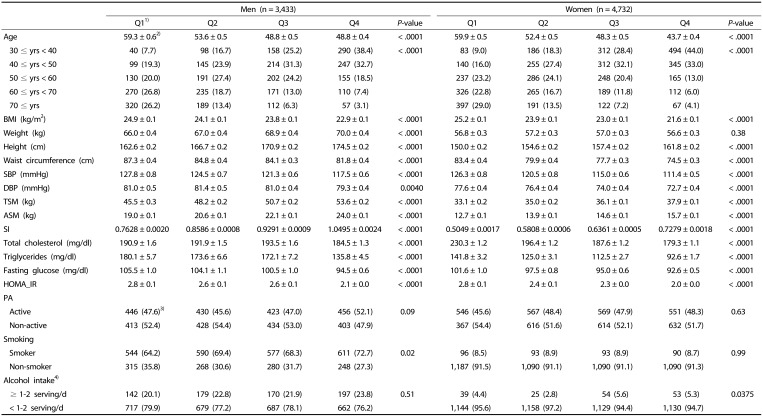
BMI, body mass index; SBP, systolic blood pressure; DBP, diastolic blood pressure; TSM, total skeletal muscle mass; ASM, appendicular skeletal muscle mass; SI, sarcopenia index; HOMA_IR, homeostatic model assessment-insulin resistance; PA, physical activity; Smoking, smoking status.
1)For men the first quartile (Q1): SI < 0.82, Q2: 0.82 ≤ SI < 0.89, Q3: 0.89 ≤ SI < 0.97, and Q4: 0.97 ≤ SI. For women, Q1: SI < 0.55, Q2: 0.55 ≤ SI < 0.61, Q3: 0.61 ≤ SI < 0.67, and Q4: 0.67 ≤ SI.
2)Mean ± SE.
3)n (%)
4)A serving size of alcohol intake: one cup (50cc) of soju or one glass of beer (200cc), “≥ 1–2 serving/d” corresponds to ≥ 2 servings/d for men and ≥ 1.5 servings/d for women, “< 1–2 servings/d” corresponds to < 2 servings/d for men and < 1.5 servings/d for women. The p values are from ANOVA for continuous variables and χ2 test for categorical variables assessing the difference between the groups.
![]()
Status of nutrient intake by quartile of sarcopenia index
Table 2
Status of energy intake by quartile of the sarcopenia index (SI)
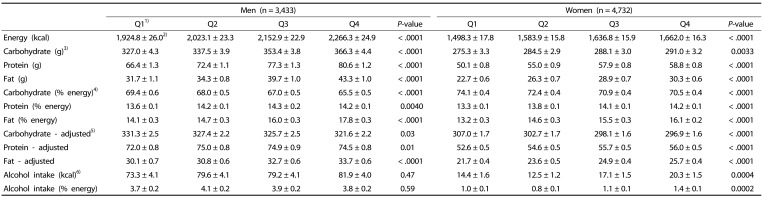
1)For men the first quartile (Q1): SI < 0.82, Q2: 0.82 ≤ SI < 0.89, Q3: 0.89 ≤ SI < 0.97, and Q4: 0.97 ≤ SI. For women, Q1: SI < 0.55, Q2: 0.55 ≤ SI < 0.61, Q3: 0.61 ≤ SI < 0.67, and Q4: 0.67 ≤ SI.
2)Mean ± SE.
3)Absolute amount of intake without adjustment.
4)Percent intake from total energy intake.
5)Energy-adjusted intake calculated by residual adjustment method; coefficient amount for carbohydrate: 313.5 g for men and 282.6 g for women, for fat: 32.9 g for men and 23.3 g for women, for protein: 72.3 g for men and 53.6 g for women.
6)Caloric intake from alcohol was calculated as follows: servings/d × 64 kcal/serving.
![]()
Estimation of change in total energy and carbohydrate intake after adjustment of covariates
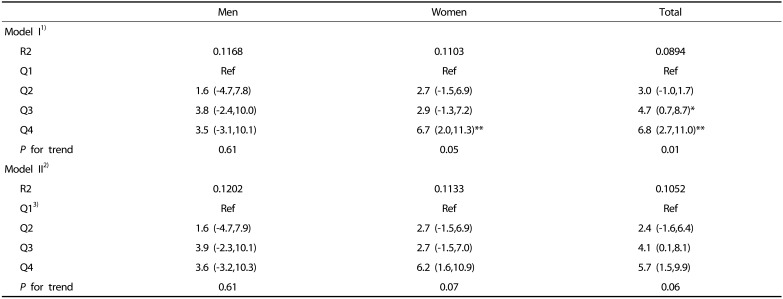
Table 3
Estimated change in total energy intake according to quartile of the sarcopenia index (SI)
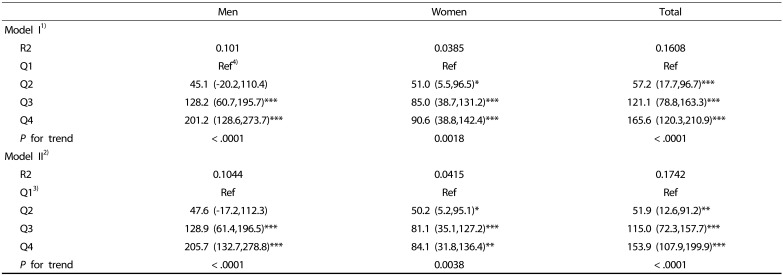
Beta coefficient with 95% confidence interval is shown.
1)Model I: adjusted for age, body weight and energy from alcohol intake.
2)Model II: model I + physical activity + levels of total cholesterol and fasting glucose + smoking status.
3)For men the first quartile (Q1): SI < 0.82, Q2: 0.82 ≤ SI < 0.89, Q3: 0.89 ≤ SI < 0.97, and Q4: 0.97 ≤ SI. For women, Q1: SI < 0.55, Q2: 0.55 ≤ SI < 0.61, Q3: 0.61 ≤ SI < 0.67, and Q4: 0.67 ≤ SI.
4)Beta coefficient in linear trend analysis with energy intake and SI: for men 112.3 kcal/ SI (0.1 m2), for women 43.9 kcal/ SI (0.1 m2).
*P < 0.05, ** P < 0.01, *** P < 0.001 compared to reference group of sarcopenia index (Q1) within same sex or total subjects.
![]()
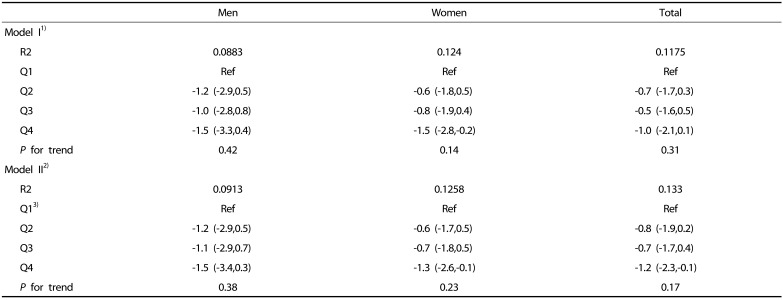
Table 4
Estimated change in carbohydrate intake according to quartile of the sarcopenia index (SI)
Beta coefficient with 95% confidence interval is shown.
1)Model I: adjusted for age, body weight and energy from alcohol intake.
2)Model II: model I + physical activity + the level of total cholesterol and fasting glucose + smoking status.
3)For men the first quartile (Q1): SI < 0.82, Q2: 0.82 ≤ SI < 0.89, Q3: 0.89 ≤ SI < 0.97, and Q4: 0.97 ≤ SI. For women, Q1: SI < 0.55, Q2: 0.55 ≤ SI < 0.61, Q3: 0.61 ≤ SI < 0.67, and Q4: 0.67 ≤ SI.
*P < 0.05, ** P < 0.01 compared to reference group of sarcopenia index (Q1) within same sex or total subjects.
![]()
Table 5
Estimated change in fat intake according to quartile of the sarcopenia index (SI)
Beta coefficient with 95% confidence interval is shown.
1)Model I: adjusted for age, body weight and energy from alcohol intake.
2)Model II: model I + physical activity + the level of total cholesterol and fasting glucose + smoking status.
3)For men the first quartile (Q1): SI < 0.82, Q2: 0.82 ≤ SI < 0.89, Q3: 0.89 ≤ SI < 0.97, and Q4: 0.97 ≤ SI. For women, Q1: SI < 0.55, Q2: 0.55 ≤ SI < 0.61, Q3: 0.61 ≤ SI < 0.67, and Q4: 0.67 ≤ SI.
![]()
Table 6
Estimated change in protein intake according to quartile of the sarcopenia index (SI)
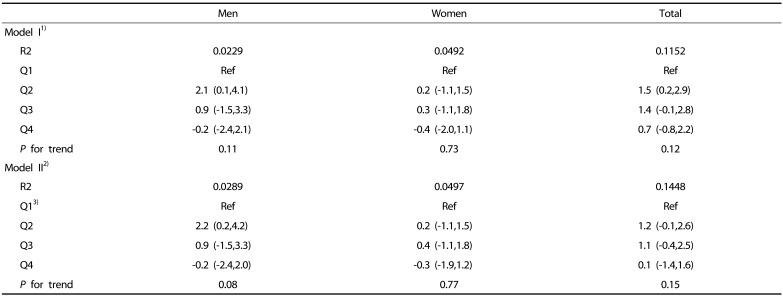
Beta coefficient with 95% confidence interval is shown.
1)Model I: adjusted for age, body weight and energy from alcohol intake.
2)Model II: model I + physical activity + the level of total cholesterol and fasting glucose + smoking status.
3)For men the first quartile (Q1): SI < 0.82, Q2: 0.82 ≤ SI < 0.89, Q3: 0.89 ≤ SI < 0.97, and Q4: 0.97 ≤ SI. For women, Q1: SI < 0.55, Q2: 0.55 ≤ SI < 0.61, Q3: 0.61 ≤ SI < 0.67, and Q4: 0.67 ≤ SI.
![]()
Relative risk of low skeletal muscle mass according to energy intake
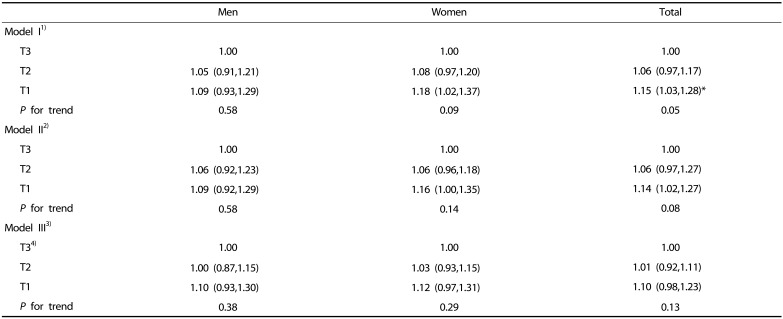
Table 7
Adjusted ORs with 95% CIs of low skeletal muscle mass by tertile of total energy intake
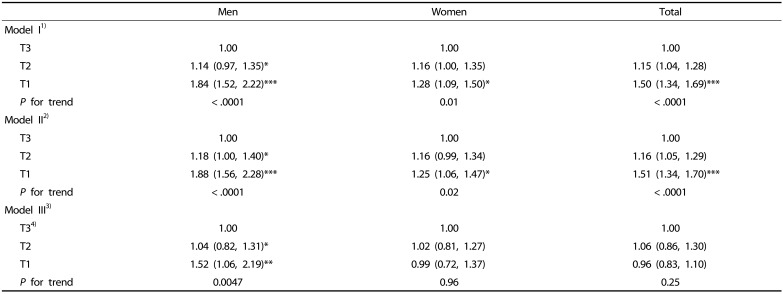
Odds ratio (OR) with 95% confidence interval is shown.
1)Model I: adjusted for age, body weight, and energy from alcohol intake.
2)Model II: model I + physical activity + levels of total cholesterol and fasting glucose + smoking status.
3)Model III: model II + age × total energy intake.
4)Total energy intakes were categorized into tertile scale; for men, first tertile (T1): total energy intake < 1,753.5 kcal, second tertile (T2): 1,753.5 kcal ≤ total energy intake < 2,278.9 kcal, third tertile (T3): 2,278.9 kcal ≤ total energy intake, for women, T1: total energy intake < 1,350.0 kcal, T2: 1,350.0 kcal ≤ total energy intake < 1,768.4 kcal, T3: 1,768.4 kcal ≤ total energy intake.
*P < 0.05, ** P < 0.01, *** P < 0.001 compared to reference group of total energy intake (T3) within same sex or total subjects.
![]()
Table 8
Adjusted ORs with 95% CIs of low skeletal muscle mass by tertile of carbohydrate intake
Odds ratio (OR) with 95% confidence interval is shown.
1)Model I: adjusted for age, body weight and energy from alcohol intake.
2)Model II: model I + physical activity + levels of total cholesterol and fasting glucose + smoking status.
3)Model III: model II + age × total energy intake.
4)Energy adjusted total carbohydrate intake was categorized into tertile scale; for men, first tertile (T1): carbohydrate intake < 313.0 g, second tertile (T2): 313.0 g ≤ carbohydrate intake < 359.3 g, third tertile (T3): 359.3 g ≤ carbohydrate intake, for women, T1: carbohydrate intake < 288.2 g, T2: 288.2 g ≤ carbohydrate intake < 327.1, T3: 327.1 g ≤ carbohydrate intake.
*P < 0.05 compared to reference group of carbohydrate intake (T3) within same sex or total subjects.
![]()
 XML Download