Abstract
Objective
To investigate the 5-year relative survival rates in gynecological cancers diagnosed and treated in Turkey by year 2009 and to compare the results with developed countries.
Methods
Data of patients diagnosed for ovarian, corpus uteri or cervix uteri cancer at year 2009 are collected from 9 national cancer registry centers. Date of deaths are retracted from governmental Identity Information Sharing System (KPS). In order to calculate relative survival rates, national general population mortality tables are obtained from Turkish Statistical Institute (TurkStat). Hakulinen method is used for computing curves by R program. Data for European, Asian and some developed countries were obtained from official web pages.
Results
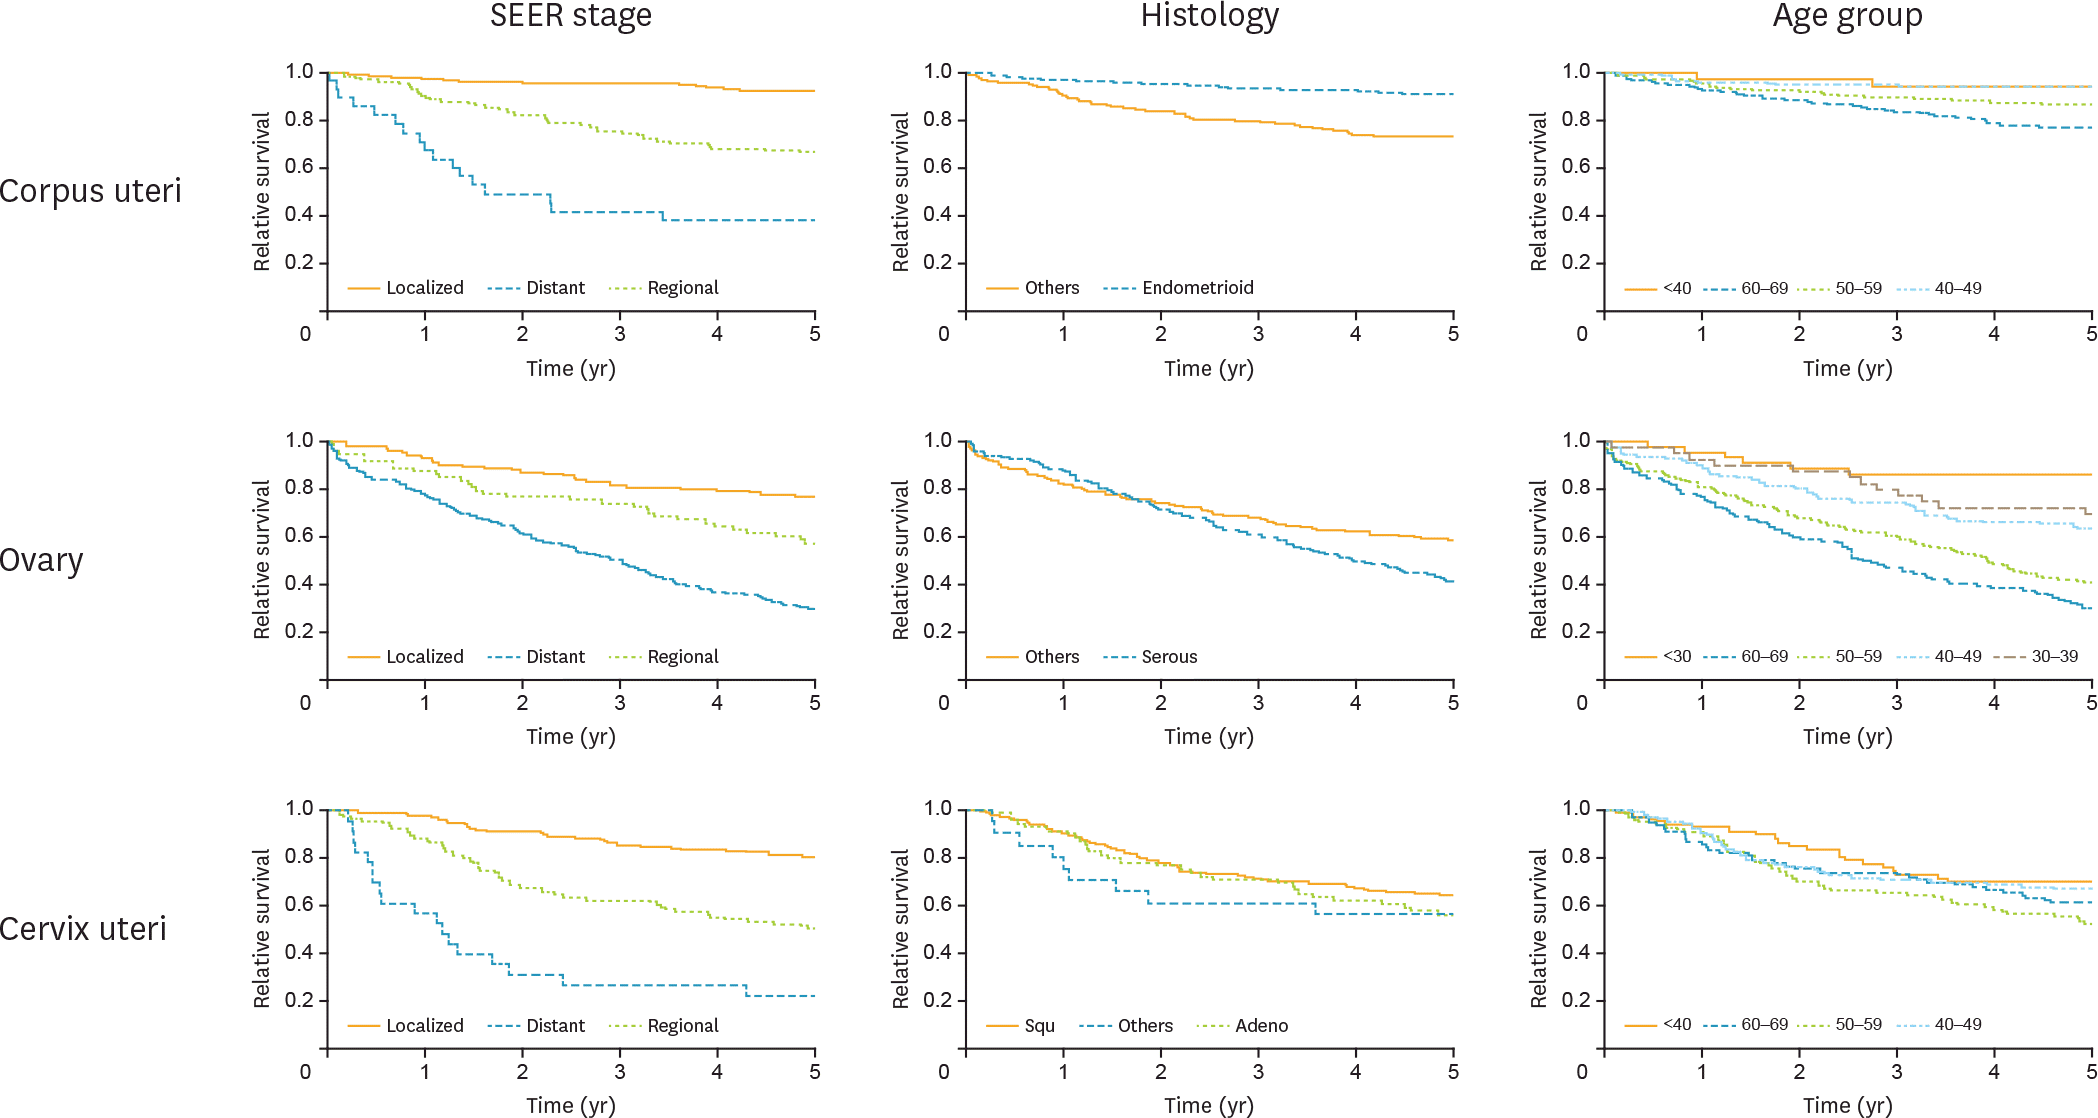
A total of 1,553 patients are evaluated. Among these, 713 (45.9%) are corpus uteri cancers, while remaining 489 (31.5%) are ovarian and 351 (22.6%) are cervix uteri. Five-year overall relative survival rates are 85%, 50%, and 62% for corpus uteri, ovarian, and cervix uteri, respectively. These figures are between 73%–87% for corpus uteri, 31%–62% for ovarian and 61%–80% for cervix uteri in developed countries. Stage is the most important factor for survival in all cancers. Five-year relative survival rates in corpus uteri cancers are 92%, 66%, and 38% for localized, regional, and distant metastatic disease, respectively. These figures are 77%, 57%, and 29% for ovarian; 80%, 50%, and 22% for cervix uteri.
References
1. Ferlay J, Soerjomataram I, Ervik M, Dikshit R, Eser S, Mathers C, et al. GLOBOCAN 2012: estimated cancer incidence, mortality and prevalence worldwide in 2012 v1.0 (IARC CancerBase No. 11) [Internet]. Lyon: International Agency for Research on Cancer;2013. [cited 2017 Apr 10]. Available from:. http://globocan.iarc.fr/Pages/fact_sheets_population.aspx.
2. Stewart SL, Lakhani N, Brown PM, Larkin OA, Moore AR, Hayes NS. Gynecologic cancer prevention and control in the National Comprehensive Cancer Control Program: progress, current activities, and future directions. J Womens Health (Larchmt). 2013; 22:651–7.

3. Akdag R, Tosun N, Cinal A. Türkiye'de özellikli planlama gerektiren sağ lık hizmetleri 2011–2023 [Internet]. Ankara: Sağ lık BakanlığıTedavi Hizmetleri Genel Müdürlüğü;2011. [cited 2017 Apr 10]. Available from:. http://planlamadb.saglik.gov.tr/Eklenti/3167,turkiyede-ozellikli-planlama-gerektiren-saglik-hizmetleri-2011-2023pdf.pdf.
4. Parkin DM, Hakulinen T. Analysis of survival. In: Jensen OM, Parkin DM, MacLennan R, Muir CS, Skeet RG, editors. Cancer registration: principles and methods. Lyon: International Agency for Research on Cancer;1991. p. 159–76.
5. Pohar M, Stare J. Relative survival analysis in R. Comput Methods Programs Biomed. 2006; 81:272–8.

6. American Cancer Society. Cancer facts & figures 2017 [Internet]. Atlanta, GA: American Cancer Society;2017. [cited 2017 Apr 10]. Available from:. https://www.cancer.org/content/dam/cancer-org/research/cancer-facts-and-statistics/annual-cancer-facts-and-figures/2017/cancer-facts-and-figures-2017.pdf.
7. Sant M, Chirlaque Lopez MD, Agresti R, Sánchez Pérez MJ, Holleczek B, Bielska-Lasota M, et al. Survival of women with cancers of breast and genital organs in Europe 1999–2007: results of the EUROCARE-5 study. Eur J Cancer. 2015; 51:2191–205.
8. Eurocare 5 survival analysis 2000–2007 [Internet]. Roma: Istituto Superiore di Sanità;2014. [update 2014 Mar 5; cited 2017 Apr 10]. Available from:. https://w3.iss.it/site/EU5Results/forms/SA0007.aspx.
9. Chen T, Jansen L, Gondos A, Ressing M, Holleczek B, Katalinic A, et al. Survival of endometrial cancer patients in Germany in the early 21st century: a period analysis by age, histology, and stage. BMC Cancer. 2012; 12:128.

10. Chen T, Jansen L, Gondos A, Emrich K, Holleczek B, Luttmann S, et al. Survival of cervical cancer patients in Germany in the early 21st century: a period analysis by age, histology, and stage. Acta Oncol. 2012; 51:915–21.

11. Cancer Australia. Online statistics and published in 2016 [Internet]. Surry Hills: Cancer Australia;2017. [cited 2017 Apr 10]. Available from:. https://canceraustralia.gov.au.
12. Canadian Cancer Society. Canadian cancer statistics 2016 special topic: HPV associated cancers [Internet]. Toronto: Canadian Cancer Society;2016. [cited 2017 Apr 10]. Available from:. http://www.cancer.ca/en/?region=on.
13. Jung KW, Won YJ, Kong HJ, Oh CM, Cho H, Lee DH, et al. Cancer statistics in Korea: incidence, mortality, survival, and prevalence in 2012. Cancer Res Treat. 2015; 47:127–41.

14. Li Y, Yu L, Na J, Li S, Liu L, Mu H, et al. Survival of cancer patients in Northeast China: analysis of sampled cancers from population-based cancer registries. Cancer Res Treat. Forthcoming. 2017.

15. Gong W, Luo S, Hu R, Wang H, Pan J, Fei F, et al. Analysis of survival rate of breast, cervical, and ovarian cancer patients during 2005–2010 in Zhejiang province, China. Zhonghua Yu Fang Yi Xue Za Zhi. 2014; 48:366–9.
16. Foundation for Promotion of Cancer Research (JP). Cancer statistics in Japan ‘15 [Internet]. Tokyo: Center for Cancer Control and Information Services;2016. [cited 2017 Apr 11]. Available from:. http://ganjoho.jp/en/professional/statistics/brochure/2015_en.html.
17. Sankaranarayanan R, Ferlay J. Global burden of gynaecological cancer. In: Ayhan A, Reed N, Gultekin M, Dursun P, editors. Textbook of gynaecological oncology. Ankara: Güneş Publishing;2016. p. 62.
18. Berek JS, Hacker NF. Berek & Hacker's gynecologic oncology. 6th ed.Philadelphia, PA: Wolters Kluwer;2015.
19. Cancer Research UK. Cancer statistics for the UK [Internet]. London: Cancer Research UK;2017. Mar; [cited 2017 Apr 11]. Available from:. http://www.cancerresearchuk.org/health-professional/cancer-statistics.
20. Trétarre B, Molinié F, Woronoff AS, Bossard N, Bessaoud F, Marrer E, et al. Ovarian cancer in France: trends in incidence, mortality and survival, 1980–2012. Gynecol Oncol. 2015; 139:324–9.

21. Türkiye Halk Sağ lığıKurumu, Kanser Daire Baş kanlığı. 2014 YılıTürkiye kanser ıstatistikleri [Internet]. Ankara: Türkiye Halk Sağ lığıKurumu;2016. [cited 2017 Apr 11]. Available from:. http://kanser.gov.tr/daire-faaliyetleri/kanser-istatistikleri/2106-2014-yılı-türkiye-kanser-istatistikleri.html.
Table 1.
Clinico-pathological characteristics and relative survival
Table 2.
Relative survival regression models
Table 3.
Five-year relative survival rates (%) per country (year of diagnosis)


 PDF
PDF Citation
 Print
Print


 XML Download