

 PDF
PDF Citation
 Print
Print


INTRODUCTION
Endometrial cancer (EC) is a common malignancy in women worldwide. EC is heterogeneous in histological type, and the main types contained endometrioid endometrial adenocarcinoma (EEA) and serous endometrial adenocarcinoma (SEA). Although most women diagnosed at early stage have a favorable prognosis, those with advanced stage or exhibiting high-risk histopathology have short survival time [1]. Therefore, it is urgent to characterize the genetic and epigenetic factors systematically for the purpose of identifying the potential biomarkers for early detection of EC and further aiding to understand the pathogenesis of EC.
As a major event of epigenetic modifications in the genome, DNA methylation plays a crucial role in the early formation and process of diseases, especially for cancers [2]. During the early phase of cancer, the hypermethylation of promotor or/and CpG island (CGI) of tumor suppressor genes (TSGs) results in the transcriptional silencing, and the hypomethylation of repeat-rich regions of genome could lead to the genomic instability [34]. These observations indicate that DNA methylation could potentially be candidate biomarkers for cancers [5]. During the past decades, a series of altered methylation genes were evaluated for the potential diagnosis of EC, such as BHLHE22/CDO1/CELF4, SHP1, TMEFF2 [678].
Weighted gene co-expression network analysis (WGCNA) is a tool to construct scaled-free networks through combining a hierarchical clustering and topological overlap dissimilarity [910]. Recently, the use of WGCNA is extended to CpG sites co-methylation network analysis. For example, in co-methylation modules, Busch et al. [11] obtained genes-enriched in inflammatory pathways related to chronic obstructive pulmonary disease (COPD) which may be more reliable as COPD biomarkers. Thus, WGCNA could help to prioritize the potential candidates.
The regulatory roles of DNA methylation on gene expression are also extensively investigated. In EC, paired box 2 (PAX2) was up-regulated in EC with promoter hypermethylation, which could increase the ability of cell viability and invasion [12]. However, the DNA methylation alteration and associated aberrant gene expression has not been elucidated systematically in EC. The Cancer Genome Atlas (TCGA) database provides multi-omic data of EC and other cancer types. For studies investigating genome-wide DNA methylome maps of EC, the researchers validated the cancer-associated DNA methylation signatures in TCGA with large samples as a test set [1314]. Here, aiming to provide a systematic insight to DNA methylation profiling of EC and the DNA methylation changes associated with gene expression in EC, we performed integrated analysis of DNA methylation and mRNA expression data of EC from TCGA, and constructed weighted CpG site co-methylation network (WCCN) for EC.
MATERIALS AND METHODS
1. TCGA DNA methylation and gene expression data
The level 3 DNA methylation array data, mRNA expression data and corresponding clinical information of EC were downloaded from TCGA firehose browse (http://firebrowse.org/). Briefly, DNA methylation array data from tumor tissues of 431 EC patients together with mRNA expression data of 370 EC patients were downloaded. In addition, DNA methylation array data from 46 adjacent tumor tissues and mRNA expression data from 11 adjacent tumor tissues were also downloaded, respectively. The clinical information such as age, grade, and stage, were also obtained. The platforms for methylation array data and mRNA expression were Illumina Infinium HumanMethylation450 BeadChip and IlluminaGA_RNASeqV2.1.0.0 (Illumina, Inc., San Diego, CA, USA), respectively.
2. Identification of differentially methylated CpG sites (DMCs) and differentially methylated regions (DMRs)
DMCs and DMRs were determined through City of Hope CpG Island Analysis Pipeline (COHCAP) package in R (R Foundation, Vienna, Austria) [15]. To investigate the distribution of CpG sites especially DMCs across whole genome, we conducted Manhattan plot by qqman package in R [16]. To explore the methylation profile between primary solid tumor tissues (tumor group) and adjacent tissues (normal group), hierarchical clustering analysis was performed in R.
3. Identification of differentially expressed genes (DEGs)
DEGs between 370 primary solid tumors (tumor group) and 11 adjacent tissues (normal group) of EC patients were identified through DESeq2 package of R [17]. The significant threshold of DEGs was set as |log2(fold change)|>2 and false discovery rate (FDR)<0.0001.
4. Construction of WCCN
Illumina 450K methylation array data of 477 tissue of ECs (431 case and 46 normal included) were used as input to the WGCNA package of R language [9] to construct WCCN. We selected top 5% most variable CpG sites after filtering CpG sites that were undetectable in 80% of samples, which finally corresponded to 19,786 sites. The soft threshold value was set as 10. The correlation between eigenvectors of modules and the tumor-normal status was calculated, and those with |coefficient value|>0.2 and p-value<0.05 were kept as significant ones. The CpG sites mostly correlated with their module eigenvectors were selected as hubs. The obtained network was visualized using Cytoscape 3.1.0 (Cytoscape Consortium, San Diego, CA, USA) [18]. The modules detected in the WCCN usually have different biology functions, and can be determined whether they related to some traits or not. In addition, hubs in modules could be selected as potential driver genes for further study.
5. Integrated analysis of DNA methylation and gene expression
To further understand the potential relationship between DNA methylation and mRNA expression, we integrated the CGI-DMRs and corresponding DEGs. We calculated the correlation between DMCs and DEGs, and further selected those with |coefficient of correlation|>0.2 and p-value<0.05 as significant ones. The visualization of the potential regulation of CpG sites to genes was constructed in Cytoscape 3.1.0. Fisher's exact test was carried out to investigate whether DMCs were enriched in tumor-normal status associated modules in R language. p-values of Fisher's exact test<0.05 were regarded as significant enrichments.
6. Functional annotations
In order to explore the biological function of DMCs and CpG sites in different modules of the co-methylation network, we used the Genomic Regions Enrichment of Annotations Tool (GREAT; http://bejerano.stanford.edu/great/public/html/) for enrichment analysis of Gene Ontology (GO) [19]. Additionally, to uncover the signaling pathway of selected CpG sites, Kyoto Encyclopedia of Genes and Genomes (KEGG) pathway enrichment was conducted through the online software GeneCodis3 (http://genecodis.cnb.csic.es/analysis) [20].
7. Genomic feature enrichment analysis
To identify the genomic features of DMCs and CpG sites in different modules, we performed enrichment analysis of genomic features including CGI contexts and gene contexts according to the Illumina 450K array annotation table. The former includes CGI, shore (2 kb flanking the islands), shelf (2 kb flanking the shores), and the latter includes TSS200, TSS1500, 5'UTR, 3'UTR, 1stExon, and gene body. The significant threshold of p-value of Fisher's exact test was set as <0.01.
RESULTS
1. DMCs and DMRs between tumor and normal groups in EC
To explore the DNA methylation profile of EC, we identify the DMCs and DMRs via COHCAP. In the light of Manhattan plot of CpG sites (Fig. 1A), 268,664 CpG sites along with CpG sites of FDR<0.05 between tumor and normal groups were distributed in all chromosomes, and the most significantly methylated CpG site was located in chromosome 19. Furthermore, to gain more sensitive DMCs, we tried the threshold of DMCs as followings: beta value<0.3 or >0.7, delta-beta value>0.2, and FDR<0.05. A total of 1,135 DMCs were obtained, including 729 hypermethylated sites and 406 hypomethylated sites. Likewise, the top 10 DMCs were cg17754510, cg24452128, cg24258712, cg23161999, cg03714619, cg16765600, cg19763461, cg06204711, cg24843380, cg24504927. Interestingly, all of the top 10 DMCs were hypermethylated except for cg24258712 and cg16765600. We then performed a hierarchical clustering analysis based on the top 200 DMCs. It clearly showed that the DNA methylation patterns could clearly distinct the normal and tumor group. Furthermore, the samples in tumor group could be further divided into 4 clusters, while the 4 clusters were not so profoundly correlated with histological types, stage, and grade of EC (Fig. 1B).
Fig. 1
DNA methylation profile of EC. (A) Manhattan plot of CpG sites in 450K array. Dots above the purple line presented CpG sites with FDR<0.05. (B) Heatmap of top 200 DMCs (by FDR rank) base on the unsupervised hierarchical clustering analysis. (C) Visualization of KEGG pathway of DMCs.
DMCs, differentially methylated CpG sites; EC, endometrial cancer; FDR, false discovery rate; KEGG, Kyoto Encyclopedia of Genes and Genomes.
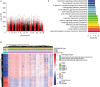
By performing genome feature enrichment analysis, it showed that DMCs were significantly enriched in CGI and shores on the basis of island contexts. Meanwhile, DMCs were significantly enriched in TSS200, TSS1500, 3'UTR, 5'UTR. GO enrichment analysis revealed that DMCs significantly enriched in regulation of transcription, DNA-dependent (FDR=5.906889E-32), DNA binding (FDR=1.09E-58), and nucleus (FDR=5.23E-12), in biological process, molecular function, and cellular component, respectively. Moreover, KEGG pathway enrichment analysis revealed that DMCs significantly enriched in neuroactive ligand-receptor interaction (FDR=9.00E-05), focal adhesion (FDR=1.01E-04), and endocytosis (FDR=1.20E-04) (Fig. 1C).
When inferring DMRs based on the methylation level of CGI, the threshold of DMRs was set the same as DMCs besides an additional criteria of requiring the number of CpG sites in each region >2. It led to a total of 56 DMRs, containing 49 hypermethylated regions and 7 hypomethylated regions. It was consistent with the results from DMCs analysis that the tumor group had a relative hypermethylation profile. As CpG sites were clustered together in DMRs, it may provide more robust results than single DMCs. Moreover, the most significant DMRs (contained of 10 methylated DMCs, FDR=2.26E-13) was also located in chromosome 19, and was mapped to ZNF154.
2. Correlation of DNA methylation and gene expression
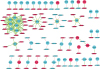
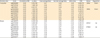
We explored the potential regulatory roles of DNA methylation on gene expression. Firstly, 1,488 genes were identified as DEGs between tumor and normal groups, consisting of 826 up-regulated genes and 662 down-regulated genes. Meanwhile, 521 genes were identified as differentially methylated genes (DMGs) on the basis of the annotation table of 450K array data. Furthermore, 73 genes of 521 DMGs were DEGs, including 27 up-regulated gens and 43 down-regulated genes. In addition, we overlapped DMRs with DEGs based on the official 450K array annotation table. Totally, 13 DEGs with DMRs were obtained (Table 1) including 9 protocadherins (PCDHs), DPP6, TCTEX1D1, TNXB, and ZNF154. Among them, 12 genes were hypermethylated and down-regulated while one gene was hypomethylated and up-regulated. We further performed a correlation analysis of DMCs and DEGs, and obtained 148 significantly correlated pairs of DEGs and DMCs. We used these pairs to construct a DNA methylation regulated network which composed of 138 nodes, including 60 hypermethylated DMCs, 29 hypomethylated DMCs, 9 up-regulated DEGs, and 40 down-regulated DEGs (Fig. 2). This network also contained 28 positive and 120 negative correlation pairs, which showed that DNA methylation was usually negatively correlated with corresponding gene expression. Interestingly, genes with the biggest degrees (degree>4) were all DMRs-associated DEGs.
Table 1
DEGs on the level of CGIs

Fig. 2
Correlation between DMCs and DEGs. Circles and rectangles represented DEGs and DMCs, respectively. Red colors mean up-regulated or hypermethylated, and turquoise means down-regulated or hypomethylated. Green lines represented the negative correlation, while pink lines represented positive correlation. Circles with orange margins were differentially methylated DEGs on the level of CGIs.
CGIs, CpG islands; DEGs, differentially expressed genes; DMCs, differentially methylated CpG sites.
3. Construction of WCCN
WCCN was employed to investigate co-methylation modules and hubs associated with tumor-normal status in EC. Totally, 8 modules were identified, 6 of which were correlated with tumor-normal status (|coefficient of correlation|>0.2; p-value<0.05).
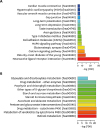
KEGG pathway enrichment analysis was performed to explore the function of each of the 6 modules. It revealed that corresponding genes from the turquoise module of CpG sites were significantly enriched in neuroactive ligand-receptor interaction (FDR=2.19E-23), maturity onset diabetes of the young (FDR=7.29E-09), and calcium signaling pathway (FDR=9.82E-08) (Fig. 3A). We noted that the most significant KEGG pathway enrichment was also neuroactive ligand-receptor interaction (FDR=9.00E-05), which was the same of the result of the KEGG pathway enrichment analysis of DMCs. Whereas retinol metabolism (FDR=2.27E-10), metabolism of xenobiotics by cytochrome P450 (FDR=2.27E-10), and drug metabolism — cytochrome P450 (FDR=2.27E-10) was the most significantly enriched pathways for genes from the brown module (Fig. 3B). Genes associated with the rest modules enriched in no significant pathway.
Fig. 3
The character of turquoise and brown modules. (A, B) Visualization of KEGG pathway of DMCs from turquoise and brown modules. CpG sites were visualized as the thresholds of topological overlap>0.06 and 0.1, respectively.
DMCs, differentially methylated CpG sites; KEGG, Kyoto Encyclopedia of Genes and Genomes.
We further characterized the genomic feature of turquoise and brown modules. It suggested that CpG sites in the turquoise module were significantly enriched in CGI, shelf and shore; gene body, 1stExon, 3'UTR, TSS200, 5'UTR, and TSS1500. While CpG sites from the brown module were enriched in CGI with no gene context enrichments.
An unsupervised hierarchical clustering analysis based on the CpG sites of the turquoise module demonstrated that most of the normal samples clustered together (Supplementary Fig. 1). Meanwhile, SEA samples tended to be clustered together, and were clustered together with the normal group in relative hypomethylation levels. In addition, we identified CpG sites showing the highest correlations with eigenvectors as hubs with |coefficient of correlation|≥0.88 and p-value<0.05 (Supplementary Figs. 2 and 3). Finally, we identified 9 hubs in each of the modules (Table 2).
Table 2
Details of hubs in turquoise and brown modules
4. Integrated analysis of DNA methylation and gene expression via co-methylation modules
We observed that 112 DMCs were overlapped with the turquoise module which constituted 1,910 CpG sites. By associating these 112 DMCs to their closest genes based on the office Illumina 450K array annotation table, 66 genes were obtained. Interestingly, 77% of previously determined DEGs with DMRs, including DPP6, PCDHGA12, PCDHGB3, PCDHGA11, PCDHGA9, PCDHGA7, PCDHGA6, PCDHGA5, PCDHGA3, and PCDHGA2 were among the 66 genes. Meanwhile, 25 CpG sites from 92 DMCs-DEGs correlated pairs were observed to be among the 112 DMCs. Among them, CLIP, CNRIP1, DPP6, LOC134466, PCDHGA11, PCDHGA12, PCDHGA2, PCDHGA3, PCDHGA5, PCDHGA6, PCDHGB3, ZNF454 were obtained. We performed similar analysis on the brown module but only one DMC was observed and no DEGs.
We further explored hubs from these 2 modules. Firstly, we noted that 2 hubs in the turquoise module mapped to GNAL that was significantly down-regulated in tumor group. Likewise, 2 DEGs including NHSL1, ST6GALNAC1 were the hubs in the brown module. Although based on the threshold of beta value>0.7 or beta value<0.3, none of hubs were DMCs, they were still to be differentially methylated with the threshold of FDR<0.05 and abs (delta-beta)>0.2 (Table 2). Taken together, hubs may alter the expression of some genes directly or co-methylate with some DMCs.
DISCUSSION
In this study, we characterized the aberrant DNA methylation and gene expression of EC. Firstly, 1,135 DMCs, 10 DMRs, and 1,488 DEGs were obtained. Then, we got certain genes (such as PCDHs [PCDHGA2, PCDHGA3, PCDHGA5, PCDHGA6, PCDHGA11, PCDHGA12, PCDHGB3], ZNF154, TNXB, DPP6, TCTEX1D1) that could be regulated by aberrant DNA methylation via combination analysis of 13 DEGs with DMRs and 148 DMCs-DEGs correlated pairs. Furthermore, we obtained 8 co-methylation modules, and we obtained some DEGs (such as PCDHs [PCDHGA11, PCDHGA12, PCDHGA5, PCDHGA6, PCDHGB3] and DDP6) through integrated analysis of CpG sites in 2 vital co-methylation modules, DEGs with DMRs, and DMCs-DEGs pairs.
According to the DNA methylation profile, the tumor group tended to be hypermethylated compared with the normal group, which supported the view that most of CGIs were unmethylated in normal tissues [21]. This global hypermethylated status of tumor may cause the altered expression of specific genes, especially the down-regulation of TSGs. Meanwhile, previous study suggested that hypomethylated CpG sites could occur at repetitive regions of the genome [22]. In our study, quite a few hypomethylated DMCs were detected in ECs, which might result in genomic instability.
The molecular alterations of EC were correlated with various histological types. For instance, endometrioid endometrial cancer (EEC) and serous carcinoma (SC) own different profiles of gene expression and DNA methylation [23]. According to the unsupervised hierarchical clustering analysis of top 200 DMCs, the tumor group was not only distinct from the normal group, but also showed more heterogeneous hypermethylation status. The 4 clusters in tumor group were not so profoundly correlated with histological types, stage and grade of EC. However, the heatmap of CpG sites in the turquoise module showed that the SEA and EEA samples tend to be clustered into 2 clusters, which confirmed the molecular difference between SEA and EEA, and SEA type was more aggressive than EEA type. Therefore, the methylation profile of CpG sites in turquoise and brown modules may distinguish various types of ECs. It suggested that while we focus on the characterization of cancer patients, in addition to DMCs, CpG sites from WGCNA modules might be taken into consideration.
PCDHs including PCDH-α, PCDH-β, and PCDH-γ clusters, were the largest subgroup within the cadherin superfamily. The PCDHs we identified were composed of 6 PCDH-α genes and 1 PCDH-β gene that tandemly connected in chromosome 5. PCDHs were usually silenced via altered epigenetic modification, and acted as TSGs in various cancer types, such as breast cancer and esophageal squamous-cell carcinoma [2425]. In our study, quite a few PCDHs genes were hypermethylated in the level of CGIs and significantly down-regulated, with mRNA expression level inversely correlated their corresponding DMCs. Interestingly, CGIs-based DMRs of those PCDHs were in gene body regions instead of promoter regions (i.e., the common regulatory pattern of epigenetic modification). Hence, the mechanism of expression silencing of PCDHs by DNA hypermethylation might be further elucidated.
Aberrant DNA methylation and mRNA expression of PCDHGA12 in acute myeloid leukemia (AML) has been demonstrated [26], and acted as a potential DNA methylation biomarker in B lymphoblastic leukemia [27]. It suggested that promoter hypermethylation and down-regulation of PCDHGA11 was associated with adhesion of glial cells to adjacent cells in astrocytoma, facilitating invasive growth of tumor cells [28]. In Wilms' tumor, hypermethylation of PCDHs including PCDHGA3 and PCDHGA6 led to gene silencing, and β-catenin protein was elevated, promoting the activity of β-catenin/T-cell factor (TCF) reporter activity and Wnt signaling pathway [29]. Above all, based on previous studies of PCDHs in other cancer types which most involved in neural and hematology oncology, we inferred that the altered expression of PCDHs could affect the connections among cells, and hence induce the tumorigenesis and tumor progression. Here, the long-range epigenetic silencing (LRES) of PCDHs was first reported in ECs.
The deregulation of extracellular matrix (ECM) protein plays a crucial role in tumor cells invasion and metastasis in EC [30]. The product of TNXB belongs to tenascin family of ECM glycoproteins, which regulates interactions between cells and the ECM, reducing adhesive effects. In our study, TNXB was significantly down-regulated in EC, and its associated DMCs were detected in turquoise module of WCCN. Interestingly, TNXB was hypomethylated at CGIs level, and the expression level was positively correlated with DNA methylation status located in this gene, which was inconsistent with the conventional DNA methylation regulatory mechanism. The mechanism of epigenetic potential effects on TNXB may need to be further studied.
Previous study showed that pathways, such as cell adhesion molecules (CAMs), focal adhesion, and ECM-receptor interaction were involved in EC and many other cancers [31]. Our results also demonstrated that TNXB mapped in pathways of focal adhesion, ECM-receptor interaction and calcium signaling pathway, which DEGs in EC were significantly enriched in. Furthermore, it has been demonstrated that silencing of TNX genes promoted malignant transformation in mice [32]. In addition, TNX genes also could be considered as candidate genes for the distinction between tumor and normal groups in lung adenocarcinoma [33]. Here, aberrant TNXB DNA methylation was first reported in EC.
As a member of the peptidase S9B family of serine proteases, DPP6 encodes a single-pass type II membrane protein which could interact with voltage-gated potassium channels specifically. In this paper, DPP6 (chr7:153584419-154264025) was significantly hypermethylated with CGI (chr7:153583317-153585666) in promoter, and down-regulated in mRNA expression level. DPP6 was also significantly methylated at promoters in AML [36]. In particular, DPP6 involved in EC was first reported.
ZNF154, as a member of zinc finger Kruppel family of transcriptional regulators, regulates cell growth and differentiation. The hypermethylated status of ZNF154 was detected in EC and other 14 solid epithelial tumor types, and could be considered as a possible pan-cancer marker [3435]. Accordingly, in this paper, ZNF154 was also found to be hypermethylated (in gene body region) in EC. Importantly, we still found that its expression was negatively correlated with corresponding DNA methylation status, which may partly be explained the association between ZNF154 hypermethylation and tumor procession.
In this study, we elucidated the character of DNA methylation profile in EC, and identify novel genes potentially regulated by altered DNA methylation in EC with a systematical view, such as ZNF154, PCDHs, TNXB, and DPP6. Specifically, LRES and the novel signatures composed of PCDHs, TNXB, and DPP6 potentially regulated by epigenetic modification were firstly reported in EC. It may contribute to the prognosis and targeted therapy of EC. There were drawbacks in our study. On one hand, the lack of replicated cohorts made it difficult to validate whether the signatures inferred here were generalized enough. On the other hand, both the molecular and cellular mechanism of the signatures need to be further studied. All these aforementioned limitations call for further investigation.
 XML Download