This article has been
cited by other articles in ScienceCentral.
INTRODUCTION
That measurements of the head, stature, weight and other somatic characteristics of the Korean adult differ in some measure from adults of other races has been recognized by even superfacial observes. The rate of development of the head, features, stature, weight and certain other characteristics have been investigated at certain ages but no attempt has apparently been made to investigate them through the whole period of growth. To fill in this defect in our anthroplogical data the writer has investigated both the somatic characteristics and rate of development of Koreans by certain criteria which have already been applied to other races. He wishes to make a first report on this extended study.
For cooperation in making this study possible I wish to acknowledge my indebtedness to the principal and staffs of the following institutions: Severance Union Medical College and Nurses training school, the Methodist Seminary for men and women, Chosen Christain College (men), Ewha College (women), and four middle schools, namely, Paichai, Kyungsin (boys), and Paiwha, Ewha (girls), two boys common-schools Kongok and Hyupsin, two girls common-schools Paiwha and Ewha, as well as the Kingdergartens at Ewha, Paiwha, Chungang, Kyungsung, Choyang and three Christain Child Welfare Stations at Namdaimoon, Taiwha, and Tongdaimoon in the city of Seoul (Keijo). I also am very grateful Dr. Prof. Ueda for suggestions offered during the preparation of the graphs and tables.
DATA AND METHODS
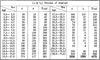
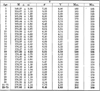
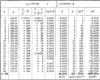
The number of individuals examined from infancy, to college adults was found to be 2320 males and 1855 females the distribution being shown in
Table I. In such anthropometric investigation of racial characteristics, age, presence or absence of disease and seasonal variations in rate of growth are all important factors to consider. In the grouping of individuals according to age Martin's 'Lebensjahr' was used as a guide. At certain ages numbers are too few to give satisfactory results. Especially between the ages of 1 to 5 and over 20 however the numbers seem ample. The details of the use of the formula n ± ½ are shown in
Table I.
All measurements were made in the spring. The method of measuring the Length, Breadth, Height of the head and Stature and Weight of the body is that universlly accepted method described by Martin viz.
1. The maximum length of the head (Martin’s Längenmaβe No. 1) is measured from the most prominent point of the glabella to the most prominent occipital point. (Opisthrocranion) (Martin’s Tasterzirkel)
2. The maximum breadth of the head (Martin’s Breitenmaβe No. 3) is measured from the highest bilateral temporal point. (Martin’s Tasterzirkel)
3. The maximum height of the head (Martin’s Höhenmaβe No. 15) is measured from the vertex to the highest point of the tragus of the ear. (Stangenzirkel mit Ohrhöhennadel)
4. The stature (standing height) is measured vertically from the sole to the vertex when the individual is standing.
5. The weight in Kilograms represents the weight without clothing.
The instruments: For the measurements of the head two kinds of sliding compass were used, one for the length and breadth of the head and the other for the height of the head. These two kinds of compass are slightly modified from Martin’s spreading caliper as shown in the following
figures. Also I used Martin’s steel graduated rod for measuring the body height except that tape was some time used for measuring the body height of infants. The Dial type of weighting scales was used for measurements of the body weight but some times the balance type was used for measuring the body weight of infants.
The methods of calculation: The frequency of distribution of each index were tabulated and for each character the mean values (M), standard deviation (σ), coefficients of variations (v) and their probable errors were calculated for each year of age, also the general developmental rate was represented by the author’s formula. Finally these measurements of the head and the indices obtained were compared with the stature and weight of the same individuals.
HEAD MEASUREMENTS
I. HEAD LENGTH
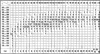
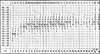
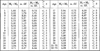
1. Frequency of distribution of the head length:
The frequency of distribution of head length in 2320 Korean males and 1855 females aged 1 to 75 years and the maximum and minimum head length is shown in
Table No. II and
III. Under the age of 5 and over the age of 23 the apparent fluctuation is due to the small number of individuals. The middle values of the distribution of the groups seems to gradually rise according to the increase in age whether we consider males or females. The average difference between maximum and minimum is 20 to 40 mm. in males and 10 to 30 mm. in females. Generally speaking the difference between maximum and minimum at any age is about 20 mm. in either male or female. Details are shown in
Table II and
III.
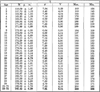
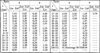
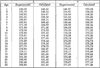
2. Mean values of the head length:
In
Table IV [(1),
(2)] is shown the mean values of the head length at different ages. The mean values of the head length show a gradual rise from 150.09±1.47 (at one year) to 182.42±0.39 after 23 years and the growth ratio of each year interval averages about 1.08% in males. The standard deviation of the head length is from 4.79 to 8.94 and the coefficient of variation is from 2.66 to 5.29.
Figure I clearly indicates the head length at the various ages from 1 year old up to 75 years old. In general the development of the head length follows a curve. Thus from 1 to 6 years old the average variation is more rapid 2.22% per year, and in the 7 to 13 years period is slightly less than 0.36% per year. From 14 to 20 years there is development averaging 0.74% per year representing a slight increase. After this the size of the head become practically fixed in males 182.42±0.39 (M), 7.07 (σ), 3.84 (v), Max. 200.00 and Min. 166.00
The mean values of the head length in 1855 females measured according to their ages is shown in
Table IV [(1),
(2)]. The mean values of the head length show a gradual rise from 148.27±2.03 (at one year) to 177.83±0.58 after 23 years and the growth during each year interval averages about 1.27%. The standard deviation of the length of the head various from 2.12 to 7.72 and the coefficient of variation from 1.35 to 4.96. The development of the head length from year to year (as shown in
figure II.) follows a definite curve in the female as in the male. Thus between 1 to 5 years growth is rapid averaging 2.72% per year, between 6 to 12 years it averages only 0.46% per year and between 13 to 18 years the average is again slightly increased at 0.66% per year. From the 18th year the size of the head becomes practically fixed at 177.83+0.58 (M), and 6.45 (σ), 3.63 (v), Max. 203.00 and Min. 160.00 in the female.
3. Comparison of males with females as regards length of the head:
The details are shown in
Table V. Up to 12 years there is no marked difference between male and female but after that a marked difference appears because after this age the male rapidly develops while the female shows no such acceleration. This is well shown in Graph III. The male is in fact always larger than the female at eachage and the final difference after full growth amounts to 6.56 (m-dif.). Under 6 years the rate of development is slightly greater in the female averaging 2.72% per year as compared with 2.22% per year in the male but the absolute measurements shows that the female is always smaller than the male. Therefore the development of the head length in the female progresses rapidly and finishes earlier than in the male. Namely the female head length has reached the adult average at 18 years while the male continues to grow up to 20 years
[Fig. III].
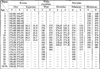
4. Rate and types of development of the head length.
A. Rate of development of the head length:
From
Table VI. and
Figure IV. we can as certain the absolute and relative increase in head length during each year and also the mean values. The maximum head length for males is fixed at 182.42 at 20 years and for the females is 177.83 at about 18 years. The rate of development of the head length averages 1.08% per year in the male between 1 and 20 years and 1.27% per year in the female between 1 and 18 years. But as the age rises the rate of increase of the head length gradually diminishes. Therefore the maximum rate of increase always occurs in male and female infants and the minimum rate always occurs just before the male or female head reaches adult demensions. Neither male nor female shows any evidence of growth after 20 years (the rate is -0.19% in male, 0.04% in the female).
B. The curve of rate of development of the head length:
Indicates that there are three period with different rates before the adult size is reached. In males the first period is up to 7 years during which time the average rate is 2.22% per year, from 7 to 13 years inclusive the average is 0.36% per year, and from 14 to 20 years the average is 0.74% per year. In females from 1 to 5 years the average is 2.72% per year, from 6 to 12 years the average is 0.46% per year, and in the third period from 13 to 18 years the average is 0.66% per year. The development of the head length in male and female thus runs almost parallel. The actual increase per year is almost the same but the development of the female progresses more rapidly and is completed earlier. In both male and female the first period is one of rapid growth, growth in the middle period is quite slow and the last period rather more rapid. In the male the first period extends up to the end of the 7th year but only to the end of the 6th year in the female. In the male the second period is from 7 to 13 years and from 6 to 12 years in the female. The third period in the male extends from 14 to 20 and in the female is from 13 to 18 years.
From our knowledge of functional biology, we would expect a smooth curve to represent the growth of the head length through the whole duration of body growth. Many investigators have tried to reduce to a formula this hypothetical curve of growth and apply it to different organisms. There is for instance T. B. Robertson’s ‘ Master reaction ’, and the formula of W. Ostwald, and S. Brody, Sachs, Driesch, Donaldson, Quetelet, Davenport, A. P. Anderson, and Vierordt. I also tried to base such a formula upon the principle of the ‘ Action of the monomolecularautocatalysis ’ and co-relate it with previously announced formula. My formula in its latest form is little different from the formula given by S. Brody. The method of the calculation and some other details was shown in
Table VII,
VIII,
IX and
Figure V,
VI.
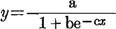
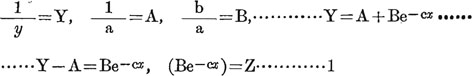
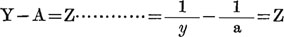
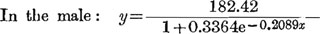
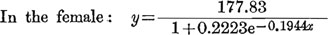
My empirical formula is:
Reciprocal equation of the above formula:
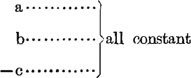
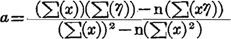
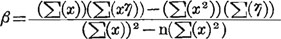
The data of the constants a, b -c, and methods of their calculations are as follows:
The method of the calculation of α, and β, based upon the method of “LEAST SQUARE”.
The results of the -c, b, in the empirical formula of male:
The results of tbe -c, b, in the empirical formula of female:
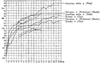
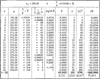
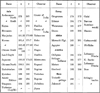
5. Comparison with other races:
Review of reports from the literature about the head length of adults show that measurements of the head length during the period of development are decidedly rare. We have so far only reports on the European and the American white. Generally speaking the Korean head length is less than that of the races about which we have information. Comparing the adult Korean with other Asiatic races we find his head measurements about the same as the central Asiatic races and the southern Chinese, less than the south Asiatic races and the Japanese and the North Chinese. The European head and especially the head of the north Europeans is almost the same as the Korean but smaller than the central and south European. Comparing with American races Koreans are a little smaller than the south American and much smaller than the American white. On the races of Africa and Osea there are Korean head length always smaller than that races both Africa and Osea. Details shown in
Table X,
XI, and
Figure VII.
Literature cited will be listed in the last report of the series.
Figures and Tables
Fig. I
Graph of Head Length Variation with Age in Males.
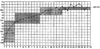
Fig. II
Graph of Head Length Variation with Age in Females.
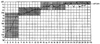
Fig. III
Graph showing influence of Sex on Head Length according to Age.
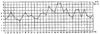
Fig. IV
Graph showing Differences of Developmental rate of the Head Length in Male and Female.
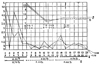
Fig. V
Graph showing Values of (Z) almost a rectilinear figure.
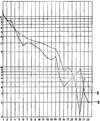
Fig. VI
Graph showing of differences of Mean Values both Experimental and Calculated in ♂ and ♀.
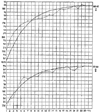
Fig. VII
Graph showing the Developmental rate of the Head Length Compared with other Races both Male and Female.
[Fig]
Figure showing of two kinds of Sliding compass
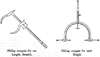
Table I
Age and sex-distribution of individuals.
|
(n ± ½) Number of observed |
|
Age∖Sex |
♂ |
♀ |
Total |
Age∖Sex |
♂ |
♀ |
Total |
|
0.5-1.5 |
29 |
13 |
42 |
17.5-18.5 |
166 |
107 |
273 |
|
1.5-2.5 |
24 |
23 |
47 |
18.5-19.5 |
120 |
67 |
187 |
|
2.5-3.5 |
16 |
10 |
26 |
19.5-20.5 |
101 |
37 |
138 |
|
3.5-4.5 |
20 |
15 |
35 |
20.5-21.5 |
74 |
42 |
116 |
|
4.5-5.5 |
26 |
17 |
43 |
21.5-22.5 |
76 |
35 |
111 |
|
5.5-6.5 |
64 |
36 |
100 |
22.5-23.5 |
57 |
23 |
80 |
|
6.5-7.5 |
67 |
66 |
133 |
23.5-24.5 |
39 |
11 |
50 |
|
7.5-8.5 |
59 |
109 |
168 |
24.5-25.5 |
26 |
8 |
34 |
|
8.5-9.5 |
68 |
100 |
168 |
25.5-26.5 |
27 |
6 |
33 |
|
9.5-10.5 |
79 |
126 |
205 |
26.5-27.5 |
25 |
9 |
34 |
|
10.5-11.5 |
99 |
124 |
223 |
27.5-28.5 |
13 |
11 |
24 |
|
11.5-12.5 |
100 |
119 |
219 |
28.5-29.5 |
8 |
5 |
13 |
|
12.5-13.5 |
129 |
125 |
254 |
29.5-30.5 |
15 |
4 |
19 |
|
13.5-14.5 |
140 |
137 |
277 |
(30.5-31.5) |
|
|
|
|
14.5-15.5 |
178 |
132 |
310 |
(3l.5-75.5) |
109 |
46 |
154 |
|
15.5-16.5 |
192 |
175 |
367 |
(22.5-75.5) |
319 |
123 |
542 |
|
16.5-17.5 |
174 |
117 |
291 |
|
2320
|
1855
|
4175
|
Table II
Frequency-distribution of Head Length in 2320 Korean Males.
|
I∖n |
29 |
24 |
16 |
20 |
26 |
64 |
67 |
59 |
68 |
79 |
99 |
100 |
129 |
140 |
178 |
192 |
174 |
166 |
120 |
101 |
74 |
76 |
57 |
39 |
26 |
27 |
28 |
13 |
8 |
15 |
109 |
319 |
|
205-210 |
… |
… |
… |
… |
… |
… |
… |
… |
… |
… |
… |
… |
… |
… |
… |
… |
… |
… |
… |
… |
… |
… |
… |
… |
… |
… |
… |
… |
… |
… |
… |
… |
|
200-205 |
… |
… |
… |
… |
… |
… |
… |
… |
… |
… |
… |
… |
… |
… |
… |
… |
… |
1 |
… |
… |
… |
… |
… |
… |
… |
… |
… |
1 |
… |
… |
4 |
… |
|
195-200 |
… |
… |
… |
… |
… |
… |
… |
… |
… |
… |
… |
… |
… |
1 |
1 |
1 |
1 |
4 |
2 |
5 |
… |
2 |
1 |
1 |
2 |
… |
1 |
1 |
1 |
… |
1 |
5 |
|
190-195 |
… |
… |
… |
… |
… |
… |
1 |
… |
1 |
… |
2 |
3 |
4 |
2 |
6 |
13 |
3 |
7 |
11 |
9 |
3 |
9 |
6 |
1 |
4 |
3 |
… |
… |
… |
… |
7 |
21 |
|
185-190 |
… |
… |
… |
… |
… |
1 |
… |
2 |
… |
3 |
6 |
2 |
10 |
12 |
20 |
32 |
21 |
22 |
18 |
24 |
16 |
21 |
15 |
3 |
6 |
8 |
10 |
4 |
2 |
|
26 |
76 |
|
180-185 |
… |
… |
… |
… |
2 |
3 |
4 |
5 |
6 |
9 |
9 |
14 |
17 |
24 |
40 |
49 |
58 |
48 |
36 |
29 |
22 |
19 |
19 |
12 |
9 |
9 |
11 |
3 |
3 |
2 |
28 |
100 |
|
175-180 |
… |
… |
… |
3 |
3 |
10 |
14 |
12 |
19 |
19 |
24 |
28 |
34 |
32 |
43 |
46 |
48 |
47 |
38 |
20 |
19 |
13 |
13 |
13 |
4 |
3 |
1 |
3 |
1 |
6 |
24 |
65 |
|
170-175 |
… |
… |
2 |
2 |
4 |
14 |
16 |
17 |
18 |
21 |
33 |
23 |
35 |
35 |
40 |
37 |
30 |
24 |
10 |
9 |
9 |
9 |
2 |
6 |
|
2 |
1 |
1 |
2 |
4 |
15 |
32 |
|
165-170 |
… |
4 |
6 |
3 |
9 |
22 |
23 |
14 |
15 |
15 |
15 |
19 |
20 |
24 |
22 |
13 |
12 |
12 |
3 |
2 |
5 |
3 |
1 |
3 |
1 |
2 |
1 |
… |
… |
3 |
2 |
10 |
|
160-165 |
2 |
5 |
3 |
9 |
6 |
9 |
6 |
8 |
7 |
10 |
9 |
10 |
6 |
10 |
5 |
1 |
1 |
1 |
2 |
1 |
… |
… |
… |
… |
… |
… |
… |
… |
… |
… |
2 |
2 |
|
155-160 |
5 |
8 |
3 |
1 |
2 |
2 |
2 |
… |
2 |
2 |
1 |
1 |
2 |
… |
1 |
… |
… |
… |
… |
1 |
… |
… |
… |
… |
… |
… |
… |
… |
… |
… |
… |
… |
|
150-155 |
11 |
3 |
… |
2 |
… |
… |
1 |
1 |
… |
… |
… |
… |
1 |
… |
… |
… |
… |
… |
… |
1 |
… |
… |
… |
… |
… |
… |
… |
… |
… |
… |
… |
… |
|
145-150 |
5 |
4 |
2 |
… |
… |
1 |
… |
… |
… |
… |
… |
… |
… |
… |
… |
… |
… |
… |
… |
… |
… |
… |
… |
… |
… |
… |
… |
… |
… |
… |
… |
… |
|
140-145 |
3 |
… |
… |
… |
… |
… |
… |
… |
… |
… |
… |
… |
… |
… |
… |
… |
… |
… |
… |
… |
… |
… |
… |
… |
… |
… |
… |
… |
… |
… |
… |
… |
|
155-140 |
1 |
… |
… |
… |
… |
… |
… |
… |
… |
… |
… |
… |
… |
… |
… |
… |
… |
… |
… |
… |
… |
… |
… |
… |
… |
… |
… |
… |
… |
… |
… |
… |
|
130-135 |
1 |
… |
… |
… |
… |
… |
… |
… |
… |
… |
… |
… |
… |
… |
… |
… |
… |
… |
… |
… |
… |
… |
… |
… |
… |
… |
… |
… |
… |
… |
… |
… |
|
125-130 |
1 |
… |
… |
… |
… |
… |
… |
… |
… |
… |
… |
… |
… |
… |
… |
… |
… |
… |
… |
… |
… |
… |
… |
… |
… |
… |
… |
… |
… |
… |
… |
… |
|
Age |
1 |
2 |
3 |
4 |
5 |
6 |
7 |
8 |
9 |
10 |
11 |
12 |
13 |
14 |
15 |
16 |
17 |
18 |
19 |
20 |
21 |
22 |
23 |
24 |
25 |
26 |
27 |
28 |
29 |
30 |
31-75 |
23-75 |
Table III
Frequency-distribution of Head Length in 1855 Korean Females.
|
I∖n |
13 |
23 |
10 |
15 |
17 |
36 |
66 |
109 |
100 |
126 |
124 |
119 |
125 |
137 |
132 |
175 |
117 |
107 |
67 |
37 |
42 |
35 |
23 |
11 |
8 |
6 |
9 |
11 |
5 |
4 |
46 |
123 |
|
205-210 |
… |
… |
… |
… |
… |
… |
… |
… |
… |
… |
… |
… |
… |
… |
… |
… |
… |
… |
… |
… |
… |
… |
… |
… |
… |
… |
… |
… |
… |
… |
… |
… |
|
200-205 |
… |
… |
… |
… |
… |
… |
… |
… |
… |
… |
… |
… |
… |
… |
… |
… |
… |
… |
… |
… |
… |
… |
… |
… |
… |
… |
… |
… |
… |
… |
1 |
1 |
|
195-200 |
… |
… |
… |
… |
… |
… |
… |
… |
1 |
… |
… |
… |
… |
… |
… |
… |
… |
… |
… |
… |
… |
… |
… |
… |
… |
… |
… |
… |
… |
… |
… |
… |
|
190-195 |
… |
… |
… |
… |
… |
… |
… |
… |
… |
… |
1 |
… |
… |
… |
… |
3 |
1 |
1 |
… |
… |
… |
… |
1 |
… |
… |
… |
1 |
… |
… |
… |
2 |
4 |
|
185-190 |
… |
… |
… |
… |
… |
… |
… |
… |
2 |
… |
3 |
3 |
4 |
2 |
6 |
10 |
3 |
8 |
4 |
1 |
2 |
2 |
3 |
… |
… |
… |
1 |
… |
… |
… |
6 |
10 |
|
180-185 |
… |
… |
… |
… |
… |
1 |
4 |
3 |
3 |
10 |
11 |
11 |
16 |
19 |
28 |
33 |
26 |
26 |
14 |
7 |
9 |
10 |
4 |
3 |
2 |
1 |
1 |
2 |
1 |
1 |
9 |
24 |
|
175-180 |
… |
… |
… |
… |
1 |
2 |
3 |
12 |
14 |
19 |
20 |
30 |
23 |
33 |
40 |
45 |
37 |
35 |
20 |
10 |
15 |
10 |
7 |
4 |
5 |
1 |
4 |
4 |
2 |
1 |
13 |
41 |
|
170-175 |
… |
… |
… |
1 |
4 |
13 |
23 |
37 |
30 |
37 |
35 |
42 |
46 |
41 |
34 |
62 |
37 |
28 |
21 |
11 |
13 |
9 |
8 |
3 |
1 |
4 |
2 |
3 |
1 |
2 |
12 |
36 |
|
165-170 |
… |
1 |
|
5 |
6 |
14 |
17 |
33 |
29 |
39 |
28 |
23 |
26 |
26 |
21 |
18 |
11 |
9 |
6 |
6 |
2 |
4 |
… |
1 |
… |
… |
… |
2 |
… |
… |
1 |
4 |
|
160-165 |
1 |
3 |
2 |
3 |
4 |
6 |
11 |
19 |
19 |
13 |
24 |
7 |
9 |
10 |
3 |
4 |
1 |
… |
2 |
2 |
1 |
… |
… |
… |
… |
… |
… |
… |
1 |
… |
2 |
3 |
|
155-160 |
1 |
5 |
2 |
3 |
2 |
… |
8 |
3 |
1 |
7 |
1 |
3 |
1 |
6 |
… |
… |
1 |
… |
… |
… |
… |
… |
… |
… |
… |
… |
… |
… |
… |
… |
… |
… |
|
160-155 |
4 |
10 |
5 |
3 |
… |
… |
… |
2 |
1 |
|
1 |
… |
… |
… |
… |
… |
… |
… |
… |
… |
… |
… |
… |
… |
… |
… |
… |
… |
… |
… |
… |
… |
|
145-150 |
2 |
4 |
1 |
… |
… |
… |
… |
… |
… |
… |
… |
… |
… |
… |
… |
… |
… |
… |
… |
… |
… |
… |
… |
… |
… |
… |
… |
… |
… |
… |
… |
… |
|
140-145 |
3 |
… |
… |
… |
… |
… |
… |
… |
… |
… |
… |
… |
… |
… |
… |
… |
… |
… |
… |
… |
… |
… |
… |
… |
… |
… |
… |
… |
… |
… |
… |
… |
|
135-140 |
2 |
… |
… |
… |
… |
… |
… |
… |
… |
… |
… |
… |
… |
… |
… |
… |
… |
… |
… |
… |
… |
… |
… |
… |
… |
… |
… |
… |
… |
… |
… |
… |
|
130-135 |
… |
… |
… |
… |
… |
… |
… |
… |
… |
… |
… |
… |
… |
… |
… |
… |
… |
… |
… |
… |
… |
… |
… |
… |
… |
… |
… |
… |
… |
… |
… |
… |
|
125-130 |
… |
… |
… |
… |
… |
… |
… |
… |
… |
… |
… |
… |
… |
… |
… |
… |
… |
… |
… |
… |
… |
… |
… |
… |
… |
… |
… |
… |
… |
… |
… |
… |
|
Age |
1 |
2 |
3 |
4 |
5 |
6 |
7 |
8 |
9 |
10 |
11 |
12 |
13 |
14 |
15 |
16 |
17 |
18 |
19 |
20 |
21 |
22 |
23 |
24 |
25 |
26 |
27 |
28 |
29 |
30 |
31-75 |
23-75 |
Table IV (1)
Mean Values of Head Length according to Ages in Male.
|
♂ |
|
Age |
M ± m |
σ |
V |
Max. |
Min. |
|
1 |
150.09±1.47 |
7.94 |
5.29 |
160 |
126 |
|
2 |
157.70±1.32 |
6.46 |
4.09 |
168 |
145 |
|
3 |
162.82±1.85 |
7.39 |
4.54 |
165 |
145 |
|
4 |
165.25±1.59 |
7.14 |
4.32 |
178 |
150 |
|
5 |
168.65±1.31 |
6.69 |
3.97 |
182 |
155 |
|
6 |
169.84±0.84 |
6.73 |
3.96 |
186 |
147 |
|
7 |
171.08±0.91 |
7.44 |
4.35 |
182 |
153 |
|
8 |
171.99±0.89 |
6.81 |
3.96 |
185 |
154 |
|
9 |
172.50±0.80 |
6.64 |
3.85 |
194 |
159 |
|
10 |
172.82±0.79 |
6.99 |
4.04 |
187 |
156 |
|
11 |
173.61±0.89 |
8.94 |
5.15 |
191 |
155 |
|
12 |
174.10±0.71 |
7.14 |
4.10 |
191 |
157 |
|
13 |
175.29±0.44 |
5.03 |
2.86 |
193 |
150 |
|
14 |
175.53±0.63 |
7.40 |
4.21 |
195 |
160 |
|
15 |
177.75±0.55 |
7.28 |
4.09 |
199 |
160 |
|
16 |
179.84±0.50 |
6.90 |
3.84 |
198 |
165 |
|
17 |
179.11±0.49 |
6.48 |
3.62 |
199 |
164 |
|
18 |
180.00±0.54 |
7.01 |
3.89 |
200 |
161 |
|
19 |
181.38±0.59 |
6.46 |
3.56 |
195 |
160 |
|
20 |
182.40±0.79 |
7.95 |
4.36 |
198 |
151 |
|
21 |
180.48±0.73 |
6.26 |
3.47 |
190 |
164 |
|
22 |
182.83±0.81 |
7.04 |
3.85 |
195 |
165 |
|
23 |
181.62±0.77 |
5.78 |
3.18 |
196 |
169 |
|
24 |
179.17±1.01 |
6.34 |
3.54 |
200 |
170 |
|
25 |
185.00±1.31 |
6.68 |
3.61 |
196 |
167 |
|
26 |
182.67±1.30 |
6.73 |
3.68 |
195 |
166 |
|
27 |
183.70±1.02 |
5.11 |
2.78 |
195 |
167 |
|
28 |
185.58±2.13 |
7.72 |
4.16 |
200 |
174 |
|
29 |
183.12±2.69 |
7.68 |
4.19 |
198 |
170 |
|
30 |
179.84±1.24 |
4.79 |
2.66 |
189 |
171 |
|
31-75 |
182.09±0.73 |
7.62 |
4.18 |
200 |
160 |
|
23-75 |
182.42±0.39 |
7.01 |
3.84 |
200 |
166 |
Table IV (2)
Mean Values of Head Length according to Ages in Females.
|
♀ |
|
Age |
M±m |
σ |
V |
Max. |
Min. |
|
1 |
148.27±2.03 |
7.35 |
4.96 |
160 |
135 |
|
2 |
154.67±1.12 |
5.38 |
3.48 |
165 |
145 |
|
3 |
155.00±1.28 |
4.63 |
2.99 |
162 |
145 |
|
4 |
161.84±1.62 |
6.30 |
3.89 |
168 |
150 |
|
5 |
169.92±1.42 |
5.91 |
3.54 |
179 |
155 |
|
6 |
169.44±0.76 |
4.61 |
2.72 |
181 |
160 |
|
7 |
168.56±0.80 |
6.48 |
3.84 |
183 |
155 |
|
8 |
168.83±0.51 |
5.32 |
3.15 |
182 |
153 |
|
9 |
170.35±0.65 |
6.54 |
3.84 |
190 |
153 |
|
10 |
170.59±0.57 |
6.39 |
3.74 |
184 |
155 |
|
11 |
172.29±0.63 |
7.08 |
4.11 |
188 |
155 |
|
12 |
173.13±0.56 |
6.10 |
3.52 |
188 |
155 |
|
13 |
173.30±0.55 |
6.15 |
3.55 |
188 |
156 |
|
14 |
172.97±0.57 |
6.69 |
3.87 |
188 |
155 |
|
15 |
175.91±0.50 |
5.75 |
3.27 |
187 |
153 |
|
16 |
176.13±0.45 |
6.02 |
3.42 |
192 |
160 |
|
17 |
176.17±0.53 |
5.75 |
3.26 |
186 |
166 |
|
18 |
177.55±0.53 |
5.51 |
3.10 |
188 |
165 |
|
19 |
175.49±0.75 |
6.18 |
3.52 |
185 |
160 |
|
20 |
174.80±0.88 |
5.99 |
3.43 |
185 |
160 |
|
21 |
176.67±0.80 |
5.22 |
2.95 |
185 |
160 |
|
22 |
177.07±0.94 |
5.47 |
3.09 |
188 |
164 |
|
23 |
178.76±1.18 |
5.68 |
3.18 |
192 |
170 |
|
24 |
176.59±1.49 |
4.92 |
2.79 |
180 |
165 |
|
25 |
178.12±1.04 |
2.99 |
1.68 |
183 |
172 |
|
26 |
175.00±1.27 |
3.82 |
2.18 |
182 |
170 |
|
27 |
179.72±2.09 |
6.28 |
3.49 |
191 |
170 |
|
28 |
175.22±1.18 |
3.90 |
2.22 |
180 |
166 |
|
29 |
176.50±1.73 |
3.87 |
2.19 |
180 |
160 |
|
30 |
176.25±2.07 |
4.14 |
2.35 |
184 |
170 |
|
31-75 |
178.80±1.14 |
7.72 |
4.32 |
203 |
160 |
|
23-75 |
177.83±0.58 |
6.45 |
3.63 |
203 |
160 |
Table V
Ratio of Differences of two Means (♂, ♀) to its Probable error of the Head Length.
|
Age |
M1-M2
|
m. dif. |
|
|
Age |
M1-M2
|
m. dif. |
|
|
|
1 |
1.82 |
2.51 |
0.72 |
< 3 |
17 |
2.94 |
0.72 |
4.08 |
> 3 |
|
2 |
3.03 |
1.73 |
1.75 |
< 3 |
18 |
2.45 |
0.75 |
3.27 |
> 3 |
|
3 |
7.82 |
2.25 |
3.48 |
> 3 |
19 |
6.34 |
0.95 |
6.67 |
> 3 |
|
4 |
3.41 |
2.27 |
1.50 |
< 3 |
20 |
7.60 |
1.18 |
6.44 |
> 3 |
|
5 |
1.73 |
1.93 |
0.90 |
< 3 |
21 |
3.81 |
1.08 |
3.53 |
>3 |
|
6 |
0.40 |
1.13 |
0.35 |
< 3 |
22 |
5.76 |
1.23 |
4.68 |
> 3 |
|
7 |
2.52 |
1.21 |
2.08 |
< 3 |
23 |
2.86 |
1.40 |
2.04 |
< 3 |
|
8 |
3.16 |
1.02 |
3.10 |
> 3 |
24 |
2.58 |
1.80 |
1.43 |
< 3 |
|
9 |
2.15 |
1.13 |
1.90 |
< 3 |
25 |
6.88 |
1.67 |
4.12 |
> 3 |
|
10 |
2.23 |
0.97 |
2.30 |
< 3 |
26 |
7.67 |
1.82 |
4.21 |
> 3 |
|
11 |
1.32 |
1.09 |
1.21 |
< 3 |
27 |
3.98 |
2.32 |
1.72 |
< 3 |
|
12 |
0.97 |
0.90 |
1.08 |
< 3 |
28 |
10.36 |
2.36 |
4.39 |
> 3 |
|
13 |
1.99 |
0.70 |
2.84 |
< 3 |
29 |
6.62 |
3.20 |
2.07 |
< 3 |
|
14 |
2.56 |
0.84 |
3.05 |
> 3 |
30 |
3.59 |
2.41 |
1.49 |
< 3 |
|
15 |
1.84 |
0.74 |
2.45 |
< 3 |
31-75 |
3.29 |
1.35 |
2.44 |
< 3 |
|
16 |
3.71 |
0.67 |
5.54 |
> 3 |
23-75 |
4.69 |
0.70 |
6.56 |
> 3 |
Table VI
Ratio of Differences of the Developmental rate of Head Lengtb between Male and Female.
|
t(Age) ∖ Ratio |
♂ |
♀ |
t(Age) ∖ Ratio |
♂ |
♀ |
|
Ltx-Ltx' |
|
Ltx-Ltx' |
|
Ltx-Ltx' |
|
Ltx-Ltx' |
|
|
1-2 |
7.61 |
5.07 |
6.40 |
4.32 |
17-18 |
0.89 |
0.50 |
1.38 |
0.78 |
|
2-3 |
5.21 |
3.25 |
0.33 |
0.21 |
18-19 |
1.38 |
0.77 |
-2.06 |
…… |
|
3-4 |
2.43 |
1.49 |
6.48 |
4.41 |
19-20 |
1.02 |
0.56 |
-0.69 |
…… |
|
4-5 |
3.40 |
2.06 |
5.08 |
3.14 |
20-21 |
-0.92 |
…… |
1.87 |
…… |
|
5-6 |
1.19 |
0.70 |
2.52 |
1.51 |
21-22 |
2.35 |
…… |
0.40 |
…… |
|
6-7 |
1.24 |
0.73 |
-0.88 |
…… |
22-23 |
-1.21 |
…… |
1.69 |
…… |
|
7-8 |
0.91 |
0.53 |
0.27 |
0.16 |
23-24 |
-2.45 |
…… |
-2.17 |
…… |
|
8-9 |
0.51 |
0.30 |
1.52 |
0.90 |
24-25 |
5.83 |
…… |
1.53 |
…… |
|
9-10 |
0.32 |
0.19 |
0.24 |
0.14 |
25-26 |
-2.33 |
…… |
-3.12 |
…… |
|
10-11 |
0.79 |
0.46 |
1.70 |
1.00 |
26-27 |
1.03 |
…… |
4.72 |
…… |
|
11-12 |
0.49 |
0.28 |
0.84 |
0.49 |
27-28 |
1.88 |
…… |
-4.50 |
…… |
|
12-13 |
1.19 |
0.68 |
0.17 |
0.10 |
28-29 |
-2.46 |
…… |
1.28 |
…… |
|
13-14 |
0.14 |
0.08 |
-0.33 |
…… |
29-30 |
-3.28 |
…… |
-0.25 |
…… |
|
14-15 |
2.22 |
1.26 |
2.94 |
1.70 |
30-31 |
2.25 |
…… |
2.55 |
…… |
|
15-16 |
1.09 |
0.61 |
0.22 |
0.13 |
(20-75) |
-0.19(average 18-75)0.04 |
…… |
|
16-17 |
-0.67 |
…… |
0.04 |
0.02 |
…… |
…… |
…… |
…… |
…… |
Table VII
Calculation of Mean Values of the Head Length in Male.
|
a0=182.42 ♂
|
|
a |
y |
|
|
log10 Z |
η |
x |
(x)2
|
xη |
|
1 |
150.09 |
0.00666 |
0.00118 |
0.0719 |
-2.9281 |
1 |
1 |
-2.9281 |
|
2 |
157.70 |
0.00643 |
0.00086 |
0.9435 |
-3.0655 |
2 |
4 |
-6.1310 |
|
3 |
162.82 |
0.00614 |
0.00066 |
0.8195 |
-3.1805 |
3 |
9 |
-9.5415 |
|
4 |
165.25 |
0.00605 |
0.00057 |
0.7559 |
-3.2441 |
4 |
16 |
-12.9764 |
|
5 |
168.65 |
0.00593 |
0.00045 |
0.6532 |
-3.3468 |
5 |
25 |
-16.7340 |
|
6 |
169.84 |
0.00589 |
0.00041 |
0.6128 |
-3.3872 |
6 |
36 |
-20.3232 |
|
7 |
171.08 |
0.00584 |
0.00036 |
0.5563 |
-3.4437 |
7 |
49 |
-24.1059 |
|
8 |
171.99 |
0.00582 |
0.00034 |
0.5315 |
-3.4685 |
8 |
64 |
-27.7480 |
|
9 |
172.50 |
0.00580 |
0.00032 |
0.5051 |
-3.4949 |
9 |
81 |
-31.4541 |
|
10 |
172.82 |
0.00579 |
0.00031 |
0.4914 |
-3.5086 |
10 |
100 |
-35.0860 |
|
11 |
173.61 |
0.00576 |
0.00028 |
0.4472 |
-3.5528 |
11 |
121 |
-39.0808 |
|
12 |
174.10 |
0.00574 |
0.00026 |
0.4150 |
-3.5850 |
12 |
144 |
-43.0200 |
|
13 |
175.29 |
0.00572 |
0.00024 |
0.3802 |
-3.6198 |
13 |
169 |
-47.0574 |
|
14 |
175.53 |
0.00571 |
0.00023 |
0.3617 |
-3.6383 |
14 |
196 |
-50.9362 |
|
15 |
177.75 |
0.00563 |
0.00015 |
0.1761 |
-3.8239 |
15 |
225 |
-57.3585 |
|
16 |
179.84 |
0.00556 |
0.00008 |
0.9031 |
-4.0969 |
16 |
256 |
-65.5504 |
|
17 |
179.11 |
0.00558 |
0.00010 |
0.0000 |
-4.0000 |
17 |
289 |
-68.0000 |
|
18 |
180.00 |
0.00556 |
0.00008 |
0.9031 |
-4.0969 |
18 |
324 |
-73.7442 |
|
19 |
181.38 |
0.00552 |
0.00004 |
0.6020 |
-4.3980 |
19 |
361 |
-83.5620 |
|
20 |
182.40 |
0.00549 |
0.00001 |
0.0000 |
-5.0000 |
20 |
400 |
-100.0000 |
|
21 |
180.48 |
0.00554 |
0.00006 |
0.7782 |
-4.2218 |
21 |
441 |
-88.6578 |
|
22 |
182.83 |
0.00548 |
0.00000 |
0.0000 |
-6.0000 |
22 |
484 |
-132.0000 |
|
n = 22 |
|
|
|
|
83.1013
|
253
|
3795
|
-1035.9955
|
|
Σ(η) |
Σ(x) |
Σ(x)2
|
Σ(xη) |
Table VIII
Calculation of Mean Values of the Head Length in Female.
|
|
a0=177.83 |
|
♀ |
|
|
|
|
|
a |
y |
|
|
log 10 Z |
ŋ |
x |
(x)2
|
xŋ
|
|
1 |
148.27 |
0.00674 |
0.00111 |
0.0453 |
-2.9547 |
1 |
1 |
-2.9547 |
|
2 |
154.67 |
" 646 |
0.00083 |
0.9191 |
-3.0809 |
2 |
4 |
-6.1618 |
|
3 |
155.00 |
" 645 |
" 82 |
0.9133 |
-3.0862 |
3 |
9 |
-9.2586 |
|
4 |
161.84 |
" 618 |
" 55 |
0.7408 |
-3.2597 |
4 |
16 |
-13.0388 |
|
5 |
166.92 |
" 599 |
" 36 |
0.5563 |
-3.4437 |
5 |
25 |
-17.2185 |
|
6 |
169.44 |
" 590 |
" 27 |
0.4314 |
-3.5686 |
6 |
36 |
-21.4116 |
|
7 |
168.56 |
" 593 |
" 30 |
0.4771 |
-3.5229 |
7 |
49 |
-24.6603 |
|
8 |
168.83 |
" 592 |
" 29 |
0.4624 |
-3.5376 |
8 |
64 |
-28.3008 |
|
9 |
170.35 |
" 589 |
" 26 |
0.4150 |
-3.5850 |
9 |
81 |
-32.2650 |
|
10 |
170.59 |
" 586 |
" 23 |
0.3617 |
-3.6383 |
10 |
100 |
-36.3830 |
|
11 |
172.29 |
" 581 |
" 18 |
0.2553 |
-3.7447 |
11 |
121 |
-41.1917 |
|
12 |
173.13 |
" 578 |
" 15 |
0.1761 |
-3.8239 |
12 |
144 |
-45.8868 |
|
33 |
173.30 |
" 577 |
" 14 |
0.1461 |
-3.8539 |
13 |
169 |
-50.1007 |
|
14 |
172.97 |
" 579 |
" 16 |
0.2041 |
-3.7959 |
14 |
196 |
-53.1426 |
|
15 |
175.91 |
" 569 |
6.0E-5 |
0.7781 |
-4.2219 |
15 |
225 |
-63.3285 |
|
16 |
176.13 |
" 567 |
" 4 |
0.6020 |
-4.3980 |
16 |
256 |
-70.3680 |
|
17 |
176.17 |
" 568 |
" 5 |
0.6990 |
-4.3010 |
17 |
289 |
-73.1170 |
|
18 |
177.55 |
" 563 |
" 0 |
0 |
-6.0000*
|
-18 |
324 |
-108.0000 |
|
39 |
175.49 |
" 570 |
" 7 |
0.8451 |
-4.1549 |
19 |
361 |
-78.9431 |
|
20 |
174.80 |
" 572 |
" 9 |
0.9542 |
-4.0458 |
20 |
400 |
-80.9160 |
|
21 |
176.67 |
" 566 |
" 3 |
0.4771 |
-4.5229 |
21 |
441 |
-94.9809 |
|
22 |
177.07 |
" 565 |
" 2 |
0.3010 |
-4.6990 |
22 |
484 |
-103.3780 |
|
n = 22
|
|
|
|
|
-85.2395
|
253
|
3795
|
-1055.0064
|
|
|
|
|
|
∑(ŋ) |
∑(x) |
∑(x)2
|
∑(xŋ) |
Table IX
Comparison of Mean Values both Experimental and calculatə[e]d of the Head Length in Male and Female according to Age.
|
♂ |
♀ |
|
Age |
Experimental |
Calculated |
Experimental |
Calculated |
|
1 |
150.09 |
143.30 |
148.27 |
150.32 |
|
2 |
157.70 |
149.34 |
154.67 |
154.54 |
|
3 |
162.82 |
154.67 |
155.00 |
158.20 |
|
4 |
165.25 |
159.19 |
161.84 |
161.34 |
|
5 |
168.65 |
163.11 |
166.92 |
164.03 |
|
6 |
169.84 |
166.43 |
169.44 |
166.30 |
|
7 |
171.08 |
169.22 |
168.56 |
168.24 |
|
8 |
171.99 |
171.56 |
168.83 |
169.85 |
|
9 |
172.50 |
173.52 |
170.35 |
171.22 |
|
10 |
172.82 |
175.12 |
170.59 |
172.35 |
|
11 |
173.61 |
176.46 |
172.29 |
173.29 |
|
12 |
174.10 |
177.55 |
173.13 |
174.07 |
|
13 |
175.29 |
178.44 |
173.30 |
174.72 |
|
14 |
175.53 |
179.18 |
172.97 |
175.18 |
|
15 |
177.75 |
179.78 |
175.91 |
175.72 |
|
16 |
179.84 |
180.27 |
176.13 |
176.09 |
|
17 |
179.11 |
180.67 |
176.17 |
176.38 |
|
18 |
180.00 |
181.00 |
177.55 |
176.64 |
|
19 |
181.38 |
181.26 |
175.49 |
176.87 |
|
20 |
182.40 |
181.48 |
174.80 |
177.02 |
|
21 |
180.48 |
181.66 |
176.67 |
177.16 |
|
22 |
182.83 |
181.80 |
177.07 |
177.28 |
Table X
Comparison of Development of the Head Length (Mean Value) with other Races both Male and Female.
|
Races |
Korean |
White American |
Europian |
|
Choi |
Kajimura |
West |
Schweden |
Schweizer |
Holsteiner |
|
Age |
♂ |
♀ |
♂ |
♀ |
♂ |
♀ |
♂ |
♀ |
♂ |
♀ |
♂ |
♀ |
|
1 |
150.09 |
148.27 |
… |
… |
… |
… |
… |
… |
… |
… |
143 |
139 |
|
2 |
157.70 |
154.67 |
… |
… |
… |
… |
… |
… |
… |
… |
166 |
160 |
|
3 |
162.82 |
155.00 |
… |
… |
… |
… |
… |
… |
… |
… |
170 |
165 |
|
4 |
165.25 |
161.84 |
… |
… |
… |
… |
… |
… |
… |
… |
173 |
170 |
|
5 |
168.65 |
166.92 |
… |
… |
… |
… |
… |
… |
… |
… |
173 |
170 |
|
6 |
169.84 |
169.44 |
16.3 |
16.2 |
176 |
172 |
170.3 |
167.0 |
173 |
170 |
177 |
176 |
|
7 |
171.08 |
168.56 |
16.4 |
16.2 |
179 |
175 |
172.9 |
169.1 |
174 |
170 |
178 |
174 |
|
8 |
171.99 |
168.83 |
16.6 |
16.4 |
180 |
174 |
174.0 |
170.2 |
174 |
172 |
178 |
175 |
|
9 |
172.50 |
170.35 |
16.6 |
16.5 |
181 |
176 |
175.4 |
171.4 |
177 |
172 |
180 |
177 |
|
10 |
172.82 |
170.59 |
16.7 |
16.5 |
182 |
177 |
176.4 |
172.7 |
177 |
172 |
181 |
179 |
|
11 |
173.61 |
172.29 |
16.9 |
16.7 |
183 |
180 |
177.3 |
173.8 |
174 |
175 |
183 |
178 |
|
12 |
174.10 |
173.13 |
17.0 |
16.8 |
183 |
180 |
178.6 |
174.8 |
179 |
175 |
182 |
179 |
|
13 |
175.29 |
173.30 |
… |
… |
184 |
181 |
179.4 |
176.2 |
180 |
176 |
183 |
179 |
|
14 |
175.53 |
172.97 |
… |
… |
187 |
183 |
180.6 |
177.2 |
181 |
177 |
184 |
180 |
|
15 |
177.75 |
175.91 |
… |
… |
188 |
184 |
… |
… |
181 |
177 |
185 |
180 |
|
16 |
179.84 |
176.13 |
… |
… |
191 |
184 |
… |
… |
183 |
177 |
… |
… |
|
17 |
179.11 |
176.17 |
… |
… |
189 |
… |
… |
… |
183 |
… |
… |
… |
|
18 |
180.00 |
177.55 |
… |
… |
192 |
… |
… |
… |
186 |
… |
… |
… |
|
19 |
181.38 |
175.49 |
… |
… |
192 |
… |
… |
… |
188 |
… |
… |
… |
|
20 |
182.40 |
174.80 |
… |
… |
195 |
… |
… |
… |
188 |
… |
… |
… |
|
21 |
180.48 |
176.67 |
… |
… |
… |
… |
… |
… |
… |
… |
… |
… |
|
22 |
182.83 |
177.07 |
… |
… |
… |
… |
… |
… |
… |
… |
… |
… |
|
23-75 |
182.42 |
177.83 |
… |
… |
… |
… |
… |
… |
… |
… |
… |
… |
Table XI
Comparison of Head Length (Mean Value) with other Races both Male and Female in Adult (Full grow up).
|
Baces |
♂ |
♀ |
Observer |
Baces |
♂ |
♀ |
Observer |
|
Asia
|
|
|
|
Europ.
|
|
|
|
|
Andamanen-North |
173 |
165 |
Census of India |
Grogrussen |
179 |
172 |
Galai |
|
” South |
” |
166 |
” ” |
Litauer |
184 |
178 |
Baronas |
|
Kayan |
181 |
176 |
Haddon |
Weizrussen |
185 |
177 |
Boshdestwenski |
|
Birmanen |
” |
… |
Census of India |
Danen |
193 |
184 |
Hansen |
|
Manjurian |
181.2 |
173.69 |
Takamure |
Africa
|
|
|
|
|
Korean |
181.4 |
175.7 |
Kubo |
Mawanbi-Pigt. |
183 |
181 |
Czekanowski |
|
” |
182.42 |
177.83 |
Choi |
Agypter |
189 |
… |
Hrdlicka |
|
Chinese South |
ISO-183 |
… |
Hagen |
America
|
|
|
|
|
Land-Dajak |
183 |
… |
Haddon |
Chiliguan |
184 |
173 |
Lehmann-Nitsche |
|
Japanese |
188.55 |
179.31 |
Matsu mura |
Schingu-Indianer |
185 |
177 |
K. Banke |
|
Chineses North |
188.5 |
184 |
Koganei |
Mataco |
188 |
180 |
Lehmann-Nitsche |
|
Tschuktschen |
188 |
182 |
Bogoras |
Shochoni |
192 |
184 |
Boas |
|
Koriaken |
189 |
183 |
Tochelson |
Osea
|
|
|
|
|
Asiatic Eskimo |
190 |
184 |
Bogoras |
Toricebigebirge |
183 |
… |
Schlaginhaufen |
|
Tungusen |
194 |
185 |
Jochelson |
Jakumul |
191 |
… |
” |
|
Turkestan (Loplik) |
” |
… |
Joyce |
|
|
|
|


 PDF
PDF ePub
ePub Citation
 Print
Print


 XML Download