

 PDF
PDF ePub
ePub Citation
 Print
Print


Abstract
Purpose
Methods
Results
Conclusion
Figures and Tables
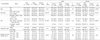
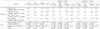
Table 2
Interest and experience of weight control of middle-aged consumers

1) Mean score of Likert scale (1: not at all, 2: little, 3: moderately, 4: very, 5: extremely) 2) N (%)
***p < 0.001 Significantly different by t-tst, χ2 test or ANOVA adjusted with age and education in case of female.
a, b, c: Different letters within the same row are significantly different at 0.05 by Scheffé test.
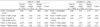
Table 3
Frequencies of eating-out/alcohol drinking per week and cost of eating-out of middle-aged consumers
1) Average cost = sum of cost for eating out of only the respondents who were answering/number of only who were answering.
*p < 0.05, **p < 0.01, ***p < 0.001 Significantly different by ANOVA adjusted with age and education in case of female.
a, b, c: Different letters within the same row are significantly different at 0.05 by Scheffé test.
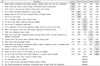
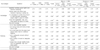
Table 5
Factor analysis results of dietary life style of females_rotated component matrix (N = 1,631)
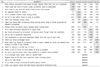
Table 6
Dietary life styles of middle-aged consumers
1) Mean score of Likert scale (1: strongly disagree, 2: disagree, 3: so-so, 4: agree, 5: strongly agree)
*p < 0.05, **p < 0.01 Significantly different by ANOVA adjusted with age and education in case of female.
a, b, c: Different letters within the same row are significantly different at 0.05 by Scheffé test.
Table 7
Healthy dietary life competence of middle-aged consumers
1) Mean score of Likert scale (1: strongly disagree, 2: disagree, 3: so-so, 4: agree, 5: strongly agree)
*p < 0.05, **p < 0.01, ***p < 0.001 Significantly different by ANOVA adjusted with age and education in case of female.
a, b, c: Different letters within the same row are significantly different at 0.05 by Scheffé test.
 XML Download