Abstract
Purpose
The purpose of this study was to analyze factors influencing eating problems among young female adults. Methods: Participants were 193 young female adults aged 19∼29 years who were recruited in August 2017. Four variables related to eating problems in young female adults, including body image dissatisfaction, self-esteem, trait anger, and depression, were measured using reliable instruments. Data were analyzed using the SPSS/WIN 21.0 program and Amos 24.0 for descriptive statistics, Pearson correlation coefficients, and path analysis. Results: The mean for eating problems in young female adults was 8.99, and 9.8% of subjects were classified as high risk with eating problems. Modified model demonstrated good model fit (χ2/df 0.47, GFI 0.99, AGFI 0.99, NFI 0.99, SRMR 0.022, RMSEA 0.001). Path analysis showed that body image dissatisfaction had the greatest direct effect on eating problems. Depression did not have a direct effect on eating problems, whereas it had indirect effects on eating problems through body image dissatisfaction as the mediating factor. Self-esteem had direct effects on depression and indirect effects on eating problems through depression and body image dissatisfaction as mediating factors. Trait anger had direct effects on depression and body image dissatisfaction and indirect effects on eating problems through depression and body image dissatisfaction as mediating factors. These factors accounted for 46% of the total variance, and the fit indices of the model satisfied the criteria of fitness. Conclusion: The results of this study reveal the important role of body dissatisfaction and psychological factors such as self-esteem, trait anger, and depression on eating problems. These factors influencing eating problems should be considered when developing programs to improve eating problems in young female adults.
References
1. World Health Organization. Global action plan for the prevention and control of NCDs 2013–2020 [Internet]. Geneva: World Health Organization;2013. [cited 2017 Oct 1]. Available from:. http://www.who.int/nmh/events/ncd_action_plan/en/.
2. Ministry of Health and Welfare (KR). Healthy plan 2020. Cheongwon: Ministry of Health and Welfare;2011.
3. Kwon SH. Status of under- and overnutrition in Korea National Health and Nutrition Examination Survey (KNHANES). Public Health Wkly Rep. 2014; 7(48):1077–1080.
4. Ministry of Health and Welfare (KR). Ministry of Health and Welfare statistical year book 2015. Sejong: Ministry of Health and Welfare;2015.
5. Lee SS, Oh KJ. The effect of shape and weight based self-evaluation and body dissatisfaction on disordered eating behaviors of female university students. Korean J Clin Psychol. 2004; 23(1):91–106.
6. Seo J, Ma H, Kim S, Kim J, Shin M, Yang YJ. Effects of the difference between actual body condition and body image perception on nutrient intake, weight control and mental health in Korean adults: based on the 5th Korea National Health and Nutrition Examination Survey. J Nutr Health. 2016; 49(3):153–164.

7. Cheon SH. A study on eating behavior, depression, anger, anger expression and BAS/BIS in adolescent women. Korean J Women Health Nurs. 2007; 13(4):310–319.

8. Rierdan J, Koff E. Weight, weight-related aspects of body image, and depression in early adolescent girls. Adolescence. 1997; 32(127):615–624.
9. Jeong SR, Kim S, Yang YJ. Health and nutritional status of Korean underweight women in their twenties: based on the 2010–2012 Korea National Health and Nutrition Examination Survey. J Nutr Health. 2016; 49(2):99–110.

10. Park YJ, Lee SJ, Shin NM, Shin H, Kim YK, Cho Y, Jeon S, Cho I. Bone mineral density, biochemical bone turnover markers and factors associated with bone health in young Korean women. J Korean Acad Nurs. 2014; 44(5):504–514.

11. Cooper Z, Shafran R. Cognitive behaviour therapy for eating disorders. Behav Cogn Psychother. 2008; 36(6):713–722.

12. Lee KH, Kim SK, Chun KJ, Han SH. The relationship between eating disorder and self-esteem in female college students. Korean J Women Health Nurs. 2003; 9(4):390–399.

13. Son YJ, Kim G. The relationship between obesity, self-esteem and depressive symptoms of adult women in Korea. Korean J Obes. 2012; 21(2):89–98.

14. Jang MH, Lee G. Body image dissatisfaction as a mediator of the association between BMI, self-esteem and mental health in early adolescents: a multiple-group path analysis across gender. J Korean Acad Nurs. 2013; 43(2):165–175.

15. Son EJ. The influence of self-esteem, physical comparison, thin-ideal internalization, and body dissatisfaction on the eating disorder symptoms of college aged women. Korean J Couns Psychother. 2008; 20(3):885–901.
16. Kim GN, Kim YH. Factors related to eating disorder behavior in university students. Fam Environ Res. 2004; 42(2):83–97.
17. Truglia E, Mannucci E, Lassi S, Rotella CM, Faravelli C, Ricca V. Aggressiveness, anger and eating disorders: a review. Psychopathology. 2006; 39(2):55–68.

18. Fassino S, Leombruni P, Pierò A, Abbate-Daga G, Giacomo Rovera G. Mood, eating attitudes, and anger in obese women with and without Binge Eating Disorder. J Psychosom Res. 2003; 54(6):559–566.

19. Choi MS, Cheon SH. Internalization of the sociocultural attitudes, body shape satisfaction, anger and eating attitudes in college women. Korean J Women Health Nurs. 2007; 13(4):327–335.

20. Yom YH, Lee KE. Factors affecting eating attitude of female undergraduates in regard to BMI. J Korean Acad Nurs. 2010; 40(5):676–685.

21. Park YR, Wee H, Kim SJ. Lifestyle, depression, and health related quality of life among women in Jeju province. J Korean Acad Community Health Nurs. 2010; 21(2):148–155.

22. Cha BK. Factors affecting health-related quality of life in women undergraduates. J Korean Acad Fundam Nurs. 2013; 20(4):400–409.

23. Cho JH, Han SN, Kim JH, Lee HM. Body image distortion in fifth and sixth grade students may lead to stress, depression, and undesirable dieting behavior. Nutr Res Pract. 2012; 6(2):175–181.

24. Lim SA, You S. Effects of self-esteem and depression on abnormal eating behavior among Korean female college students: mediating role of body dissatisfaction. J Child Fam Stud. 2017; 26(1):176–182.

25. Berg KC, Crosby RD, Cao L, Peterson CB, Engel SG, Mitchell JE, Wonderlich SA. Facets of negative affect prior to and following binge-only, purge-only, and binge/purge events in women with bulimia nervosa. J Abnorm Psychol. 2013; 122(1):111–118.

26. Sarwer DB, Wadden TA, Foster GD. Assessment of body image dissatisfaction in obese women: specificity, severity, and clinical significance. J Consult Clin Psychol. 1998; 66(4):651–654.

27. Kim HY, Lee MH, Bae JN, Kim CE, Yoo HJ, Lee JS. Anger assessment using state-trait anger expression inventory in middle-school students in Korea and association with depression. J Korean Acad Child Adolesc Psychiatry. 2015; 26(4):288–294.

28. Moon SH, Chung Y, Kim JH. The relation of anger and anger expression to eating disorders in late school-age children. J Korean Acad Child Health Nurs. 2009; 15(2):127–135.

29. Kang MH, Choue R. Relationships of body image, body stress and eating attitude, and dietary quality in middle school girls based on their BMI. Korean J Nutr. 2010; 43(3):285–293.

30. Yu JP. Concept and understanding of structural euation model. Seoul: Hannarae Publishing Co.;2012.
31. Garner DM, Olmsted MP, Bohr Y, Garfinkel PE. The eating attitudes test: psychometric features and clinical correlates. Psychol Med. 1982; 12(4):871–878.

32. Cooper PJ, Taylor MJ, Cooper Z, Fairbum CG. The development and validation of the body shape questionnaire. Int J Eat Disord. 1987; 6(4):485–494.

33. Rosenberg M. Society and the adolescent self-image. Princeton (NJ): Princeton University Press;1965.
34. Jon BJ. Self-esteem: a test of its measurability. Yonsei Nonchong. 1974; 11(1):107–130.
35. Chon KK, Hahn DW, Lee CH, Spielberger CD. Korean adaptation of the state-trait anger expression inventory: anger and blood pressure. Korean J Health Psychol. 1997; 2(1):60–78.
36. Radloff LS. The CES-D Scale: a self-report depression scale for research in the general population. Appl Psychol Meas. 1977; 1(3):385–401.
37. Kang HC. Discussions on the suitable interpretation of model fit indices and the strategies to fit model in structural equation modeling. J Korean Data Anal Soc. 2013; 15(2):653–668.
38. Park JY, Baek SY, Kim HS, Lim JH, Kim TH. Testing the biobehavioral family model in understanding the eating problems of adolescent girls. Child Health Nurs Res. 2013; 19(3):228–237.

39. Junne F, Zipfel S, Wild B, Martus P, Giel K, Resmark G, Friederich HC, Teufel M, de Zwaan M, Dinkel A, Herpertz S, Burgmer M, Tagay S, Rothermund E, Zeeck A, Ziser K, Herzog W, Löwe B. The relationship of body image with symptoms of depression and anxiety in patients with anorexia nervosa during outpatient psychotherapy: results of the ANTOP study. Psychotherapy (Chic). 2016; 53(2):141–151.

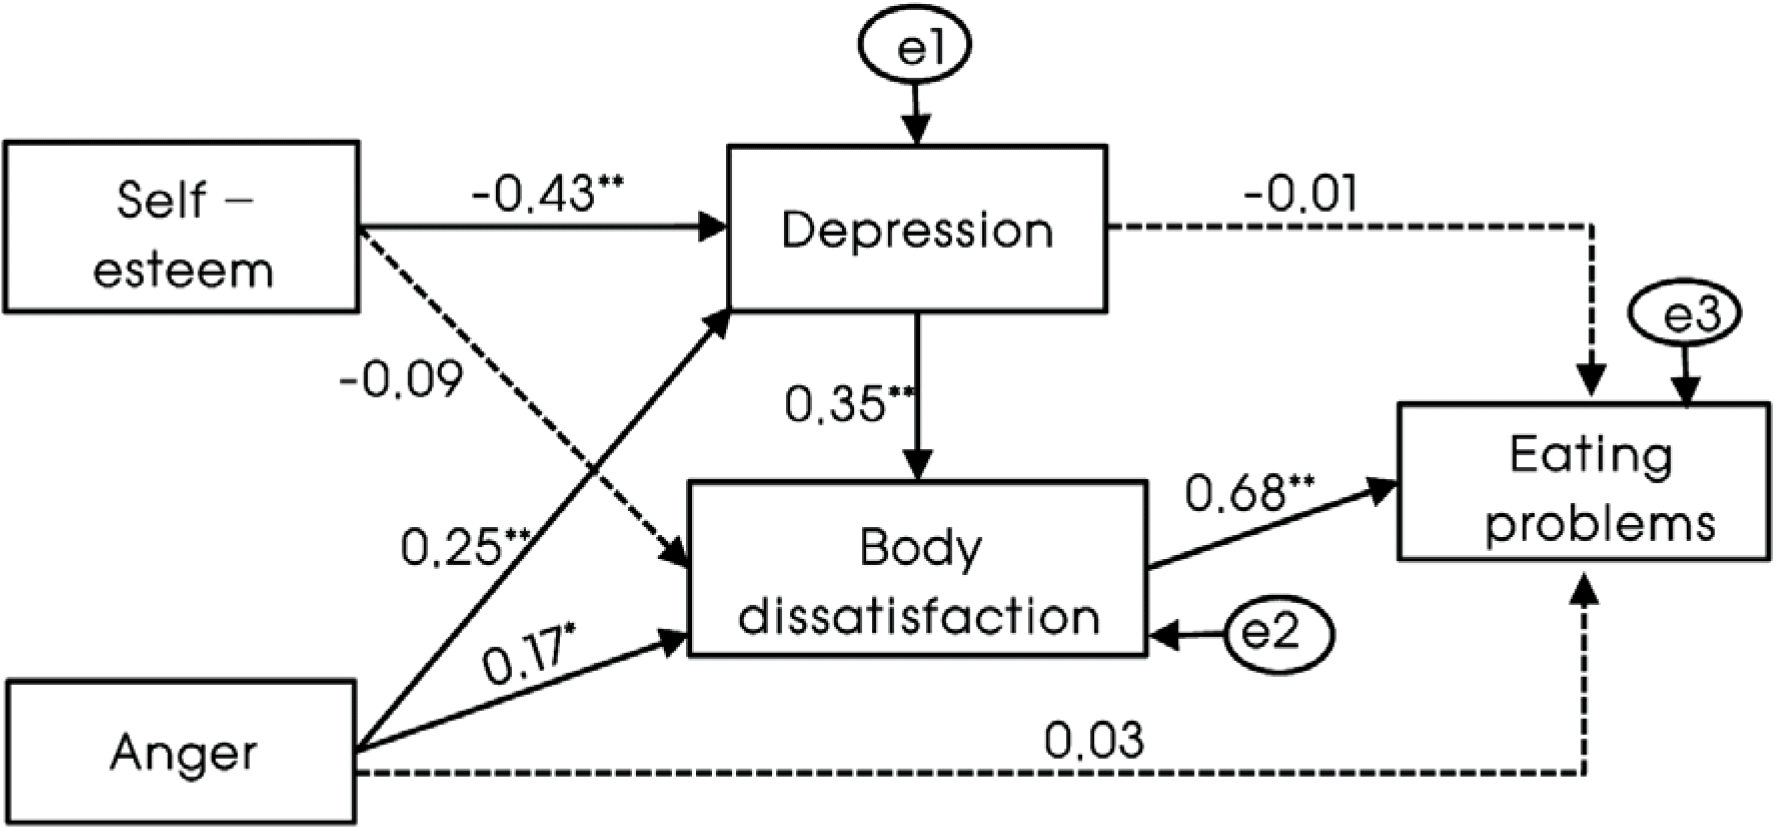
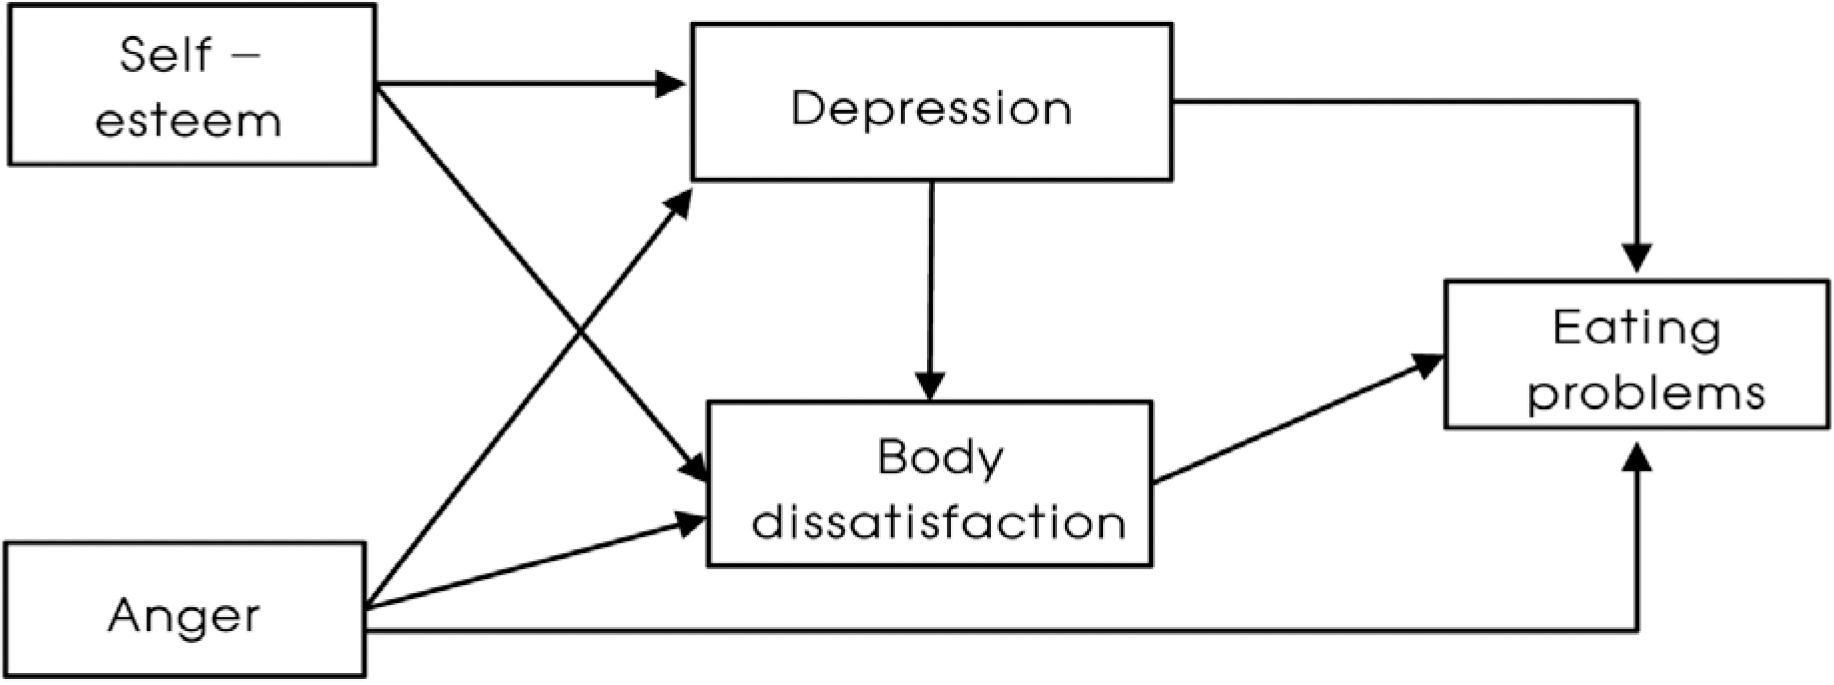
Fig. 2.
Path diagram for hypothetical model. Model fit: χ2(p) 0.067(0.796), χ2/df 0.067, GFI 0.99, AGFI 0.99, NFI 0.99, SRMR 0.003, RMSEA 0.001. ∗ p < 0.05, ∗∗ p < 0.01, ∗∗∗ p < 0.001, p-value tested by percentile bootstrap method → significant, ⇢ not significant

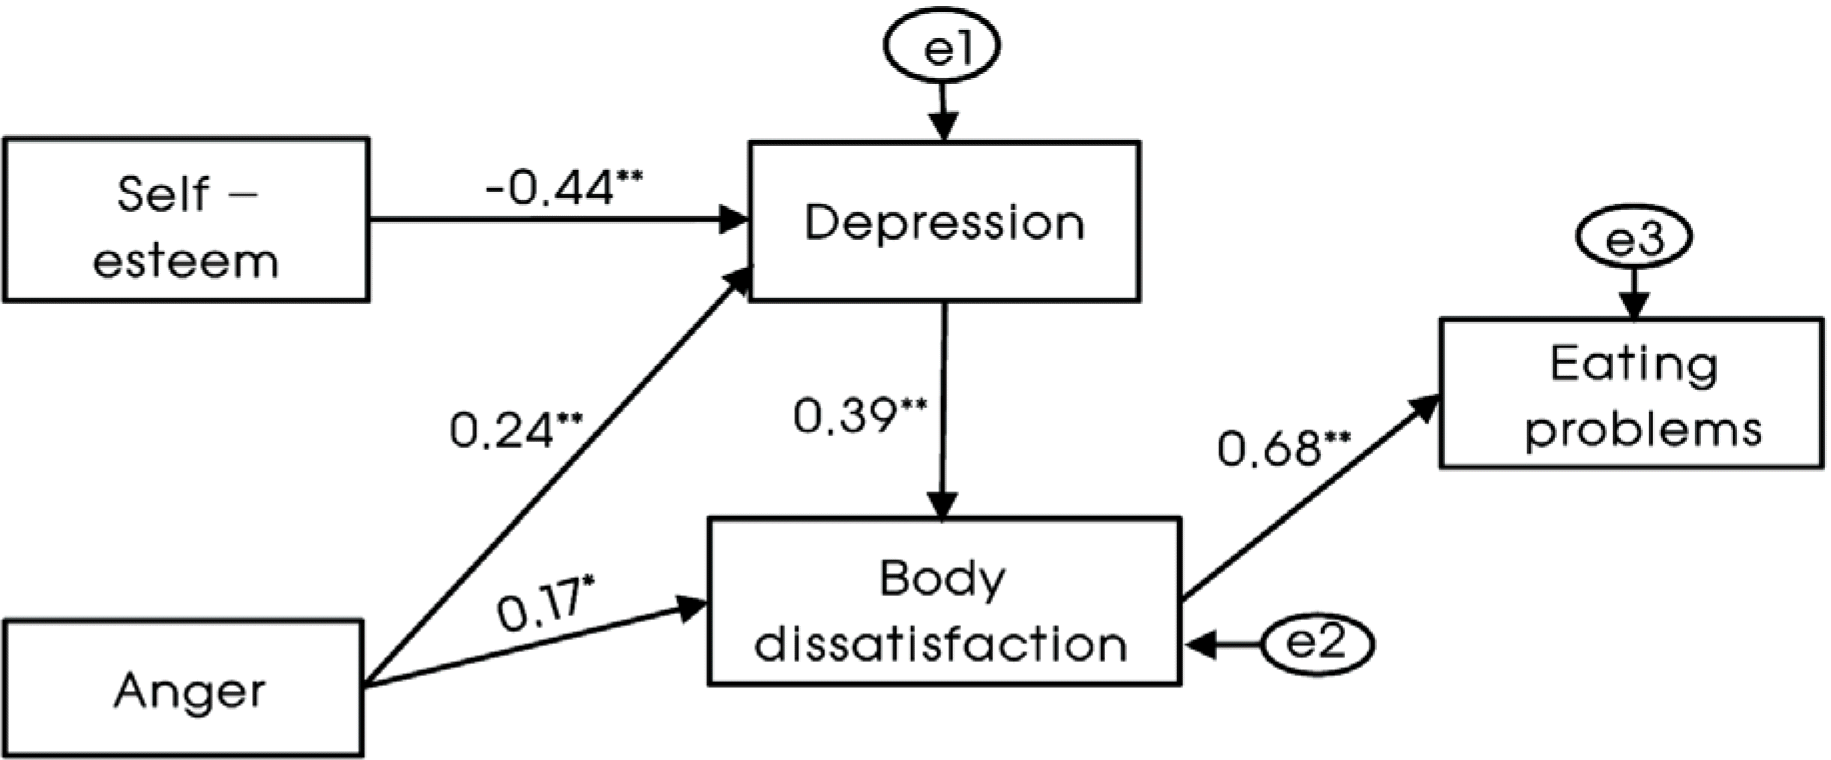
Fig. 3.
Path diagram for modified model. Model fit: χ2(p) 1.89(p = 0.756), χ2/df 0.47, GFI 0.99, AGFI 0.99, NFI 0.99, SRMR 0.022, RMSEA 0.001. ∗p < 0.05, ∗∗p < 0.01, ∗∗∗p < 0.001, p-value tested by percentile bootstrap method → significant

Table 1.
General characteristics
Table 2.
Descriptive statistics of variables
Table 3.
Pearson correlation coefficients between variables
| Variables | Eating problems | Body dissatisfaction | Depression | Trait anger | Self-esteem |
|---|---|---|---|---|---|
| Eating problems | 1 | ||||
| Body dissatisfaction | 0.69∗∗∗ | 1 | |||
| Depression | 0.31∗∗∗ | 0.45∗∗∗ | 1 | ||
| Trait anger | 0.23∗∗ | 0.30∗∗∗ | 0.33∗∗∗ | 1 | |
| Self-esteem | –0.19∗ | –0.29∗∗∗ | –0.48∗∗∗ | –0.18∗ | 1 |
Table 4.
Estimates and effects of predictor variables in hypothetical model
| Response variables | Explanatory variables | Standardized direct effect | Standardized indirect effect | Standardized total effect | SMC1) (R2) |
|---|---|---|---|---|---|
| Depression | Self-esteem | –0.43∗∗ | – | –0.43∗∗ | 0.29 |
| Trait anger | 0.25∗∗ | – | 0.25∗∗ | ||
| Body dissatisfaction | Self-esteem | –0.09 | –0.15∗∗ | –0.24∗∗ | 0.24 |
| Trait anger | 0.17∗ | 0.09∗∗ | 0.26∗∗ | ||
| Depression | 0.35∗∗ | – | 0.35∗∗ | ||
| Eating problems | Self-esteem | – | –0.16∗∗ | –0.16∗∗ | 0.47 |
| Trait anger | 0.03 | 0.18∗∗ | 0.20∗ | ||
| Depression | –0.01 | 0.24∗∗ | 0.23∗∗ | ||
| Body dissatisfaction | 0.68∗∗ | 0.68∗∗ |
Table 5.
Estimates and effects of predictor variables in modified model
| Response variables | Explanatory variables | standardized direct effect | standardized indirect effect | standardized total effect | SMC1) (R2) |
|---|---|---|---|---|---|
| Depression | Self-esteem | –0.44∗∗ | – | –0.44∗∗ | 0.29 |
| Trait anger | 0.24∗∗ | – | 0.24∗∗ | ||
| Body dissatisfaction | Self-esteem | – | –0.17∗∗ | –0.17∗∗ | 0.22 |
| Trait anger | 0.17∗ | 0.10∗∗ | 0.27∗∗ | ||
| Depression | 0.39∗∗ | – | 0.39∗∗ | ||
| Eating problems | Self-esteem | – | –0.12∗∗ | –0.12∗∗ | 0.46 |
| Trait anger | – | 0.18∗∗ | 0.18∗∗ | ||
| Depression | – | 0.26∗∗ | 0.26∗∗ | ||
| Body dissatisfaction | 0.68∗∗ | – | 0.68∗∗ |


 PDF
PDF ePub
ePub Citation
 Print
Print


 XML Download