

 PDF
PDF ePub
ePub Citation
 Print
Print


INTRODUCTION
Preference for sweet tastes is a biologically determined behavioral predisposition.1 Many children prefer sugary foods and sweetened drinks over healthier foods such as vegetables and whole grains. Sweetness delivers energy while enhancing physical and psychological satisfaction, and children prioritize sweetness over other factors when choosing food.2 Sweetness preference has contributed greatly to increased consumption of refined sugar and sweet food in technologically advanced modern societies. Consequently, children's sugar intake has increased to unprecedented levels.3 Although the World Health Organization (WHO) has called on countries to reduce sugar intake (to less than 10% of daily calorie intake), Korean children's sugar intake via processed food exceeded WHO recommendations in 2013. The Ministry of Food and Drug Safety reported that 10.6-11.0% of the calorie intake of Korean children and youth consists of sugar from processed food.4
Excessive mono- and disaccharide intake increases the incidence of cavities, obesity, and metabolic syndrome.56 Moreover, children who consume sweet food excessively tend to eat other unhealthy food such as instant noodles, bread, and ice cream.7 A previous study showed that adults who ate mainly vegetables, fruit, beans, and dairy products were less prone to developing metabolic syndrome in later years relative to those who consumed mainly soft drinks, meat, and noodles.8 Some researchers have suggested that further studies should be conducted to examine eating habits linked to sweetness preference throughout life, psychological factors related to children's sweet food consumption, and biological characteristics associated with sweetness preference.2 Therefore, to modify sweetness preference, which plays the most important role in food choice, and change diet patterns of overconsumption of sweets and habitual choice of sweet food, exploration of motivational factors influencing sweetness preference is essential.9
In terms of examining the behavioral aspects of sweet food consumption, the theory of planned behavior (TPB) is one of the most studied and valuable theories for explaining health-related behavior.10 According to the TPB, behavior is determined by behavioral intention (BI).11 As proposed in the TPB, BI to control sweetness preference or sweet food intake is significantly influenced by culture-specific norms, beliefs, and attitudes.1 Culture is one of the most influential factors in food choice; therefore, various cross-cultural studies have examined factors that play a predominant role in dietary habit improvement and health promotion in different countries.12131415 Rozin et al.12 addressed international differences in food selection criteria, and Lanfer et al.16 noted that children's taste preferences depended strongly on residence. Those results clearly identified the determinants that should be considered when developing nutritional interventions related to food choice and eating patterns by comparing differences among countries.
Sweetness preference has been commonly observed in all humans regardless of ethnicity or gender, and therefore cross-cultural comparison might elucidate the relationships between the variables influencing BI regarding sweetness preference and sweet food intake. To examine similarities and differences between the motivational factors influencing children's sweetness preference, we compared Korean and Japanese children in a limited area in each country. Comparing differences in motivational factors between countries could allow identification of the predominant factors for each country, whereas the comparison of similarities could illustrate common factors that play a role in both countries.17 We selected Japan for comparison for 2 reasons: Japan has the longest life expectancy of all Organization for Economic Co-operation and Development countries,18 and Japanese children's average sugar intake is within the WHO's recommended range.1920
Considering the alarming increase in the consumption of processed food containing added sugar, this study focused on processed sweet food and considered the findings of a previous study.21
As mentioned above, the current study aimed to compare sweetness preference and TPB variables between Korean and Japanese children. The results will provide meaningful variables that could be targeted in nutrition education interventions designed to overcome innate barriers and reduce sweetness preference and sweet food intake in Korean and Japanese children.
METHODS
Study design
This study was designed to compare motivational factors affecting sweetness preference, selected with reference to the TPB, in Korean and Japanese children. The survey variables were selected from those suggested in previous studies 101121 and expert advice, and defined following implementation of a preliminary test involving 20 Korean children. We did not consider the socioeconomic status of participants from either country. The study received ethical approval from the relevant committee at the Kagawa Nutrition University, Japan (No. 277).
Participants
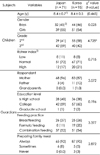
Participants were recruited using a letter that was sent home via their schools. The participants were 166 children (95 Korean, 71 Japanese) from the second and third grades of elementary school (mean age: approximately 8.4 ± 0.6 years) and recruited from one urban school in each country. While there was no significant difference in average age between the groups, the grade groups differed because of the different school entry ages in Korean and Japanese elementary schools (p < 0.05). No difference was observed in Rohrer index values ([kg/(cm)3] × 107; low: < 110, normal: 110~140, high: > 140) between the groups.
The children's guardians also participated in a survey and signed written informed consent. Most respondents were mothers, and there were no significant differences between any variables such as education level, feeding practice and preparing family meal in comparing the groups.
Measures
The survey was conducted between November 2013 and February 2014. A trained research assistant provided all children with personal guidance regarding completion of the sweetness preference test and survey questionnaire at school. Guardians completed the self-administered questionnaire at home.
The questionnaire and survey manual for the research assistants were written in English, translated into Korean and Japanese by fluent bilingual individuals, and back translated into English to verify the original translation's accuracy.
Sweetness preference test
Testing was performed in each school. Banana milk was used for the sweetness preference test. On the morning of testing, the experimenter prepared the banana-flavored milk using whole milk (4% fat), natural banana powder (100%), and refined sugar. Sugar and natural banana powder concentrations were calculated by comparing fresh banana juice and processed banana milk. The banana milk was prepared with 5 different sugar concentrations: 1.7%, 3.5%, 7%, 14%, and 28% weight-to-milk volume. The banana powder concentration (1% weight-to-milk volume) was applied to all samples equally. Each sugar concentration was prepared with reference to previous studies.2122 Preference for banana milk with varying sugar concentrations was assessed using a modified paired-comparison test based on previous studies.1321
Two samples with sugar concentrations of 3.5% and 14% were presented to each participant. They were asked to hold the solution in their mouths for 3 seconds and swallow it (if they did not wish to swallow it, they were permitted to spit it out). The children then identified their favorite solution. Children were also asked to indicate how they would feel if they were to drink the beverage every day, and rate the sweetness of the solution. If children chose the 3.5% sugar concentration in the first step, we presented them with samples with 1.7%, 3.5%, and 7% concentrations and asked them to choose their favorite. In the final step, children were instructed to rate their feelings and perceptions regarding the sweetness of the sample with the 28% sugar concentration. If children chose the 14% sample in the first step, they were presented with samples with 7%, 14%, and 28% concentrations, and the 1.7% sample was presented in the final step; the children then rated their feelings and perceptions regarding the sweetness of the sample.
Each sample consisted of approximately 10 ml of banana milk, which was presented in increasing concentration order for each test. Considering the ages of the participants, the study used emoticons and visual analog scales to record their feelings and sweetness ratings.
Questionnaire for children
Following the sweetness preference test, a trained research staff member administered a survey questionnaire consisting of 2 categories assessing 1) sweet food consumption frequency (number of times consumed per week), and 2) factors influencing sweetness preference (selected with reference to the TPB). Sweet food consumption frequency was used to indicate sweetness preference. The correlations between sweetness preference and the factors covered in the second part of the questionnaire were then examined.
The 12 food items mentioned in the frequency questionnaire consisted of processed sweet food items that were eaten frequently by children in both countries. These items were selected based on previous studies.72324 Sweet food consumption frequency was calculated by converting the children's responses to the question into average times per day. Frequency was assessed without attempting to quantify portion size. The scale responses were as follows: “Never, or less than once per week = 0 times/day”, “1~2 times per week = 0.21 times/day”, “3~4 times per week = 0.5 times/day”, “5~6 times per week = 0.78 times/day”, “once per day = 1 time/day”, and “2~3 times per day = 2.5 times/day”.
The TPB questionnaire component examined affective and cognitive attitudes, normative beliefs, motivation to comply, perceived behavioral control (PBC), and BI. Affective and cognitive attitudes were assessed using 2 (Cronbach's α: 0.751) and 4 (Cronbach's α: 0.67) items modified from previous studies,123 and responses were provided using a 5-point scale ranging from 1 (strongly disagree) to 5 (strongly agree).
Items assessing normative belief, motivation to comply, PBC, and BI were modified from a previous study.25 To measure normative belief and motivation to comply, we focused on parents as the most important people in the children's lives. Responses to the items concerning normative belief, motivation to comply, and PBC were provided using a 5-point scale ranging from 1 (not at all) to 5 (almost totally). Responses to the item measuring BI was measured using a 5-point scale ranging from 1 (strongly disagree) to 5 (strongly agree).
Questionnaire for guardians
The guardians' questionnaire consisted of variables based on the children's questionnaire. Affective attitudes reflected guardians' perceptions of their children's sweetness preference were measured using 2 items (Cronbach's α: 0.72). Cognitive attitudes reflecting guardians' awareness of the negative effects of sweets on their children were assessed using 5 items (Cronbach's α: 0.77), which were similar to those used for children.
Items measuring parenting practice, sweet foods accessibility at home (accessibility), and reward were modified from those used in previous studies.2126 Parenting practice was assessed in terms of permissiveness with respect to children's sweet food consumption, using 3 items (Cronbach's α: 0.54). Accessibility pertained to the extent of children's access to snacks or sweets and was examined via 2 questions (Cronbach's α: 0.84). Reward was measured using 3 items pertaining to the extent to which sweets were used as rewards for children (Cronbach's α: 0.70). Responses to all items were assessed using a 5-point scale. Higher scores for affective attitude, accessibility, and reward indicated greater positivity for sweetness and sweets, while higher scores in cognitive attitude indicated a more negative attitude. Higher parenting practice scores represented greater parental strictness.
Data analysis
All data were analyzed using SPSS 19.0 (IBM Corporation), and the significance level was set at p < 0.05. The questionnaires were tested for internal consistency and factorial validity (by calculating factor loadings). General items and sweetness preference were expressed in percentages, and the differences between groups were examined using chi-square tests. Data regarding feelings, sweetness, sweet food consumption frequency, and TPB-based variables were expressed as means and standard deviations. A t-test was performed to examine between group differences. The differences of feelings and sweetness among taste samples were compared using repeated measure ANOVA. Pearson's correlation analysis was performed to examine the relationships between TPB-based variables, sweetness preference, and sweet food consumption in each group. Stepwise multiple regression analysis was also conducted to reveal the motivational role of TPB-based variables on behavioral intention and sweetness preference.
RESULTS
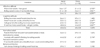
Sweetness preference test
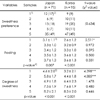
The banana milk with the highest sugar concentration was preferred by children from both countries, with no significant difference between groups (Table 2). Feelings tended to be more positive as sweetness increased, and scores representing feelings regarding the drink with the lowest sugar concentration differed significantly between the groups (p < 0.05). Perceived sweetness increased in response to the increase in sugar concentration, and perceived sweetness for drinks with sugar concentrations of 1.7% and 3.5% showed significant between-group differences (p < 0.001). Korean children tended to have more negative feelings and perceived lower sweetness for the solution with the lowest sugar concentration than Japanese children.
Sweets consumption frequency
Overall sweets consumption frequency differed significantly between the groups (Table 3), with significantly greater frequency observed in Japanese children (p < 0.05). Specifically, Japanese children consumed carbonated drinks (p < 0.01), cocoa drinks (p < 0.01), and candy (p < 0.05) significantly more often relative to Korean children, but there were no significant differences among other sub items.
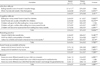
Comparison of children's questionnaire responses between Korean and Japan
Table 4 shows the comparisons between Korean and Japanese children's responses to each variable. Japanese children's scores for affective attitude and motivation to comply were significantly higher relative to those observed in Korean children (p < 0 .001 and p < 0 .05, respectively), whereas scores for cognitive attitude, normative beliefs, PBC, and BI did not differ significantly between the groups. However, there were significant differences between the groups (p < 0.01) in the cognitive variable sub items. The more negative sub items in Japanese children were “I will grow fat after eating too many sweet foods” (p < 0.01) and “If I eat too many sweet foods, I will get cavities” (p < 0.01), while the Korean children scored higher on “Sweet foods are usually unhealthy for me” (p < 0.01).
Comparison of guardians' questionnaire responses between Korea and Japan
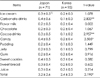
All variables differed significantly between the groups (Table 5). Japanese guardians' scores for affective attitude (p < 0.01), accessibility (p < 0.001), and reward (p < 0.001) were significantly higher relative to those of Korean guardians, whereas Korean guardians' scores for cognitive attitude (p < 0.001) and parenting practice (p < 0.001) were significantly higher relative to those of Japanese guardians.
Specifically, one of the 2 sub items for affective attitude was significantly different; specifically, Japanese guardians scored higher on “When my kids eat sweets, they feel good” (p < 0.001). In the cognitive variable sub items, Korean guardians scored higher on “Eating too many sweet foods is bad for children” (p < 0.001), “Sweet foods are usually unhealthy for children” (p < 0.001), “Children will get cavities after eating too many sweet foods” (p < 0.001), and “Children will become hyperactive from eating too many sweets” (p < 0.001). Regarding parenting practice, Korean guardians more strongly agreed that “I teach my child to like sweets less” (p < 0.001), “I limit my child's consumption of sweets” (p < 0.001); on the other hand, Japanese guardians scored higher on “I allow my child to eat sweets whenever he or she wants” (p < 0.01).
All sweet foods accessibility sub items were significantly different between the groups. Japanese guardians more strongly agreed that “I keep a lot of snack food in my house” (p < 0.001), and “I keep a lot of sweets in my house” (p < 0.001).
Two out of 3 reward sub items were significantly different between the groups. Japanese guardians scored higher on “Have you ever offered sweets to your child as a reward” (p < 0.001), and “Have you ever offered your child their favorite foods in exchange for good behavior” (p < 0.01).
Sweetness preference and motivational factors
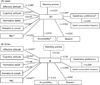
The results in Fig. 1 show the correlations between motivational factors and sweetness preference. In Japanese children, BI was positively correlated with cognitive attitude (r = 0.353, p < 0.01), motivation to comply (r = 0.267, p < 0 .05), and PBC (r = 0.283, p < 0 .05), and negatively correlated with affective attitude (r = −0.248, p < 0.05) and sweetness preference (r = −0.309, p < 0.01). Parenting practice was also positively correlated with BI (r = 0.253, p < 0 .05). In Korean children, BI was positively correlated with cognitive attitude (r = 0.250, p < 0.05) and PBC (r = 0.407, p < 0.01), and negatively correlated with affective attitude (r = −0.435, p < 0.01). Sweetness preference was positively correlated with sweet food consumption frequency (r = 0.208, p < 0.05).
Tables 6 and 7 show the results of stepwise multiple regression analysis, which examined the moderating role of motivational factors on BI and sweetness preference. In predicting behavioral intention of Japanese children, PBC, motivation to comply, and parenting practice were included, which explained 27.1% of the variance (p < 0.001). In predicting sweetness preference, BI showed a significant effect, which explained 6.1% of the variance (p < 0.05).
In Korean children, PBC, affective attitude, and parenting practice were included to predict BI, which explained 42.9% of variance (p < 0.001). In the prediction of sweetness preference, sweet consumption frequency showed a significant effect, which explained 3.1% of the variance (p < 0.05).
DISCUSSION
This study aimed to identify the motivational factors that should be considered when implementing interventions to control children's sweetness preference and sweet food intake. Surveys examining children's sweetness preference have reported that children prefer foods with high sugar content.162127 These results are consistent with the present findings, in which children showed a preference for the banana milk with the highest sugar concentration, and there was no difference between the groups. Satisfaction increased as sugar concentration increased, which implies that taste preference is a determinant factor in food preference, and taste is directly associated with sensory and emotional satisfaction.9 In previous studies, individuals with a strong preference for sweet tastes were likely to become dependent on sweet food consumption when experiencing stress, which increased their risk of overeating and obesity.22 Further, women with a preference for sugary food are prone to weight gain;28 therefore, health promotion for children should prevent them from developing a strong preference for sweet food.
When comparing sweet food consumption frequency between the groups, Korean children consumed sweets less frequently relative to Japanese children; in addition, sweet food consumption frequency was correlated with sweetness preference in Korean children, but not Japanese children. In this study, sugar intake from sweet food was not examined, but exposure to sweet food could be considered as an influential factor in sweetness preference in Korean children than Japanese children.
Comparison of the TPB-based variables showed similarities and differences between the groups. Korean and Japanese children had similar attitudes in terms of cognitive attitude (total score), normative beliefs, PBC, and BI toward sweet food; on the other hand, Korean children had lower affective attitudes and motivation to comply than Japanese children. Specifically, in cognitive attitude, Japanese children tended to agree more strongly, in which sweet food affected obesity and cavities, whereas Korean children were inclined to have a negative attitude regarding overall health aspects. Overall, both Korean and Japanese children strongly agreed that negative outcomes occur when eating too many sweet foods.
Children's dietary environments are strongly influenced by their parents.2930 The comparison between Korean and Japanese guardians' socio-demographic characteristics revealed strong similarities between groups, albeit for a limited number of items. However, a comparison of the factors related to sweetness preference revealed significant between-group differences for each variable. This result could reflect differences in cultural characteristics associated with sweet taste or sweet food between the groups. The comparison of guardians' responses showed that Korean guardians' attitudes toward sweet foods were more negative, and their control measures were stricter relative to those observed in Japanese guardians. Despite the difference in parenting practice, children's sweetness preference did not differ significantly between the groups. However, the results of multiple regression analysis showed a significant influence of parenting practice on BI.
When comparing TPB variables related to BI and sweetness preference in stepwise multiple regression analysis, PBC and parenting practice affected on BI in both groups, even though there was no correlation between parenting practice and Korean children in Pearson correlation analysis. Affective attitude was associated with BI only in Korean children. In contrast, motivation to comply affected on BI only in Japanese children. According to TPB, behavior is determined by BI, which is affected by attitude, subjective norm, and PBC.25 This result showed that parents' restrictive controlling might have a significant effect on children's behavior related to sweet food consumption. Previous studies reported the results of parents' role in children's dietary behavior.213132 Eisenberg et al.31 mentioned that parents who controlled access to fried snacks positively affected children's dietary behavior in terms of fat consumption. In contrast, Liem et al.21 reported that sugar consumption was not different for high- and low-restricted children and parents' restrictive rules appeared to have little influence on sugar consumption. Fisher and Birch 32 also suggested that restricting children's access to palatable foods within their eating environment is not effective. Although it is unclear whether restricting children's access to sweet food has a positive effect, the fact is that parents affect children's dietary environment. Further research examining these parental variables is required to inform interventions aimed at reducing sweetness preference or sweet food intake.
This study also showed that children's enhanced BI was accompanied not only by parenting practice but also PBC in both groups. PBC reflects self-efficacy and refers to individuals' perceptions of the degree to which they control their behavior.1 Bazillier et al.25 also suggested that perceived behavioral control is a very important determinant of healthy eating intentions for children even at a young age. The results demonstrated that PBC could influence children's dietary behavior, regardless of country. Children develop PBC of certain behaviors from their task performance, referred to as enactive mastery, vicarious experience, verbal persuasion, and their physiological reaction or state.33 The results of this study suggest that all these things have to be considered when designing interventions to improve children's PBC.
The results of multiple regression analysis showed a stronger correlation between sensory-affective evaluation of sweet food and BI in Korean children, relative to that observed in Japanese children, and a stronger association between BI and motivation to comply in Japanese children, relative to that observed in Korean children. Affective attitudes referred to psychological reactions driven by direct experiences such as emotion, pleasure, and sensory-affective responses to particular dietary behavior or food.1 Motivation to comply reflects an individual's willingness regarding whether they should adopt a behavior.25 These results demonstrated differences that could prove to be meaningful variables when developing nutritional interventions in each country.
In prediction of sweetness preference, BI emerged as a significant predictor in Japanese children. In contrast, sweets consumption frequency was a significant predictor in Korean children. There was no interaction between BI and sweetness preference in Korean children. This finding is contrary to a previous study based on TPB for dietary behavior.10 Because of the small sample size in the present study, this finding needs to be replicated by further research using a systematic, random sample of the entire study population in Korea and Japan.
An important feature of this study is that it is the first application, to our knowledge, of the use of TPB-based variables to compare sweetness preference between Korean and Japanese children. Nevertheless, the study was subject to several limitations. For instance, it involved small numbers of Korean and Japanese children from particular regions; therefore, as mentioned above, this study should be replicate in a lager sample. This study did not collect data on sugar intake amount from each subject to verify whether the subjects were within the normal range in terms of average sugar intake. Despite these limitations, the results concerning motivational factors could be useful in the development of nutritional interventions aimed at controlling children's sweetness preference and sweet food intake.
In conclusion, PBC and parenting practice were important variables in predicting BI in both groups. In predicting sweetness preference, BI had a significant effect in Japanese children, whereas sweets consumption frequency was the greatest contributor in Korean children. The study showed similarities and differences in motivational factors that could be considered when developing nutrition education programs for Korean and Japanese children.
SUMMARY
This study provided information regarding motivational factors affecting sweetness preference in Korean and Japanese children. Although BI influenced Japanese children's sweetness preference, it did not exert a significant influence in Korean children. In other words, the fact that the level of Japanese children's sugar intake is not alarming could have been influenced by their PBC, motivation to comply, which is a tendency to comply with the guidelines or rules provided by parents or other adults. The result showed that the sweetness preference of Korean children might be associated with sweets consumption frequency. Therefore, Korean children's restrictive access to sweet food may have a positive effect in terms of reducing sweetness preference and sweets consumption. In addition, the effect of affective attitude on Korean children's choice of sweet food was stronger relative to that observed in Japanese children; therefore, rather than attempting to control joy or other positive emotions associated with sweet food consumption, nutrition educators should teach Korean children to control themselves and consume appropriate amounts of sweet food within the recommended limits. Moreover, although Korean parents were stricter in their restriction of sweet food intake relative to Japanese parents, there was no difference in sweetness preference; in contrast, parents practice influenced behavioral intention in both groups of children. Therefore, parents in both countries should establish proper rules to control their children's consumption of sweet food, to ensure that it remains within appropriate ranges. This study also showed that children's enhanced BI was accompanied by PBC in both groups. Although a larger survey is required to allow generalization of the study results, the results concerning motivational factors could be useful in the development of nutritional interventions aimed at controlling children's sweetness preference and sweet food intake.


 XML Download