Journal List > J Nutr Health > v.50(5) > 1081526

Yoon, Lee, Kim, Shim, and Hwang: Development of processed food database using Korea National Health and Nutrition Examination Survey data∗

Abstract

Purpose

The objective of this study was to develop a processed foods database (DB) for estimation of processed food intake in the Korean population using data from the Korea National Health and Nutrition Survey (KNHANES). Methods: Analytical values of processed foods were collected from food composition tables of national institutions (Development Institute, Rural Development Administration), the US Department of Agriculture, and previously reported scientific journals. Missing or unavailable values were substituted, calculated, or imputed. The nutrient data covered 14 nutrients, including energy, protein, carbohydrates, fat, calcium, phosphorus, iron, sodium, potassium, vitamin A, thiamin, riboflavin, niacin, and vitamin C. The processed food DB covered a total of 4,858 food items used in the KNHANES. Each analytical value per food item was selected systematically based on the priority criteria of data sources. Results: Level 0 DB was developed based on a list of 8,785 registered processed foods with recipes of ready-to-eat processed foods, one food composition table published by the national institution, and nutrition facts obtained directly from manufacturers or indirectly via web search. Level 1 DB included information of 14 nutrients, and missing or unavailable values were substituted, calculated, or imputed at level 2. Level 3 DB evaluated the newly constructed nutrient DB for processed foods using the 2013 KNHANES. Mean intakes of total food and processed food were 1,551.4 g (males 1,761.8 g, females 1,340.8 g) and 129.4 g (males 169.9 g, females 88.8 g), respectively. Processed foods contributed to nutrient intakes from 5.0% (fiber) to 12.3% (protein) in the Korean population. Conclusion: The newly developed nutrient DB for processed foods contributes to accurate estimation of nutrient intakes in the Korean population. Consistent and regular update and quality control of the DB is needed to obtain accurate estimation of usual intakes using data from the KNHANES.

References

1. Ford ES, Dietz WH. Trends in energy intake among adults in the United States: findings from NHANES. Am J Clin Nutr. 2013; 97(4):848–853.
2. Whitton C, Nicholson SK, Roberts C, Prynne CJ, Pot GK, Olson A, Fitt E, Cole D, Teucher B, Bates B, Henderson H, Pigott S, Deverill C, Swan G, Stephen AM. National diet and nutrition survey: UK food consumption and nutrient intakes from the first year of the rolling programme and comparisons with previous surveys. Br J Nutr. 2011; 106(12):1899–1914.
crossref
3. Ministry of Health and Welfare, Korea Centers for Disease Control and Prevention. Korea Health Statistics 2011: Korea National Health and Nutrition Examination Survey (KNHANES V-2). Cheongwon: Korea Centers for Disease Control and Prevention;2012.
4. Lim AH, Choi SY, Shim JE, Hwang JY, Moon HK, Kim K. Development of dietary behavior items available in Korea National Health and Nutrition Examination Survey. J Nutr Health. 2015; 48(5):407–418.
crossref
5. Sohn S. Factors related to the health related quality of life in elderly women. Korean J Women Health Nurs. 2009; 15(2):99–107.
crossref
6. Weaver CM, Dwyer J, Fulgoni VL 3rd, King JC, Leveille GA, MacDonald RS, Ordovas J, Schnakenberg D. Processed foods: contributions to nutrition. Am J Clin Nutr. 2014; 99(6):1525–1542.
crossref
7. The University of Auckland (NZ). NUTRITRACK: a processed foods database to promote the health of New Zealanders [Internet]. Auckland: The University of Auckland;2014. [cited 2016 Jan 19]. Available from:. http://www.foodandhealth.auckland.ac.nz/en/about/news/news-2014/2014/05/nutritrack.html.
8. Yun S, Kim HJ, Oh K. Trends in energy intake among Korean adults, 1998–2015: results from the Korea National Health and Nutrition Examination Survey. Nutr Res Pract. 2017; 11(2):147–154.
crossref
9. United States Development of Agriculture, Agricultural Research Service. National nutrient database for standard reference, release 25 [Internet]. Washington D.C.: United States Development of Agriculture;2013. [cited 2015 Aug 19]. Available from:. http://www.ars.usda.gov/Services/docs.htm?docid=23635. www.ars.usda.gov/Services/docs.htm?docid=23635.
10. Ministry of Education. Culture, Sports, Science, and Technology (JP). Standard tables of food composition in. Japan: fifth revised and enlarged edition. Tokyo: Ministry of Education, Culture, Sports, Science, and Technology; 2005. Sports, Science, and Technology;2005.
11. European Food Information Resource. Food composition database [Internet]. Brussels: European Food Information Resource;2017. [cited 2017 Mar 11]. Available from:. http://www.eurofir.org/food-information/food-composition-databases-2/.information/food-composition-databases-2/.
12. Health Canada. Food and nutrition [Internet]. Ottawa: Health Canada;2016. [cited 2016 Jun 3]. Available from:. https://www.canada.ca/en/health-canada/services/food-nutrition/healthy-eating/nutrient-data/canadian-nutrient-file-2015-download-files.html.
13. Kim SY, Kang MS, Kim SN, Kim JB, Cho YS, Park HJ, Kim JH. Food composition tables and national information network for food nutrition in Korea. Food Sci Ind. 2011; 44(1):);. 2–20.
14. Yoon MO, Kim K, Hwang JY, Lee HS, Son TY, Moon HK, Shim JE. Development of a fatty acids database using the Korea National Health and Nutrition Examination Survey data. J Nutr Health. 2014; 47(6):435–442.
crossref
15. Ministry of Agriculture, Food and Rural Affairs; Korea Agro-Fisheries & Food Trade Corporation. 2016 development of processed food standard system: 2nd. Naju: Korea Agro-Fisheries & Food Trade Corporation;2016.
16. Ministry of Food and Drug Safety (KR). Korean food standards codex. Cheongju: Ministry of Food and Drug Safety;2015.
17. Ministry of Health and Welfare, Korea Centers for Disease Control and Prevention. Korea Health Statistics 2014: Korea National Health and Nutrition Examination Survey (KNHANES VI-2) [Internet]. Cheongju: Korea Centers for Disease Control and Prevention;2015. [cited 2015 Aug 8]. Available from:. https://knhanes. cdc.go.kr/knhanes/sub04/sub04_03.do?classType=7.
18. Ministry of Food and Drug Safety (KR). Manufacturer's report data for processed food. Cheongju: Ministry of Food and Drug Safety;2015.
19. Korea Centers for Disease Control and Prevention. Ingredients ratio of prepared foods data. Cheongwon: Korea Centers for Disease Control and Prevention;2013.
20. Rural Development Administration (KR). Food composition table. 8th revision edition. Suwon: Rural Development Administration;2011.
21. The Korean Nutrition Society. Nutrient database of food [Internet]. Seoul: The Korean Nutrition Society;; [cited 2015 Aug 10]. Available from:. http://www.kns.or.kr/Center/FoodDB.asp.
22. Nongshim (KR). Nonshim brand [Internet]. Seoul: Nonshim;; [cited 2015 Jul 20]. Available from:. http://brand.nongshim.com/main/index.
23. Samyang Foods (KR). Samyang brand [Internet]. Seoul: Samyang Foods;; [cited 2015 Aug 20]. Available from:. http://www.samyang-food.co.kr/kor/brand/samyangRamen.do.
24. Maeil Dairies (KR). Maeil Dairies products [Internet]. Seoul: Maeil Dairies;[cited 2015 Sep 15]. Available from:. http://www.maeil.com/brand/list_brand1.jsp?cate_0.
25. Namyang Dairy Products (KR). Namyang Dairy Products brand [Internet]. Seoul: Namyang Dairy Products;; [cited 2015 Aug 10]. Available from:. http://company.namyangi.com/product/product. asp?cd=5. asp?cd=5.
26. Seoulmilk (KR). Seoulmilk product information [Internet]. Seoul: Seoulmilk;; [cited 2015 Jul 8]. Available from:. http://www.seoulmilk.co.kr/enterprise/product/product_list.sm.
27. Lotte Chilsung Beverage (KR). Lotte Chilsung Beverage brand [Internet]. Seoul: Lotte Chilsung Beverage;; [cited 2015 Aug 22]. Available from:. http://company.lottechilsung.co.kr/product/new_product.jsp?nPos=0301. product.jsp?nPos=0301.
28. Dongsuh Foods (KR). Dongsuh Foods products [Internet]. Seoul: Dongsuh Foods;; [cited 2015 Aug 10]. Available from:. https://www.dongsuh.co.kr/2017/02_products/02_product_list.asp. www.dongsuh.co.kr/2017/02_products/02_product_list.asp.
29. Crown (KR). Crown products [Internet]. Seoul: Crown;[cited 2015 Aug 10]. Available from:. http://www.crown.co.kr/product/pList.asp?catecode=1478063272.
30. Hai Tai Htb (KR). Hai Tai Htb products [Internet]. Seoul: Hai Tai Htb;; [cited 2015 Sep 20]. Available from:. http://www.htb.co.kr/Product_info/Product_info_13.jsp. Product_info/Product_info_13.jsp.
31. Sajo (KR). Sajo product Korea's representative brand [Internet]. Seoul: Sajo;[cited 2015 Aug 8]. Available from:. http://hp.sajo.co.kr/product/brand_list.asp.
32. Pulmuone (KR). Pulmuone products [Internet]. Seoul: Pulmuone;; [cited 2015 Aug 15]. Available from:. http://www.pulmuoneshop.co.kr/goods/displayList.do?headCateCd=005. co.kr/goods/displayList.do?headCateCd=005.
33. Home Plus (KR). Home Plus products [Internet]. Seoul: Home Plus;; [cited 2015 Jul 10]. Available from:. http://www.homeplus.co.kr/app.product.GoodDetail.ghs?comm=usr.detail&good_id=000048798&extends_id=naver&service_cd=56010.
34. Naver Storefarm (KR). Cn food products [Internet]. Seoul: Naver Storefarm;; [cited 2015 Aug 20]. Available from:. http://storefarmnaver.com/cnfood/products/320138360.
35. Interpark Shopping (KR). Processed Food products [Internet]. Seoul: Interpark Shopping;; [cited 2015 Aug 22]. Available from:. http://shopping.interpark.com/display/main.do?dispNo=. 001760&smid1=gnb&smid2=003&smid3=1.
36. Lottemart (KR). Lottemart products [Internet]. Seoul: Lottemart;; [cited 2015 Aug 22]. Available from:. http://www.lottemart.com/product/ProductDetail.do?CategoryID=C001001700010004&ProductCD=L000000002021&socialSeq=&koostYn=N.
37. Ahuja JK, Perloff BP. Quality control procedures for the USDA Food and Nutrient Database for Dietary Studies nutrient values. J Food Compost Anal. 2008; 21:S119–S124.
crossref

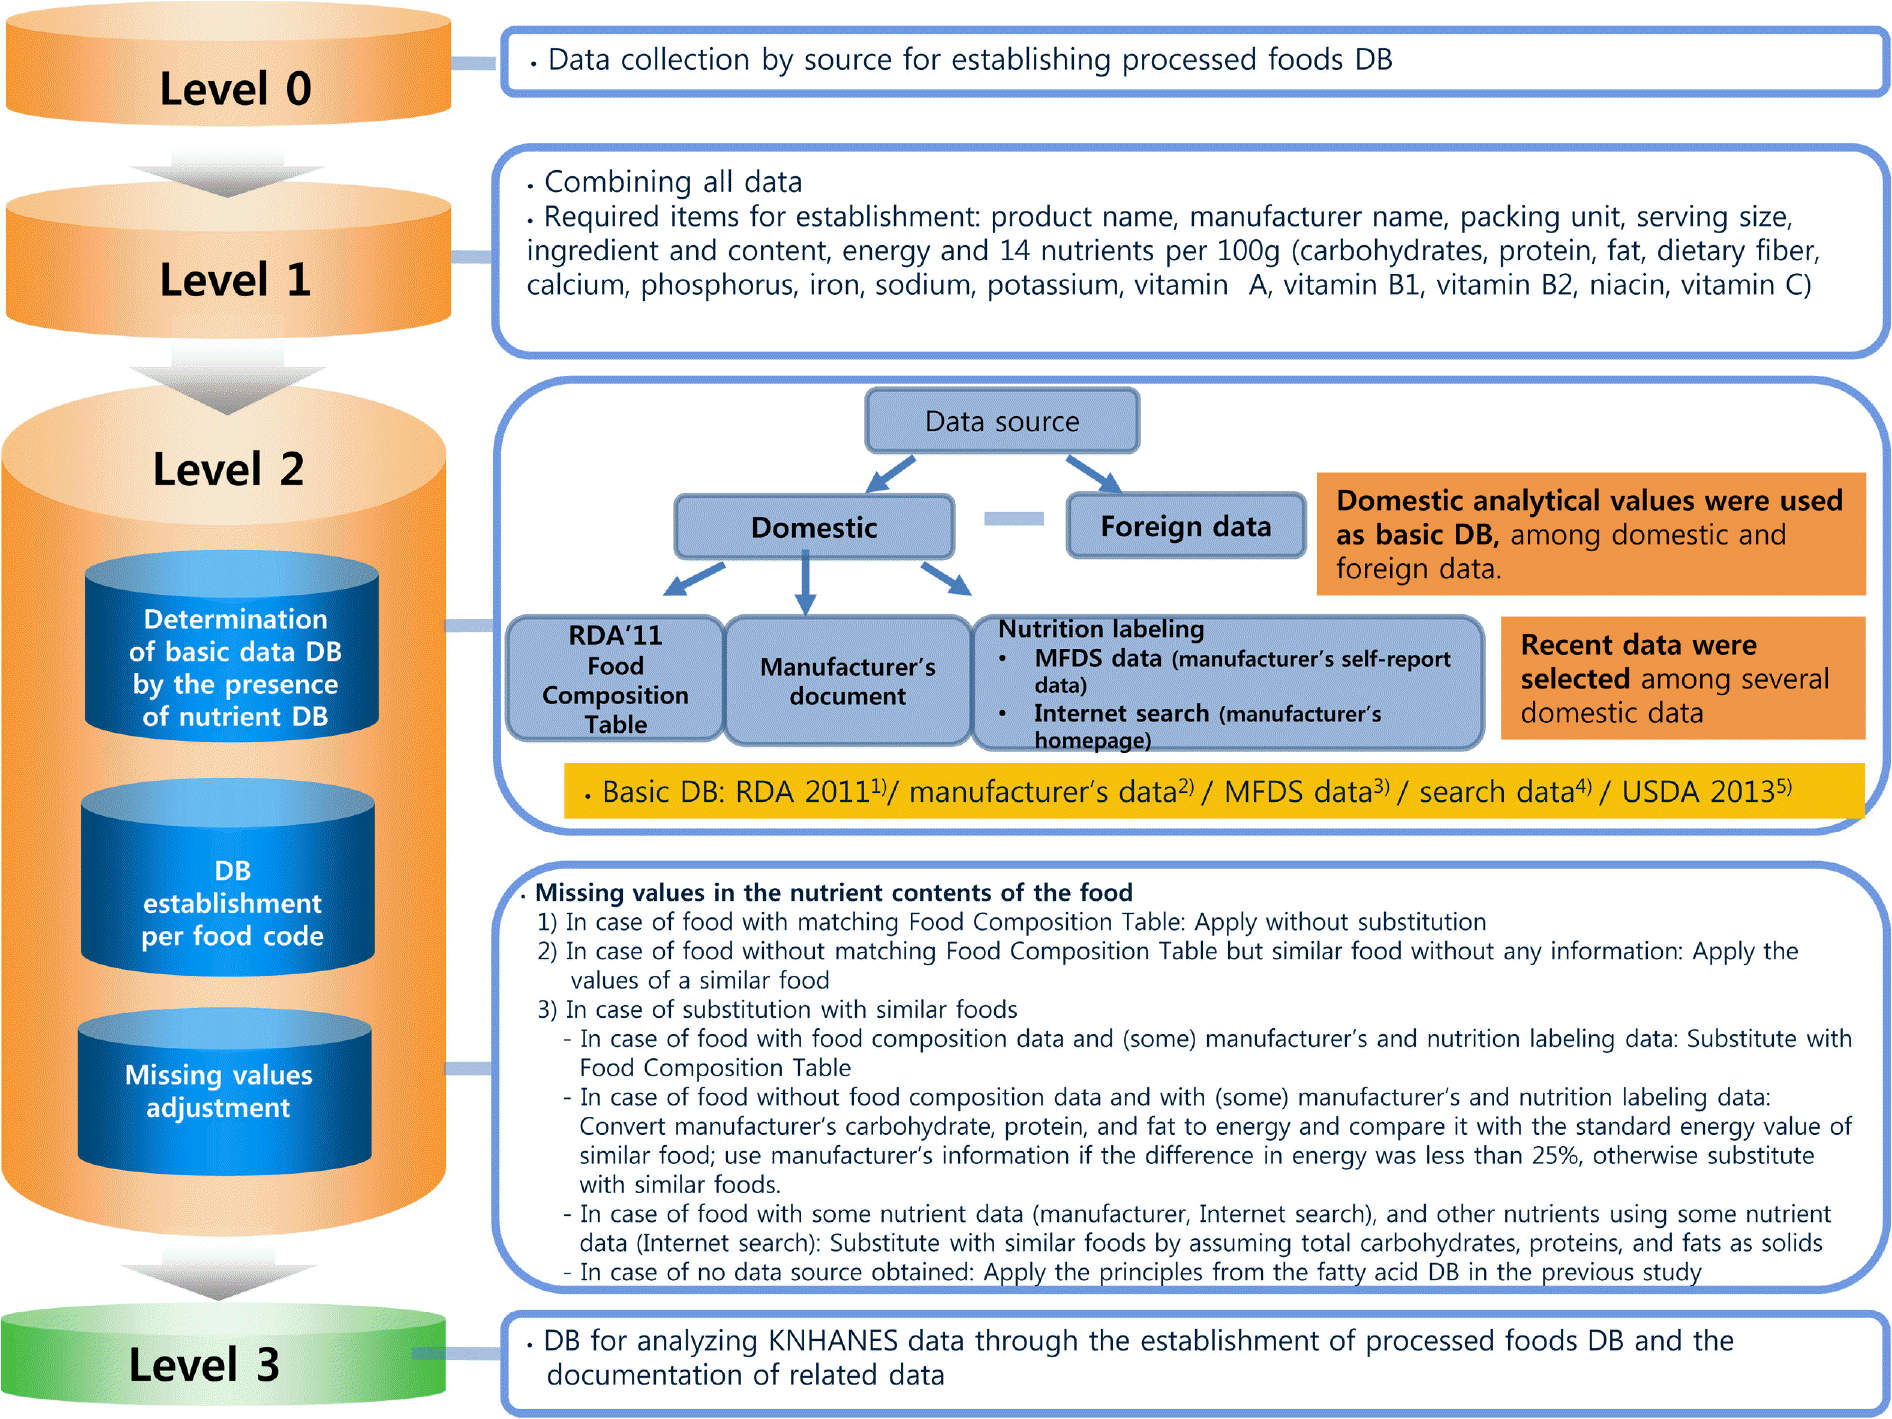
Fig. 1.
Overall flow of development of processed food database 1) Rural Development Administration. 8th revision Food Composition Table, 2011, 2) Manufacturer-provided document, 3) Manufacturer's report data, 4) Internet search data, 2015, 5) USDA National Nutrient Database for Standard Reference, Release 26, 2013
jnh-50-504f1.tif
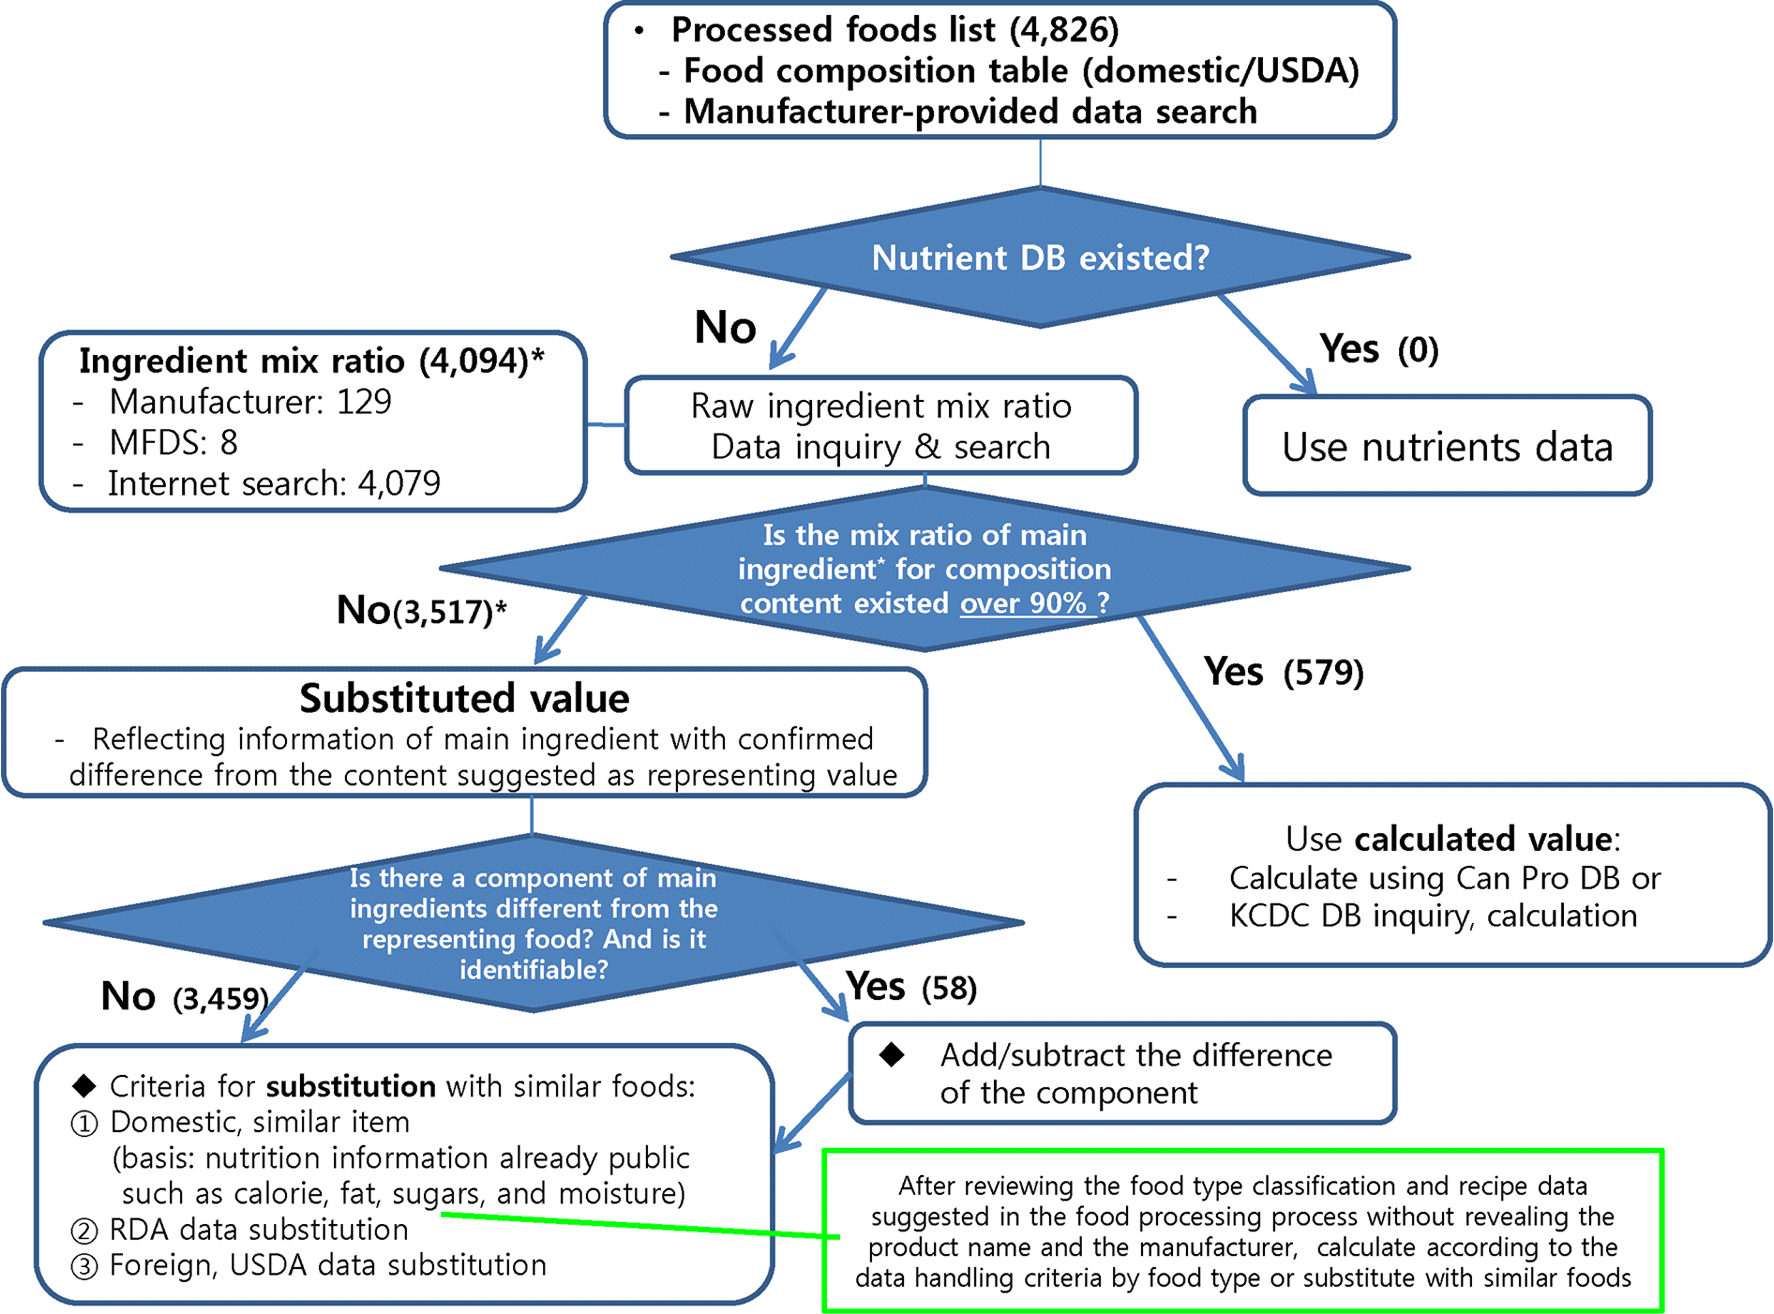
Fig. 2.
Principles of data substitutions for a newly constructed processed food DB
jnh-50-504f2.tif
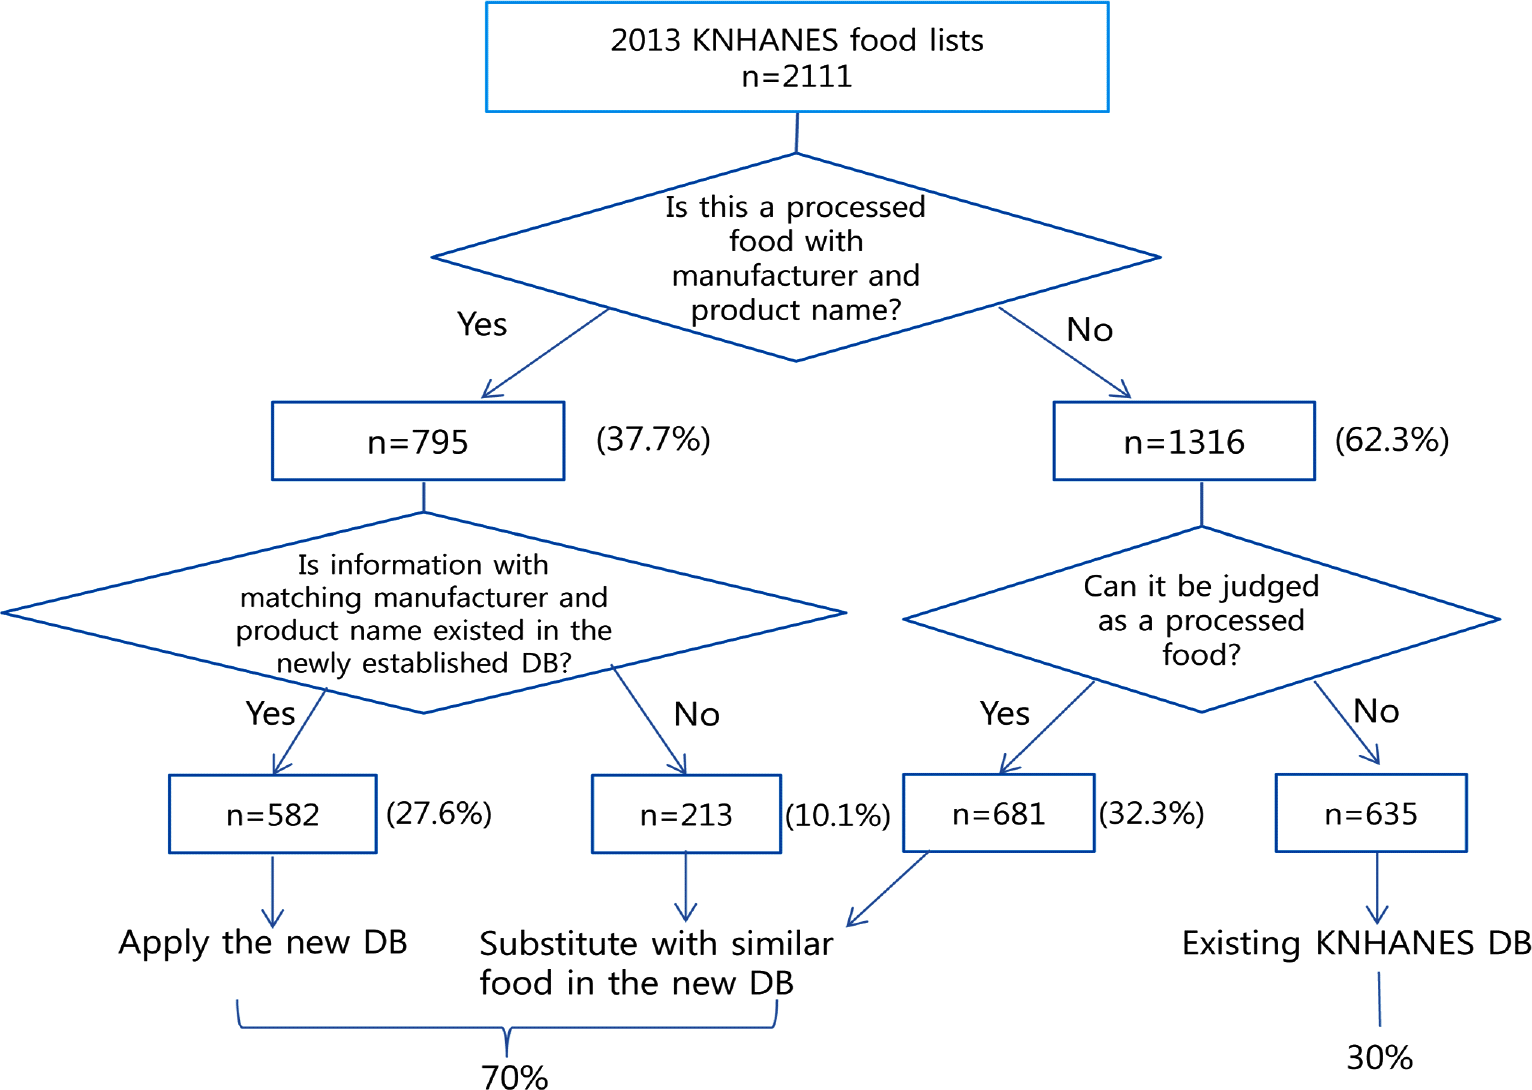
Fig. 3.
Data matching 2013 KNHANES with a new constructed processed food DB
jnh-50-504f3.tif
Table 1.
Characteristics of data sources
Data sources Characteristics of data
RDA (2011)1) Analytical values (energy, 14 nutrients)
MFDS (2015)2) Values directly reported by manufacturers (8,785 item; 5 nutrients)
USDA (2013)3) Analytical values (energy, 14 nutrients)
CDC (2013)4) Ingredients ratio of prepared foods (no nutrient information)
The Korean Nutrition Society (2012)5) Analytical, calculated, or imputed values
Internet search or manufacturer-provided documents (2015)6) 5 nutrients values of nutrition fact labels

1) Rural Development Administration. 8th revision Food Composition Table, 2011 2) Ministry of Food and Drug Safety, Department o Food and Nutrition Safety Policy. Manufacturer's report data for processed food [document]. 2015 3) United States Development o Agriculture, USDA National Nutrient Database for Standard Reference, Release 26, 2013 4) Centers for Disease Control & Prevention Division of Health and Nutrition Survey. Ingredients ratio of prepared foods data (2013) 5) The Korean Nutrition Society. Nutrient data base of food (2012) 6) Internet search data or Manufacturer-provided documentations (2015)

Table 2.
Resources and limitations of collected data
Type Resource Nutrients No. of foods Limitations
Nutrition fact labels MFDS Nutrition Safety Policy Division 5 including energy ※Trans fats and sugars are included among a total of 9 kinds. 4641) • Need of data substitution for nutrients which are not included in the nutrition fact labels.
Food Composition Table, 9th ed. NIAS Functional Food and Nutrition Division Over 15 including energy 1502) (list checked) • Under review. Unavailability for public use during the study periods.
Food Composition Table, 8th ed. NIAS Functional Food and Nutrition Division Over 15 including energy 1823) 433) • Limited items. Need of matching for data substitution
Nutrition fact labels Manufacturers 5 including energy ※Trans fats and sugars are included among a total of 9 kinds. 6054) • Including online searching data, indirectly from manufacturers • Need of data substitution for nutrients which are not included in the nutrition fact labels.

1) Target lists 4,826 cases vs MFDS 8,785 cases after exact product-name matching. 2) 150+α (α: for cereals, some of USDA data used) 3) Target lists 4,826 cases vs RDA 8

th Food Composition Table (182 cases – matching with cooked/processed food): matching, 0; similar, 43. 4) Direct acquisition from manufacturers: 605 cases (a total of 15 nutrients including energy: 29 cases)

Table 3.
Data calculability according to food types
Food type Incalculable data Calculable data
Cookies   O
Breads, rice cakes, dumplings   O
Cocoa products or chocolates   O
Jam   O
Sugars O  
Meat products, fish meat products   O
Soybean curd and starch jelly O  
Oils and fats O  
Noodles   O
Tea O (leached tea/ liquid tea) O (solid tea)
Coffee O  
  O  
Milk & dairy products (milk, yogurt/ fermented milk, O (other milk)
  cheese, butter)  
Beverages O  
Food for special dietary uses   O
Soy sauce, salted seafood, dressing/ mayonnaise O  
Seasoned foods (seasonings, sauces) O  
Food glazed with soy sauce or other seasoning O  
Liquor, dried fish O  
Others O  
Table 4.
Number of food according to data processing method for the Level 2 DB
Division No∗ Food Composition Table Nutrient labeling (internet) Manufacturer's documents Alternative Method Domestic/ Foreign Data Source No. of Foods
Matching Similar  
Analytical value #1 (not related) (not related) Among the 2011 8th RDA Food Composition Table (analytical data), no matched manufacturer and food name after matching with 182 cooked/processed foods 0 (150 + α)
                RDA ('11)1) 30
                RDA ('10)1), KHIDI ('05)3) 29
                RDA ('09)1) 9
                RDA ('03)1) 10
            Among the 8th RDA Food Composition Table, similar with nutrition labeling and manufacturer's documents (replacement by food composition table) Korea RDA ('01)1), KHIDI ('05)3) 26
              RDA ('00)1) 25
  #2   RDA ('91∼94)1) 176
              MFDS ('96)2) 21
                MFDS ('91)2) 10
                KNS ('97)4), KNIH ('88)5) 8
              Japan   16
              USDA   17
                subtotal 377
                RDA ('11)1) 3
                RDA ('10)1) 2
Substitution based on data effectiveness           Among the 8th RDA Food Composition Table, similar with manufacturer's documents (replacement by food composition table) Korea RDA ('96,'01,'02)1), KHIDI ('05)3) 4
#3 ×   MFDS ('96)2) 5
              KFRI ('96)6) 5
              Japan   8
              USDA   2
                subtotal 29
                RDA ('11) 1) 119
                RDA ('10)1) 161
                RDA ('86-'99)1) 410
                KNS ('97)4) 23
            Among the 8th RDA Food Composition Table, similar with nutrition labeling only (replacement by food composition table) Korea KNIH ('77,'80,'83,'88,‘06)5) 105
            MFDS (‘96, ‘11)2) 322
    #4 ×   KFRI ('96)6) 237
                KNS ('95)7) 7
                NFRDI ('82, '09)8) 90
              Japan   101
              USDA   107
                subtotal 1,682
Table 4.
Number of food according to data processing method for the Level 2 DB (continued)
Division No∗ Food Composition Table Nutrient labeling (internet) Manufacturer's documents Alternative Method Domestic/ Foreign Data Source No. of Foods
Matching Similar
                RDA ('11)1) 131
                RDA ('10)1) 210
                RDA ('93∼'99)1) 389
            Among the 8th RDA Food Composition Table, similar without both nutrition labeling and manufacturer's documents (replacement by food composition table) Korea NFRDI ('82, '09, 10)8) MFDS ('96, '11)2) 149 364
Substitution #5 × ×   KNS ('95)7) KFRI ('96)6) KNS ('97)4), KNIH ('88)5) 1 115 47
              Japan   98
              USDA   40
                subtotal 1,544
            Foods with 90–100% mix ratio among DB target lists (with nutrition labeling + manufacturer's documents + composition table)   Caculation 508
Calculation #6   subtotal 508
                 
            Among manufacturer providing data, number of foods with nutrition labeling but without similar food in the RDA Food Composition Table Korea Manufacturer 110
  #7 × ×   subtotal 110
              Korea   615
  #8 × × × number of foods with only internet nutrition labeling Japan USDA   16 20
                subtotal 651
            Additional information data from manufacturers Korea Manufacturer 35
Current data use of substitution #9 × × × Additional information data from manufacturers   subtotal 35$
                RDA ('11)1) 78
                RDA ('10)1) 111
                RDA ('93-'99)1) 52
              Korea MFDS ('96, '11)2) 29
  #10 × × × × No data source obtained (placement by most similar food)   KNS ('95)7) KNS ('97)4), KNIH ('88)5) KFRI ('96)6) 4 13 13
              Japan   60
              USDA   70
                subtotal 430
                Total 4,858

1) Rural Development Administration. Food Composition Table, 1991–1994, 1996, 1999, 2001, 2002, 2003, 2010, 2011 2) Ministry of Food and Drug Safety, Department of Food and Nutrition Safety Policy. 1991, 1996, 2011 3) Korea Health Industry Development Institute. Development of nutrient database. Seoul: Korea Health Industry Development Institute; 2005 4) The Korean Nutrition Society, Ministry of Education of Policy Research Project for Foodservice, 1997 5) Korea National Institute of Health, The Report of National Institute of Health, 1977, 1980, 1983, 1988, 2006 6) Korea Food Research Institute / Basic DB Supplement Project for Implementation and Processing of Results of KNHANES, 1996 7) The Korean Nutrition Society, Recommended dietary allowances for Koreans, 1995 8) National Fisheries Research & Development Institue, Chemical composition of marine productS ('1982), Composition of Fisheries Products in KoreA (2009, 2010) ∗Handling methods by data securing status.

2015 9

th revision (150 cases+α) lists, α: some cereal data of the USDA. Asked for information, but not secured.

Foods with 90 ∼ 100% mix ratio among DB target lists: 508 (with nutrition labeling + manufacturer's documents+composition table), 103 (with nutrition labeling, without composition table), 94 (with nutrition labeling, without composition table, without manufacturer's documents). Total number of foods except the relevant foods: A total of 4,858 to be established.

$ Additional information data from manufacturers: 32 (added to the established list of 4,826: a total of 4,858 lists)+manufacturer's document only: 3

Table 5.
Estimation of processed food intakes in the Korean population using the KNHANES VI-1 (2013)
Variables Total (n = 6,805)   Men (n = 2,966)   Women (n = 3,839)
Mean SE 95% CL Mean SE 95% CL Mean SE 95% CL
Age (yrs) 39.1 0.5 38.2 40.0 38.0 0.5 37.1 39.0 40.2 0.6 39.1 41.3
Nutrients of total intakes                      
Food intake (g) 1,551.4 17.3 1,517.3 1,585.5 1,761.8 25.8 1,710.8 1,812.8 1,340.8 15.0 1,311.3 1,370.4
Total Energy (kcal) 2,079.0 18.5 2,042.5 2,115.4 2,394.4 26.5 2,342.1 2,446.8 1,763.2 18.1 1,727.5 1,798.9
Carbohydrate (g) 313.2 2.4 308.6 317.9 347.0 3.2 340.6 353.4 279.4 2.7 274.2 284.7
Protein (g) 73.8 0.9 72.0 75.5 85.9 1.3 83.4 88.4 61.6 0.9 59.9 63.4
Fat (g) 47.6 0.8 46.0 49.2 55.2 1.2 52.9 57.5 39.9 0.8 38.4 41.5
Dietary fiber (g) 7.2 0.1 7.0 7.4 7.8 0.2 7.4 8.1 6.6 0.1 6.3 6.9
Exclusively with matching food1) )                    
Nutrients of processed food intakes                    
Food intake (g) 129.4 4.0 121.4 137.3 169.9 6.7 156.6 183.2 88.8 3.4 82.1 95.4
Total Energy (kcal) 183.5 6.6 170.5 196.5 235.8 9.1 217.8 253.7 131.1 7.6 116.2 146.1
Carbohydrate (g) 21.6 0.9 19.9 23.3 25.4 1.1 23.3 27.6 17.8 1.1 15.7 20.0
Protein (g) 3.5 0.1 3.2 3.7 4.0 0.2 3.6 4.3 3.0 0.1 2.7 3.2
Fat (g) 5.5 0.2 5.0 5.9 6.3 0.3 5.8 6.9 4.6 0.3 4.0 5.2
Dietary fiber (g) 0.4 0.0 0.3 0.4 0.5 0.0 0.4 0.5 0.3 0.0 0.3 0.4
Percentage of processed food intakes (%)                  
Food intake (%) 8.2 0.2 7.8 8.7 9.4 0.3 8.8 10.0 7.1 0.3 6.6 7.6
Total Energy (%) 8.5 0.2 8.1 8.9 9.6 0.3 9.1 10.2 7.4 0.3 6.9 7.9
Carbohydrate (%) 5.5 0.2 5.1 5.8 5.4 0.2 5.0 5.7 5.5 0.2 5.1 6.0
Protein (%) 12.3 0.3 11.7 12.9 12.6 0.4 11.9 13.4 12.0 0.4 11.3 12.8
Fat (%) 6.9 0.2 6.6 7.3 7.4 0.2 7.0 7.9 6.5 0.3 6.0 7.0
Dietary fiber (%) 5.0 0.3 4.5 5.5 5.4 0.3 4.8 5.9 4.7 0.4 4.0 5.3
With matching food and similar food2)                    
Nutrients of processed food intakes                    
Food intake (g) 505.8 8.7 488.5 523.0 632.6 14.5 604.0 661.2 378.8 7.4 364.1 393.5
Total Energy (kcal) 639.4 10.2 619.3 659.5 769.4 13.8 742.2 796.6 509.3 12.0 485.6 533.0
Carbohydrate (g) 83.9 1.5 81.0 86.8 95.2 1.9 91.5 99.0 72.5 1.9 68.8 76.2
Protein (g) 19.7 0.3 19.0 20.4 22.8 0.6 21.7 23.8 16.6 0.4 15.9 17.3
Fat (g) 16.9 0.4 16.1 17.6 18.7 0.4 17.8 19.6 15.0 0.5 14.1 16.0
Dietary fiber (g) 1.1 0.0 1.0 1.1 1.3 0.0 1.2 1.4 0.9 0.0 0.8 1.0
Percentage of processed food intakes (%)                  
Food intake (%) 30.8 0.4 30.1 31.5 33.3 0.5 32.4 34.2 28.2 0.5 27.3 29.1
Total Energy (%) 29.5 0.3 28.8 30.1 30.9 0.4 30.2 31.6 28.1 0.4 27.2 28.9
Carbohydrate (%) 27.0 0.3 26.4 27.7 26.7 0.4 25.9 27.6 27.3 0.4 26.5 28.1
Protein (%) 36.7 0.4 35.8 37.6 35.9 0.5 34.8 37.0 37.5 0.5 36.5 38.6
Fat (%) 26.5 0.3 25.8 27.1 27.1 0.4 26.3 27.8 25.8 0.4 25.0 26.7
Dietary fiber (%) 16.1 0.3 15.4 16.8 17.0 0.4 16.2 17.9 15.2 0.5 14.3 16.1

1) Matching food: manufacturer and food name were matched based on analytical data from the 2011 8th RDA Food Composition Table. 2) Similar food: manufacturer and food name were not matched but classified as similar foods.

Table 6.
Comparison of Nutrient Intakes of the Korean population using the KNHANES VI-1 (2013) before and after using a newly constructed processed food DB
Variables Total (n = 6,805)   Men (n = 2,966)   Women (n = 3,839)
Before After diff1) t p2) Before After diff1) t p Before After diff1) t p
Mean SE Mean SE Mean SE Mean SE Mean SE Mean SE
Age (yrs) 39.1 0.5 39.1 0.5       38.0 0.5 38.0 0.5       40.2 0.6 40.2 0.6      
Food intake (g) 505.8 8.7 505.8 8.7       632.6 14.5 632.6 14.5       378.8 7.4 378.8 7.4      
Total Energy (kcal) 639.4 10.2 814.2 16.6 +173.9 –21.37 < 0.001 769.4 13.8 985.8 25.5 +215.7 –15.35 < 0.001 509.3 12.0 642.2 16.5 +132.0 –15.04 < 0.001
Carbohydrate (g) 83.9 1.5 113.2 2.5 +29.2 –19.54 < 0.001 95.2 1.9 136.3 4.0 +41.0 –15.53 < 0.001 72.5 1.9 90.1 2.4 +17.5 –11.97 < 0.001
Protein (g) 19.7 0.3 30.1 0.6 +10.4 –20.13 < 0.001 22.8 0.6 38.3 1.1 +15.5 –16.01 < 0.001 16.6 0.4 21.8 0.5 +5.2 –12.98 < 0.001
Fat (g) 16.9 0.4 23.8 0.9 +6.9 –11.84 < 0.001 18.7 0.4 27.2 1.4 +8.5 –8.59 < 0.001 15.0 0.5 20.4 0.9 +5.4 –8.18 < 0.001
Dietary fiber (g) 1.1 0.0 4.5 0.2 +3.4 –25.45 < 0.001 1.3 0.0 5.1 0.2 +3.9 –15.80 < 0.001 0.9 0.0 3.8 0.2 +2.9 –22.44 < 0.001
Ca (mg) 200.4 4.2 189.4 4.4 –11.4 4.85 < 0.001 217.0 5.0 216.2 7.7 –1.0 1.61 0.107 183.8 5.0 162.5 4.1 –21.7 5.45 < 0.001
P (mg) 339.2 6.4 432.0 12.7 +92.3 –7.67 < 0.001 383.4 7.8 571.8 23.4 +188.0 –9.24 < 0.001 295.0 7.0 292.1 8.2 –3.5 0.56 < 0.001
Fe (mg) 3.9 0.1 6.5 0.3 +2.6 –11.14 < 0.001 4.7 0.2 9.0 0.6 +4.3 –9.58 < 0.001 3.1 0.1 4.0 0.2 +0.9 –5.99 0.572
Na (mg) 2,527.6 42.6 3,006.2 52.2 +479.1 –14.75 < 0.001 2,976.0 67.8 3,520.8 92.5 +544.0 –15.59 < 0.001 2,078.8 40.7 2,071.4 111.3 –7.4 –15.11 < 0.001
K (mg) 647.4 9.5 897.0 27.2 +248.7 –11.77 < 0.001 741.9 11.3 1,173.2 49.0 +430.5 –11.0 < 0.001 552.8 13.1 620.3 18.6 +66.5 –4.54 < 0.001
Vitamin A (RE) 188.7 9.9 305.3 19.5 +116.3 –7.49 < 0.001 210.0 15.0 316.1 26.2 +105.9 –4.42 < 0.001 167.3 11.9 294.5 22.0 +126.8 –6.47 < 0.001
Vitamin B1 (mg) 0.5 0.0 0.9 0.0 +0.4 –13.89 < 0.001 0.6 0.0 1.2 0.1 +0.6 –12.45 < 0.001 0.4 0.0 0.6 0.0 +0.2 –6.46 < 0.001
Vitamin B2 (mg) 0.5 0.0 0.8 0.0 +0.3 –13.68 < 0.001 0.5 0.0 1.0 0.0 +0.4 –10.62 < 0.001 0.4 0.0 0.6 0.0 +0.2 –8.99 < 0.001
Niacin (mg) 3.7 0.1 5.9 0.2 +2.3 –17.18 < 0.001 4.3 0.1 8.1 0.3 +3.9 –16.38 < 0.001 3.0 0.1 3.7 0.1 +0.6 –6.44 < 0.001
Vitamin C (mg) 9.5 0.3 11.3 0.6 +1.8 –3.65 0.0003 10.4 0.5 13.2 1.0 +2.8 –3.56 0.0004 8.6 0.4 9.4 0.5 +0.8 –1.32 0.185

1) Differences between before and after using a newly constructed processed food database 2) Paired t-test

TOOLS
Similar articles