Journal List > J Nutr Health > v.50(4) > 1081515

Kim, Hei, Jun, Wie, Shin, Hong, and Joung: Estimated flavonoid intakes according to socioeconomic status of Korean adults based on the Korea National Health and Nutrition Examination Survey 2007∼2012∗

Abstract

Purpose

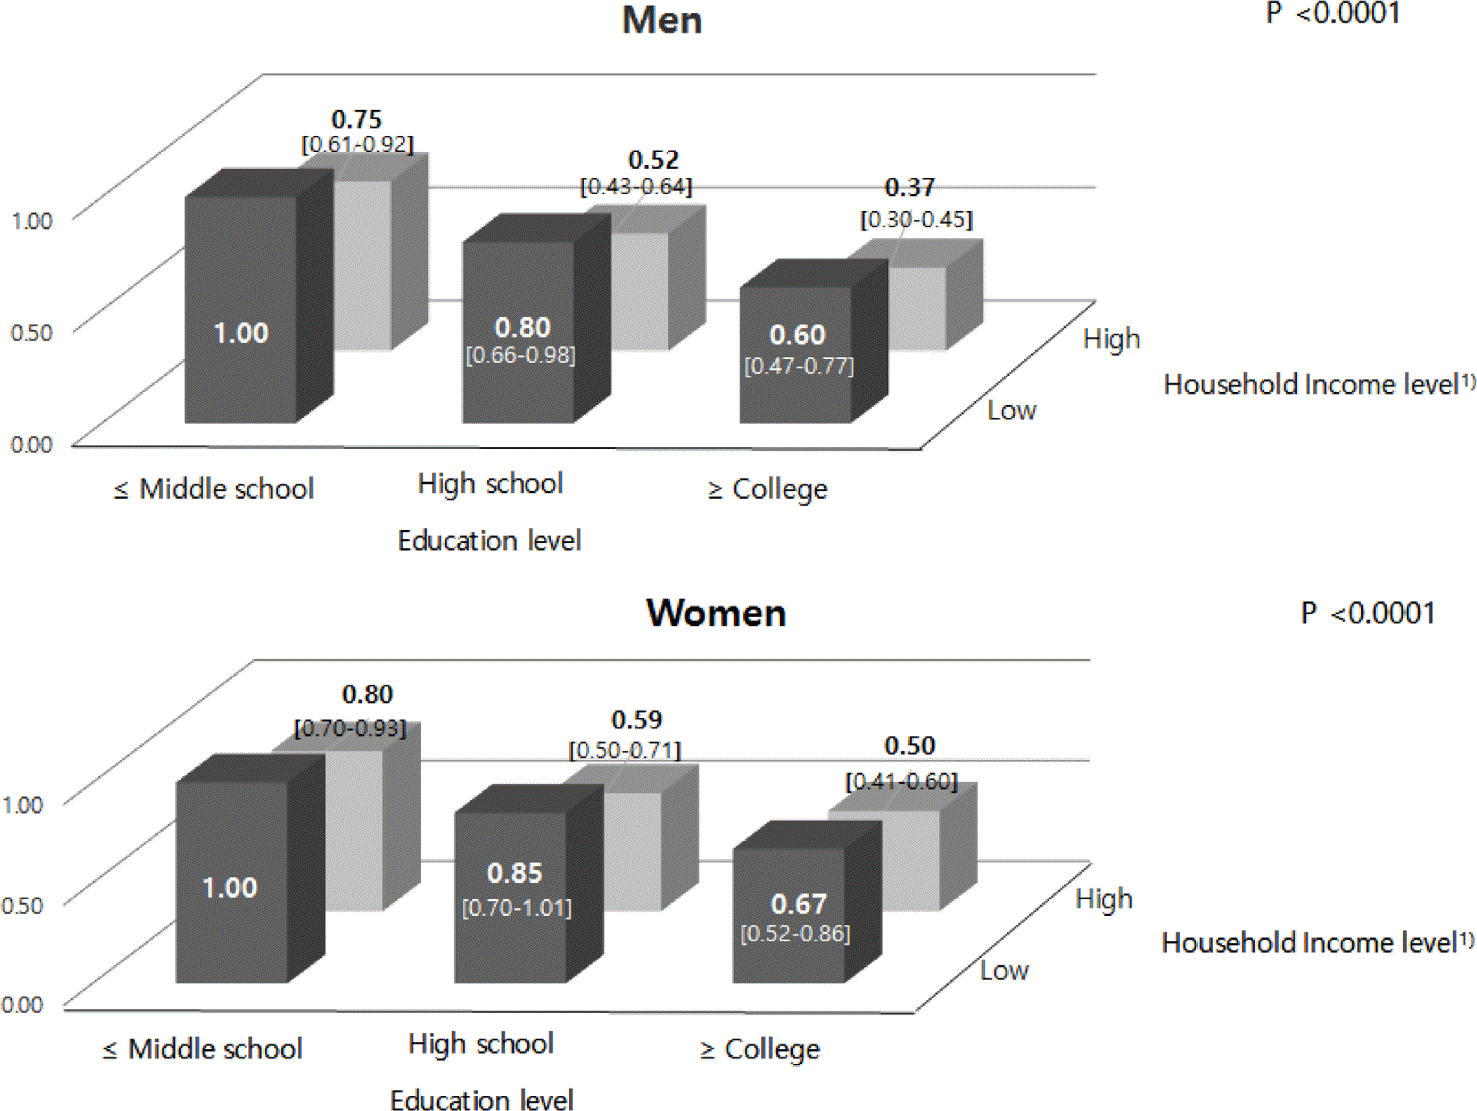
The purpose of this study was to estimate the dietary flavonoid intakes of Korean adults according to socioeconomic status. Methods: Using data from the 2007∼2012 Korea National Health and Nutrition Examination Survey, a total of 31,112 subjects aged over 19 years were included in this study. We estimated individuals' daily intakes of total flavonoids and seven flavonoid subclasses, including flavonols, flavones, flavanones, flavan-3-ols, anthocyanins, proanthocyanidin, and isoflavones, by linking food consumption data with the flavonoids database for commonly consumed Korean foods. We compared intakes of flavonoids according to the levels of household income and education. Results: Average dietary flavonoid intakes of the study subjects were 321.8 mg/d in men and 308.3 mg/d in women. Daily flavonoid intakes were positively associated with household income level (p < 0.0001) and education level (p < 0.0001). The subjects in the highest household income and highest education level group (OR 0.37, 95% CI 0.30∼0.45, p < 0.0001 in men, OR 0.50, 95% CI 0.41∼0.60, p < 0.0001 in women) had a lower likelihood of having low total flavonoid intake (less than 25 percentile) compared to the lowest household income and lowest education level group. The food group that contributed to total flavonoid intake with the biggest difference between the lowest and highest groups for both household income level and education level was beverages. Conclusion: This study shows that socioeconomic status was positively associated with flavonoid intake in a representative Korean population. Further research is needed to analyze the association of flavonoid intake with health outcomes according to socioeconomic status such as household income and education level.

References

1. James WP, Nelson M, Ralph A, Leather S. Socioeconomic determinants of health. The contribution of nutrition to inequalities in health. BMJ. 1997; 314(7093):1545–1549.
crossref
2. Smith GD, Brunner E. Socioeconomic differentials in health: the role of nutrition. Proc Nutr Soc. 1997; 56(1A):75–90.
crossref
3. Janssen I, Boyce WF, Simpson K, Pickett W. Influence of individual-and area-level measures of socioeconomic status on obesity, unhealthy eating, and physical inactivity in Canadian adolescents. Am J Clin Nutr. 2006; 83(1):139–145.
4. Giskes K, Turrell G, Patterson C, Newman B. Socioeconomic differences among Australian adults in consumption of fruit and vegetables and intakes of vitamins A, C and folate. J Hum Nutr Diet. 2002; 15(5):375–385.
crossref
5. Mishra G, Ball K, Arbuckle J, Crawford D. Dietary patterns of Australian adults and their association with socioeconomic status: results from the 1995 National Nutrition Survey. Eur J Clin Nutr. 2002; 56(7):687–693.
crossref
6. Kaplan GA, Keil JE. Socioeconomic factors and cardiovascular disease: a review of the literature. Circulation. 1993; 88(4 Pt 1):1973–1998.
crossref
7. Kim BH, Lee JW, Lee Y, Lee HS, Jang YA, Kim CI. Food and nutrient consumption patterns of the Korean adult population by income level: 2001 National Health and Nutrition Survey. Korean J Community Nutr. 2005; 10(6):952–962.
8. Jun S, Hong E, Joung H. Flavonoid intake according to food security in Korean adults: based on the Korea National Health and Nutrition Examination Survey 2007–2012. J Nutr Health. 2015; 48(6):507–518.
crossref
9. Kim SA, Jun S, Joung H. Estimated dietary intake of vitamin A in Korean adults: based on the Korea National Health and Nutrition Examination Survey 2007–2012. J Nutr Health. 2016; 49(4):258–268.
crossref
10. Bravo L. Polyphenols: chemistry, dietary sources, metabolism, and nutritional significance. Nutr Rev. 1998; 56(11):317–333.
crossref
11. Hertog MG, Feskens EJ, Hollman PC, Katan MB, Kromhout D. Dietary antioxidant flavonoids and risk of coronary heart disease: the Zutphen elderly study. Lancet. 1993; 342(8878):1007–1011.
crossref
12. Wang H, Cao G, Prior RL. Total antioxidant capacity of fruits. J Agric Food Chem. 1996; 44(3):701–705.
crossref
13. Byers T, Perry G. Dietary carotenes, vitamin C, and vitamin E as protective antioxidants in human cancers. Annu Rev Nutr. 1992; 12(1):139–159.
crossref
14. Stephens NG, Parsons A, Schofield PM, Kelly F, Cheeseman K, Mitchinson MJ. Randomised controlled trial of vitamin E in patients with coronary disease: Cambridge Heart Antioxidant Study (CHAOS). Lancet. 1996; 347(9004):781–786.
crossref
15. Marlett JA, McBurney MI, Slavin JL. American Dietetic Association. Position of the American Dietetic Association: health implications of dietary fiber. J Am Diet Assoc. 2002; 102(7):993–1000.
16. Ames BN, Shigenaga MK, Hagen TM. Oxidants, antioxidants, and the degenerative diseases of aging. Proc Natl Acad Sci U S A. 1993; 90(17):7915–7922.
crossref
17. Chun OK, Kim DO, Smith N, Schroeder D, Han JT, Lee CY. Daily consumption of phenolics and total antioxidant capacity from fruit and vegetables in the American diet. J Sci Food Agric. 2005; 85(10):1715–1724.
crossref
18. Chun OK, Chung SJ, Song WO. Estimated dietary flavonoid intake and major food sources of U.S. adults. J Nutr. 2007; 137(5):1244–1252.
crossref
19. Middleton E Jr, Kandaswami C, Theoharides TC. The effects of plant flavonoids on mammalian cells: implications for inflammation, heart disease, and cancer. Pharmacol Rev. 2000; 52(4):673–751.
20. Graf BA, Milbury PE, Blumberg JB. Flavonols, flavones, flava-nones, and human health: epidemiological evidence. J Med Food. 2005; 8(3):281–290.
crossref
21. Kris-Etherton PM, Keen CL. Evidence that the antioxidant flavonoids in tea and cocoa are beneficial for cardiovascular health. Curr Opin Lipidol. 2002; 13(1):41–49.
crossref
22. Rein D, Paglieroni TG, Wun T, Pearson DA, Schmitz HH, Gosselin R, Keen CL. Cocoa inhibits platelet activation and function. Am J Clin Nutr. 2000; 72(1):30–35.
crossref
23. Yao LH, Jiang YM, Shi J, Tomás-Barberán FA, Datta N, Singanu-song R, Chen SS. Flavonoids in food and their health benefits. Plant Foods Hum Nutr. 2004; 59(3):113–122.
crossref
24. Ministry of Health and Welfare, Korea Centers for Disease Control and Prevention. Korea Health Statistics 2007: Korea National Health and Nutrition Examination Survey (KNHANES IV-1) [Internet]. Cheongwon: Korea Centers for Disease Control and Prevention;2008. [cited 2016 Nov 20]. Available from:. https://knhanes.cdc.go.kr/knhanes/index.do.knhanes.cdc.go.kr/knhanes/index.do.
25. Ministry of Health and Welfare, Korea Centers for Disease Control and Prevention. Korea Health Statistics 2008: Korea National Health and Nutrition Examination Survey (KNHANES IV-2) [Internet]. Cheongwon: Korea Centers for Disease Control and Prevention;2009. [cited 2016 Nov 20]. Available from:. https://knhanes.cdc.go.kr/knhanes/index.do.
26. Ministry of Health and Welfare, Korea Centers for Disease Control and Prevention.Korea Health Statistics 2009: Korea National Health and Nutrition Examination Survey (KNHANES IV-3) [Internet]. Cheongwon: Korea Centers for Disease Control and Prevention;2010. [cited 2016 Nov 20]. Available from:. https://knhanes.cdc.go.kr/knhanes/index.do.
27. Ministry of Health and Welfare, Korea Centers for Disease Control and Prevention. Korea Health Statistics 2010: Korea National Health and Nutrition Examination Survey (KNHANES V-1) [Internet]. Cheongwon: Korea Centers for Disease Control and Prevention;2011. [cited 2016 Nov 20]. Available from:. https://knhanes.cdc.go.kr/knhanes/index.do.
28. Ministry of Health and Welfare, Korea Centers for Disease Control and Prevention. Korea Health Statistics 2011: Korea National Health and Nutrition Examination Survey (KNHANES V-2) [Internet]. Cheongwon: Korea Centers for Disease Control and Prevention;2012. [cited 2016 Nov 20]. Available from:. https://knhanes.cdc.go.kr/knhanes/index.do.
29. Ministry of Health and Welfare, Korea Centers for Disease Control and Prevention. Korea Health Statistics 2012: Korea National Health and Nutrition Examination Survey (KNHANES V-3) [Internet]. Cheongwon: Korea Centers for Disease Control and Prevention;2013. [cited 2016 Nov 20]. Available from:. https://knhanes.cdc.go.kr/knhanes/index.do.
30. Jun S, Shin S, Joung H. Estimation of dietary flavonoid intake and major food sources of Korean adults. Br J Nutr. 2016; 115(3):480–489.
crossref
31. Casey PH, Szeto K, Lensing S, Bogle M, Weber J. Children in food-insufficient, low-income families: prevalence, health, and nutrition status. Arch Pediatr Adolesc Med. 2001; 155(4):508–514.
32. Ball K, Crawford D, Mishra G. Socioeconomic inequalities in women's fruit and vegetable intakes: a multilevel study of individual, social and environmental mediators. Public Health Nutr. 2006; 9(5):623–630.
crossref
33. Kirkpatrick S, Tarasuk V. The relationship between low income and household food expenditure patterns in Canada. Public Health Nutr. 2003; 6(6):589–597.
crossref
34. Dibsdall LA, Lambert N, Bobbin RF, Frewer LJ. Low-income consumers'attitudes and behaviour towards access, availability and motivation to eat fruit and vegetables. Public Health Nutr. 2003; 6(2):159–168.
35. Steptoe A, Perkins-Porras L, McKay C, Rink E, Hilton S, Cappuccio FP. Psychological factors associated with fruit and vegetable intake and with biomarkers in adults from a low-income neighborhood. Health Psychol. 2003; 22(2):148–155.
crossref
36. Arai Y, Watanabe S, Kimira M, Shimoi K, Mochizuki R, Kinae N. Dietary intakes of flavonols, flavones and isoflavones by Japanese women and the inverse correlation between quercetin intake and plasma LDL cholesterol concentration. J Nutr. 2000; 130(9):2243–2250.
crossref
37. Lee HS, Cho YH, Park J, Shin HR, Sung MK. Dietary intake of phytonutrients in relation to fruit and vegetable consumption in Korea. J Acad Nutr Diet. 2013; 113(9):1194–1199.
crossref
38. Cho SW, Kim JH, Lee SM, Lee SM, Choi EJ, Jeong J, Park YK. Effect of 8-week nutrition counseling to increase phytochemical rich fruit and vegetable consumption in Korean breast cancer patients: a randomized controlled trial. Clin Nutr Res. 2014; 3(1):39–47.
crossref
39. Park S, Ham JO, Lee BK. Effects of total vitamin A, vitamin C, and fruit intake on risk for metabolic syndrome in Korean women and men. Nutrition. 2015; 31(1):111–118.
crossref
40. Ham D, Jun S, Kang M, Shin S, Wie GA, Baik HW, Joung H. Association of total dietary antioxidant capacity with oxidative stress and metabolic markers among patients with metabolic syndrome. J Nutr Health. 2017; 50(3):246–256.
crossref

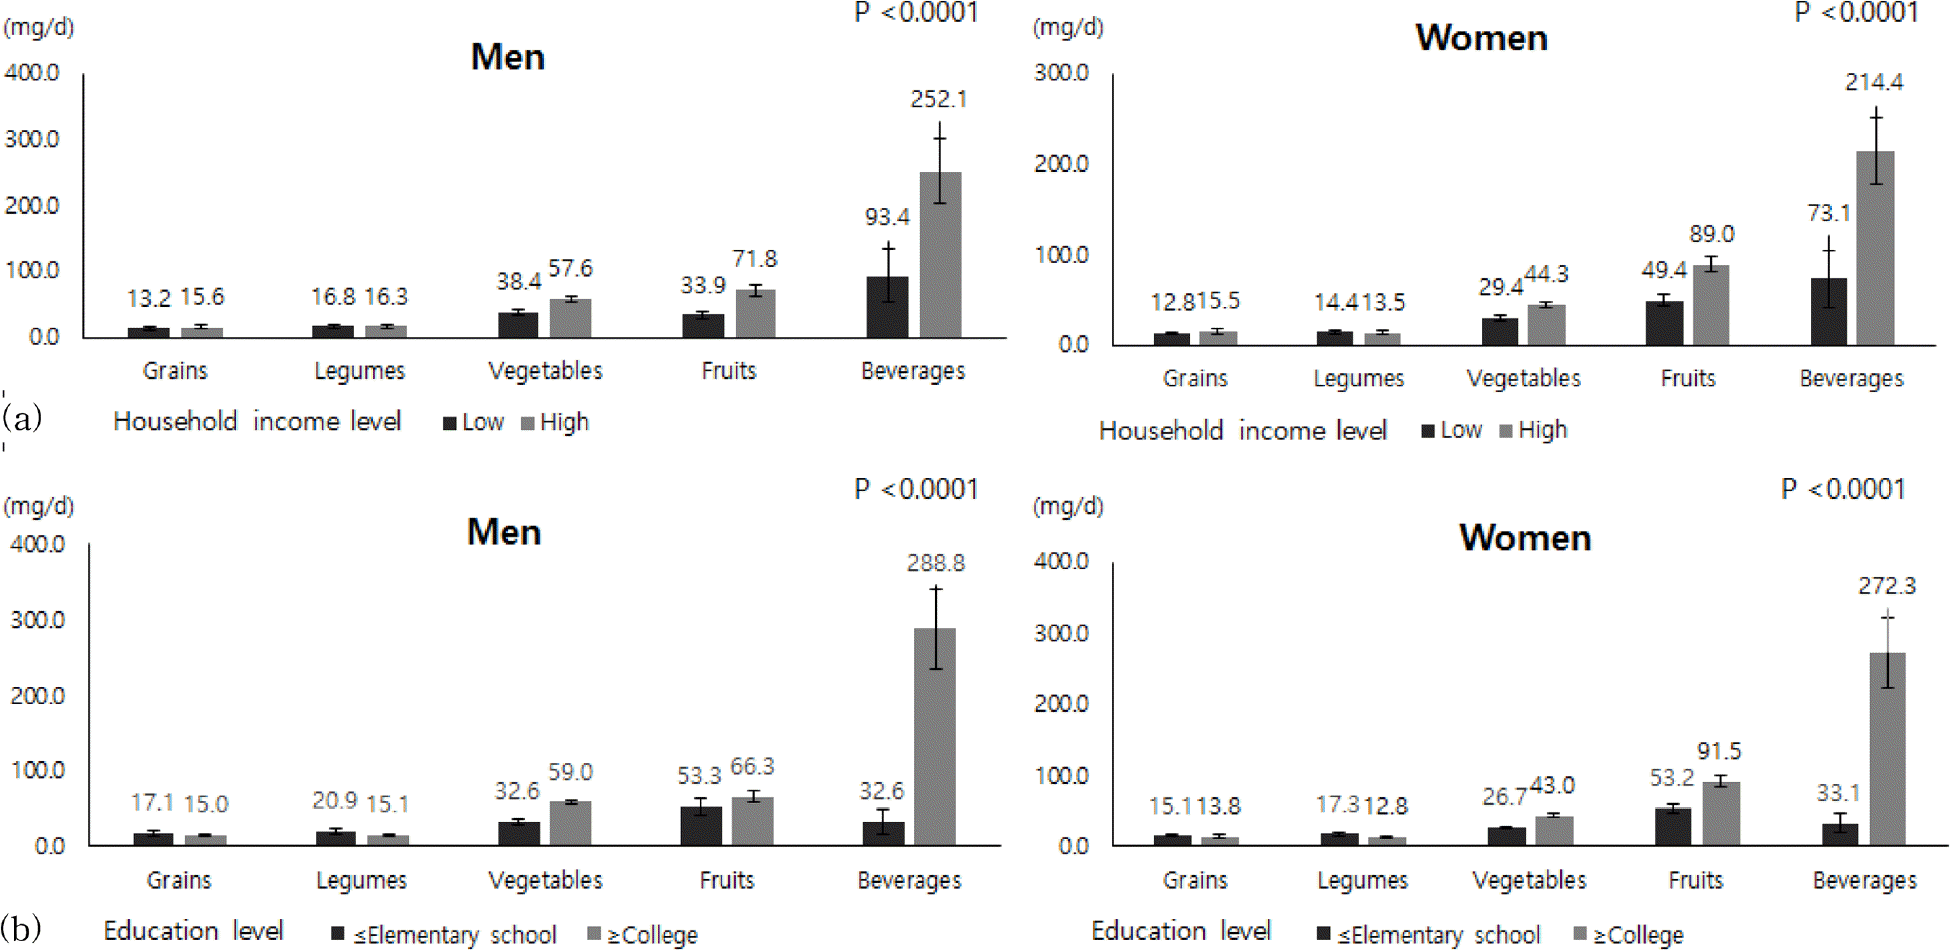
Fig. 1.
Total flavonoid intake from food groups according to the household income and education level by sex: (a) Total flavonoid intake by household income level, (b) Total flavonoid intake by education level. ∗Adjusted for age, obesity, current smoking status, alcohol drinking status and energy intake.
jnh-50-391f1.tif
Fig. 2.
The odds ratio for daily total flavonoid intake < 25 percentile in study population according to the household income and education level by sex. ∗Adjusted for age, obesity, current smoking status, alcohol drinking status and energy intake. 1) ‘Low' meant first and second quartile, and ‘High' meant third and fourth quartile.
jnh-50-391f2.tif
Table 1.
Total flavonoid intakes according to characteristics of study subjects by sex
  Men Women
  n % Total flavonoid intake (mg/d) n % Total flavonoid intake (mg/d)
  Mean SE1) p value2) Mean SE1) p value2)
Total 12,4140 321.8 11.9 18,698 308.3 10.6
Age (yr)                    
19 ∼ 29 1,367 11.0 275.0 22.0   2,143 11.5 397.5 31.9  
30 ∼ 49 50 ∼ 64 4,327 3,443 34.9 27.7 385.5 300.1 21.5 17.5 < 0.0001 7,161 4,867 38.3 26.0 349.5 278.4 17.8 13.5 < 0.0001
65+ 3,277 26.4 202.6 12.9   4,527 24.2 140.2 8.7  
Household income3)                    
Low 2,464 20.2 208.4 20.3   4,049 22.1 188.4 16.8  
Middle-low Middle-high 3,126 3,307 25.6 27.1 267.1 323.9 25.3 19.0 < 0.0001 4,623 4,815 25.2 26.3 289.7 322.2 24.1 18.3 < 0.0001
High 3,302 27.1 429.1 25.4   4,845 26.4 390.4 19.3  
Education                    
≤ Elementary school 2,533 20.9 168.1 10.4   6,188 33.8 154.5 7.6  
Middle school High school 1,560 4,296 12.9 35.4 207.9 281.5 14.8 15.9 < 0.0001 1,877 5,820 10.2 31.8 271.9 326.1 21.8 19.0 < 0.0001
≥ College 3,745 30.9 459.3 27.3   4,437 24.2 449.5 25.2  
Regular alcohol consumption4)                    
Yes No 8,631 3,486 71.2 28.8 324.2 319.3 14.4 20.3 0.8384 6,691 11,601 36.6 63.4 305.8 313.4 14.5 14.7 0.7058
Current smoking5)                    
Yes No 6,999 5,142 42.4 57.7 275.4 389.8 13.1 22.2 < 0.0001 1,288 17,038 7.0 93.0 288.6 312.4 33.3 11.2 0.4967
Physical activity6)                    
Active Inactive 1,463 10,652 12.1 87.9 350.4 318.7 31.2 12.9 0.3408 2,019 16,281 11.0 89.0 266.0 315.7 19.6 11.6 0.0253
Obesity7)                    
Underweight 433 3.5 168.0 21.8   1,023 5.5 367.5 41.0  
Normal Overweight 4,444 3,246 36.0 26.3 268.1 363.1 15.0 28.2 < 0.0001 8,030 4,069 43.2 21.9 319.9 299.6 14.2 18.8 0.2326
Obese 4,229 34.2 356.0 20.8   5,482 29.5 284.1 23.1  

1) Standard error 2) p value was from student's t-test and ANOVA using the SURVEYREG procedure. 3) low (first quartile), middle-low (second quartile), middle-high (third quartile) high (fourth quartile) 4) ‘yes' meant drank more than once a month over the past year. 5) ‘yes' meant smoked > 100 cigarettes over lifetime and still smoking. 6) ‘active' meant performed moderate-intensity physical activity which requires a moderate amount of effort and causes slightly rapid breathing for ≥ 30 minutes once for ≥ 5 days a week. 7) ‘Underweight' meant body mass index (BMI) < 18.5 kg/m2, ‘Normal' meant 18.5 kg/m2 ≤ BMI < 23 kg/m2, ‘Overweight' meant 23 kg/m2 ≤ BMI < 25 kg/m2, and ‘Obese' meant BMI ≥ 25 kg/m2. ∗Number of missing values was 581, 656, 703, 645, 697, and 156 for household income, education level, regular alcohol consumption, current smoking, physical activity and obesity.

Table 2.
Intakes of flavonoids and nutrients according to household income level1)
  Men Women
Dietary intakes Low Middle-low Middle-high High p for trend2) Low Middle-low Middle-high High p for trend2)
Nutrients                    
Total energy (kcal/d) 2,046.1 ± 24.3 2,280.8 ± 19.2 2,382.0 ± 19.1 2,379.3 ± 18.5 < 0.0001 1,496.4 ± 12.9 1,653.4 ± 12.4 1,710.9 ± 11.5 1,736.9 ± 11.6 < 0.0001
Carbohydrate (% of total energy) 67.0 ± 0.5 63.4 ± 0.3 62.1 ± 0.3 61.5 ± 0.3 < 0.0001 73.8 ± 0.3 68.9 ± 0.2 67.4 ± 0.2 66.9 ± 0.2 < 0.0001
Protein (% of total energy) 13.4 ± 0.1 14.3 ± 0.1 14.6 ± 0.1 15.1 ± 0.1 < 0.0001 13.0 ± 0.1 14.1 ± 0.1 14.5 ± 0.1 14.7 ± 0.1 < 0.0001
Fat (% of total energy) 6.7 ± 0.1 7.9 ± 0.1 8.4 ± 0.1 8.5 ± 0.1 < 0.0001 5.9 ± 0.1 7.6 ± 0.1 8.1 ± 0.1 8.3 ± 0.1 < 0.0001
Dietary fiber (g/d) 7.2 ± 0.1 7.9 ± 0.1 8.2 ± 0.1 8.6 ± 0.1 < 0.0001 6.1 ± 0.1 6.6 ± 0.1 7.0 ± 0.1 7.3 ± 0.1 < 0.0001
Vitamin A (μg RE/d) 722.7 ± 30.2 870.5 ± 20.6 966.2 ± 25.7 1,004.2 ± 22.8 < 0.0001 591.6 ± 16.6 732.4 ± 17.3 808.8 ± 29.5 862.4 ± 21.4 < 0.0001
Vitamin C (mg/d) 89.1 ± 2.0 108.3 ± 2.0 115.3 ± 1.9 124.4 ± 2.5 < 0.0001 79.2 ± 1.5 99.5 ± 1.9 108.8 ± 2.0 115.9 ± 2.0 < 0.0001
Flavonoids (mg/d)                    
Flavonols (mg/d) 36.1 ± 4.1 47.9 ± 6.0 60.5 ± 4.6 85.1 ± 6.1 < 0.0001 30.5 ± 3.9 49.6 ± 5.8 55.6 ± 4.3 69.6 ± 4.6 < 0.0001
Flavones (mg/d) 1.0 ± 0.0 1.3 ± 0.0 1.5 ± 0.1 1.5 ± 0.0 0.0553 0.9 ± 0.0 1.0 ± 0.0 1.4 ± 0.3 1.1 ± 0.0 0.6627
Flavanones (mg/d) 4.7 ± 0.5 7.2 ± 0.7 8.3 ± 0.6 10.0 ± 0.9 < 0.0001 5.8 ± 0.5 9.6 ± 0.6 11.2 ± 0.6 12.5 ± 0.8 < 0.0001
Flavan-3-ols (mg/d) 73.2 ± 15.2 90.6 ± 18.4 127.4 ± 13.9 196.4 ± 18.6 < 0.0001 61.3 ± 12.6 114.7 ± 17.6 131.7 ± 13.4 169.1 ± 14.2 < 0.0001
Anthocyanins (mg/d) 25.7 ± 2.1 36.8 ± 1.7 41.9 ± 1.6 43.6 ± 1.9 < 0.0001 21.9 ± 1.3 30.5 ± 1.3 33.1 ± 1.1 40.0 ± 1.7 < 0.0001
Proanthocyanidin (mg/d) 47.7 ± 5.5 61.8 ± 4.1 61.5 ± 3.5 68.5 ± 4.3 0.0021 53.3 ± 3.6 67.7 ± 4.5 71.6 ± 3.7 80.7 ± 4.3 < 0.0001
Isoflavones (mg/d) 20.0 ± 1.0 21.5 ± 0.8 22.8 ± 0.7 23.9 ± 0.7 0.0091 14.7 ± 0.5 16.7 ± 0.5 17.6 ± 0.5 17.3 ± 0.5 0.6478
Total flavonoids (mg/d) 208.4 ± 20.3 267.1 ± 25.3 323.9 ± 19.0 429.1 ± 25.4 < 0.0001 188.4 ± 16.8 289.7 ± 24.1 322.2 ± 18.3 390.4 ± 19.3 < 0.0001

1) low (first quartile), middle-low (second quartile), middle-high (third quartile), high (fourth quartile) 2) P for trend value was from GLM (generalized linear model) analysis and adjusted for current smoking status, alcohol drinking status, physical activity and energy intake except for total energy, carbohydrate, protein, and fat variables.

Table 3.
Intakes of flavonoids and nutrients according to education level
Men Women
Dietary intakes ≤ Elementary school Middle school High school ≥ College p p for trend1) ≤ Elementary school Middle school High school ≥ College p p for trend1)
Nutrients                    
Total energy (kcal/d) 2,012.8 ± 21.1 2,205.7 ± 24.4 2,362.3 ± 17.3 2,374.4 ± 17.4 < 0.0001 1,472.4 ± 10.0 1,651.7 ± 17.5 1,692.1 ± 10.5 1,806.6 ± 12.2 < 0.0001
Carbohydrate (% of total energy) 69.9 ± 0.4 65.8 ± 0.5 61.7 ± 0.3 61.2 ± 0.3 < 0.0001 76.3 ± 0.2 71.0 ± 0.4 66.2 ± 0.2 64.4 ± 0.2 < 0.0001
Protein (% of total energy) 12.9 ± 0.1 13.8 ± 0.1 14.6 ± 0.1 15.1 ± 0.1 < 0.0001 12.7 ± 0.1 14.1 ± 0.1 14.7 ± 0.1 15.0 ± 0.1 < 0.0001
Fat (% of total energy) 5.5 ± 0.1 6.5 ± 0.1 8.5 ± 0.1 8.8 ± 0.1 < 0.0001 5.1 ± 0.1 6.7 ± 0.1 8.5 ± 0.1 9.3 ± 0.1 < 0.0001
Dietary fiber (g/d) 7.7 ± 0.1 8.3 ± 0.2 7.9 ± 0.1 8.3 ± 0.1 < 0.0001 6.4 ± 0.1 7.5 ± 0.2 6.9 ± 0.1 6.9 ± 0.1 < 0.0001
Vitamin A(μg RE/d) 703.0 ± 29.9 858.4 ± 29.8 908.5 ± 21.1 1,023.3 ± 22.7 < 0.0001 624.4 ± 22.1 769.6 ± 20.7 810.4 ± 26.1 829.4 ± 15.3 < 0.0001
Vitamin C (mg/d) 95.1 ± 2.4 109.4 ± 3.1 110.8 ± 1.9 121.6 ± 1.9 < 0.0001 84.0 ± 1.5 106.7 ± 2.5 106.4 ± 1.8 114.5 ± 2.0 < 0.0001
Flavonoids (mg/d)                    
Flavonols (mg/d) 25.6 ± 2.1 35.7 ± 3.4 51.2 ± 3.7 91.3 ± 6.6 < 0.0001 22.5 ± 1.6 43.6 ± 5.1 57.4 ± 4.6 82.3 ± 6.0 < 0.0001
Flavones (mg/d) 1.2 ± 0.0 1.4 ± 0.1 1.4 ± 0.1 1.5 ± 0.0 0.8056 0.9 ± 0.0 1.1 ± 0.0 1.3 ± 0.2 1.1 ± 0.0 0.9518
Flavanones (mg/d) 5.2 ± 0.6 6.6 ± 1.0 8.3 ± 0.6 9.1 ± 0.6 0.8551 5.8 ± 0.4 11.1 ± 0.8 10.8 ± 0.6 13.1 ± 0.8 0.6653
Flavan-3-ols (mg/d) 29.7 ± 6.2 50.9 ± 10.0 100.2 ± 11.4 223.5 ± 20.5 0.0009 30.6 ± 4.7 90.2 ± 15.5 139.5 ± 14.3 213.2 ± 18.7 0.0169
Anthocyanins (mg/d) 21.2 ± 2.3 29.2 ± 2.2 41.4 ± 1.4 45.0 ± 1.5 < 0.0001 20.1 ± 1.1 28.7 ± 1.4 36.0 ± 1.4 40.3 ± 1.5 < 0.0001
Proanthocyanidin (mg/d) 62.5 ± 5.2 59.8 ± 5.8 57.6 ± 3.3 65.6 ± 3.8 0.5073 58.0 ± 3.4 78.1 ± 6.2 65.0 ± 3.1 82.2 ± 4.4 0.1556
Isoflavones (mg/d) 22.6 ± 1.1 24.3 ± 1.3 21.4 ± 0.6 23.2 ± 0.6 0.4884 16.6 ± 0.5 19.1 ± 1.0 16.0 ± 0.4 17.3 ± 0.5 0.0715
Total flavonoids (mg/d) 168.1 ± 10.4 207.9 ± 14.8 281.5 ± 15.9 459.3 ± 27.3 < 0.0001 154.5 ± 7.6 271.9 ± 21.8 326.1 ± 19.0 449.5 ± 25.2 < 0.0001

1) P for trend value was from GLM (generalized linear model) analysis and adjusted for current smoking status, alcohol drinking status, physical activity and energy intake except for tota energy, carbohydrate, protein, and fat variables.

TOOLS
Similar articles