

 PDF
PDF ePub
ePub Citation
 Print
Print


Abstract
Purpose
The purpose of this study was to investigate the consumption behaviors of sugar-sweetened beverages and blood lipid profiles according to food-related lifestyles of adults in Incheon. Methods: Subjects were recruited from 19 to 64 year old adults residing in Incheon who visited for the purpose of a health examination at D hospital. A total of 110 subjects consented to participate in this study and to allow their health examination records to be used at D hospital. Data were collected using self-administered questionnaires and anthropometric data, and blood lipid profiles were collected from health examination records. Statistical analysis was performed using the SPSS 20.0 program. Results: In the factor analysis, food-related lifestyles were categorized into four factors: planned purchase seeking, taste seeking, well-being seeking, and convenience seeking. Using the K-average clustering method, food-related lifestyles of subjects were categorized into two groups: health and rationality-oriented group (HRG) and convenience purchase-oriented group (CPG). Average total scores of sugar-related nutrition knowledge in the HRG were significantly higher compared to the CPG, and average scores of consumption habits regarding sugar-containing foods in the HRG were significantly lower compared to the HRG. When subjects chose sugar-sweetened beverages, the CPG showed a significantly higher frequency of checking food labeling and considering nutrition compared to the CPG. Drinking frequency of carbonated beverages in the CPG was significantly higher compared to the HRG. Conclusion: There were significant differences in sugar-related nutrition knowledge and consumption habits of sugar-sweetened beverages between the two food-related lifestyle groups. These results could be useful for establishing guidelines for reducing consumption of sugar-sweetened beverages. In addition, it is necessary to continue sugar-related nutrition education by considering the food-related lifestyles of adults.
Go to : 
References
1. Kim TH. 2017 Industry outlook: beverage [Internet]. Seoul: IBKS Research;2016. [cited 2017 Apr 13]. Available from:. http://hkcon-sensus.hankyung.com/apps.analysis/analysis.downpdf?report_idx=401151.
2. Ministry of Agriculture, Food and Rural Affairs (KR); Korea Agro-Fisheries and Food Trade Corporation. 2015 processed food subdivision market status: beverage market. Sejong: Ministry of Agriculture, Food and Rural Affairs;2015. Agriculture, Food and Rural Affairs; 2015.
3. Tintera JW. The hypoadrenocortical state and its management. N Y State J Med. 1955; 55(13):1869–1876.
4. Vartanian LR, Schwartz MB, Brownell KD. Effects of soft drink consumption on nutrition and health: a systematic review and metaanalysis. Am J Public Health. 2007; 97(4):667–675.

5. Hur YI. Associations between sugar intake from different food sources and adiposity or cardiometabolic risk in childhood and adolescence: the Korean child–adolescent cohort study [dissertation]. Seoul: Ewha Womans University;2016.
6. Tahmassebi JF, Duggal MS, Malik-Kotru G, Curzon ME. Soft drinks and dental health: a review of the current literature. J Dent. 2006; 34(1):2–11.
7. Sánchez GA, Fernandez De Preliasco MV. Salivary pH changes during soft drinks consumption in children. Int J Paediatr Dent. 2003; 13(4):251–257.
8. Jun MK, Lee DH, Lee SM. Assessment of nutrient and sugar content and ph of some commercial beverages. J Dent Hyg Sci. 2016; 16(6):464–471.
9. Choi MH, Kwon KI, Kim JY, Lee JS, Kim JW, Park HK, Kim MC, Kim GH. Monitoring of total sugar contents in processed foods and noncommercial foodservice foods. Korean J Food Sci Technol. 2008; 40(3):337–342.
10. Ministry of Food and Drug Safety (KR). Sugar intake, so reduce!: food and drug consumer needs report. Cheongju: Ministry of Food and Drug Safety;2016.
11. Assael H. Consumer behavior and marketing action. 2nd edition.Boston (MA): Kent Publishing Company;1984.
12. Cheil Worldwide (KR). Korean lifestyle and consumption behavior. Seoul: Kyeongmunsa;1995.
13. Sul HK, Lee SH, Jun JK. An exploratory study on dietary behavior in lifestyle. J Foodserv Manage. 2007; 10(2):267–284.
14. Lee YK. A study on food purchase behavior according to wives'food related life style [dissertation]. Seoul: Sungkyunkwan University;2007.
15. Chae SI. A study on lifestyle according to systematic analysis. J Consum Stud. 1992; 3(1):46–63.
16. Lee KR, Lee EJ, Kim JY. Study on beverage select behavior according to the food-related lifestyle focused on behaviors in Seoul, and Gyeonggi province. Korean J Food Cult. 2017; 32(1):27–38.
17. Lee JH. A study on obesity index and attributes of selecting places to eat out by food-related lifestyle types: focusing on Pusan University students. Korean J Culinary Res. 2012; 18(4):47–58.
18. Hwang GH, Huh YR. A study of hyperlipidemia in Koreans: I. Specially related to physical characteristics and it's risk factors for hypercholesterolemia. Korean J Food Nutr. 1999; 12(3):279–289.
19. Oh YG, Kim KJ. A study on the effects of food-related lifestyle on coffee consumption behavior. Asia Pac J Bus Ventur Entrepreneurship. 2012; 7(4):65–75.
20. Kim YK, Choi YS, Han JS. A study on the food-related lifestyle and their impacts on coffee product consumption behaviour of franchised coffee brands. Korean J Tourism Res. 2013; 28(5):285–303.
21. Kim HC, Won YE, Lee JE. An analysis of coffee shop selection attributes by food lifestyle types among Korean office workers. J Tourism Sci. 2010; 34(7):187–205.
22. Kim HC, Kim MR. Intake behavior regarding beverages according to dietary lifestyles of university students. J East Asian Soc Diet Life. 2015; 25(2):223–233.
23. Kim SM. A study on the status of beverage consumption and related factors of the middle and high school students in Gyeo-ngnam area [dissertation]. Changwon: Kyungnam University;2011.
24. Kim SK. Comparison of the current status of sugar intake according to levels of high school student's nutritional knowledge [dissertation]. Seoul: Sookmyung Women's University;2016.
25. Won YE. A study on the specialty coffee shop selection attributes by the food-related lifestyle [dissertation]. Seoul: Chung-Ang University;2010.
26. Korean Society for the Study of Obesity. Dagnosis and evaluation of obesity [Internet]. Seoul: Korean Society for the Study of Obesity;2017. [cited 2017 Jun 15]. Avaiable from:. http://www.kosso.or.kr/general/board/list.html?num=76&start=10&sort=top. %20desc, num%20desc&code=general_03&key=.
27. Korean Society of Lipidology and Atherosclerosis. Dyslipidemia treatment guidelines. 3rd edition.Seoul: Korean Society for the Study of Obesity;2015.
28. Kim HC. Statistical Analysis. Seoul: Hakjisa;2013.
29. Kang HY, Jo MN. HMR current use and key buying factor according to food-related lifestyle by college students. J Tourism Sci. 2015; 39(8):87–106.
30. Lee IO, Jung SY, Hong GJ. An analysis on nutrition knowledge level and food preference according to the food-related lifestyle tendency: focus on housewives in the Seoul and Gyeonggi area. Korean J Food Cult. 2016; 31(1):33–41.
31. Choi JE, Kim YG. The relationship between university students'nutrition knowledge, dietary self-efficacy, dietary habits and menu choice behavior. J Foodserv Manage. 2012; 15(6):249–275.
32. Kim KH. A study of the dietary habits, the nutritional knowledge and the consumption patterns of convenience foods of university students in the Gwangju area. Korean J Community Nutr. 2003; 8(2):181–191.
33. Ham SY, Jeong JY, Kim YS. Relationships among customer attitude, behavioral intention and health-consciousness toward menu labeling in restaurants. J Tourism Leis Res. 2016; 28(1):365–384.
34. Jeong JY, Ham SY. Relationships between health beliefs and behavioral intention to use menu labels in restaurants. J Tourism Leis Res. 2016; 28(9):519–538.
35. MacMillan A. 13 ways to stop drinking soda for good [Internet]. HuffPost;[place unknown]. 2015. [cited 2017 Apr 24]. Available from:. http://www.huffingtonpost.com/2015/03/05/how-to-stop-drinking-soda_n_6802700.html.
36. Lee JS, Kim KS. A study on the dietary attitude of the house wives in Pusan by nutrition knowledge, purpose value of meals and monthly food expenditure. Korean J Food Nutr. 1999; 12(3):300–305.
37. Kang HJ, Byun KW. Effect of two-year course of food and nutrition on improving nutrition knowledge, dietary attitudes and food habits of junior college female students. Korean J Community Nutr. 2010; 15(6):750–759.
38. Lee HY, Kim MK. Dietary behavioral correlates of nutrition label use in Korean women. Korean J Nutr. 2008; 41(8):839–850.
39. Lee KA. The concern for health, nutrition knowledge, and nutri-tonal attitude of elementary school children's mothers in Busan. Korean J Food Cult. 2002; 17(4):411–423.
40. MEDIcheck (KR). Health screening! Get it before the end of the year [Internet]. Suwon: Korea Association of Health Promotion;2016. [cited 2017 Jun 15]. Available from:. http://cafe.naver.com/okhospital/16413.
41. Kim BS, Kang JH, Kim KS, Lee SJ, Lee MH, Park JR. Seasonal variations of serum lipid concentrations in health screened population. Korean Circ J. 1998; 28(7):1122–1130.
42. Thomas CB, Holljes HW, Eisenberg FF. Observations on seasonal variations in total serum cholesterol level among healthy young prisoners. Ann Intern Med. 1961; 54(3):413–430.
43. Kim CK. Seasons and prices: improvement the quality of life of the people through mitigation of price volatility. Wkly Econ Rev. 2015; 648:1–17.
Go to :
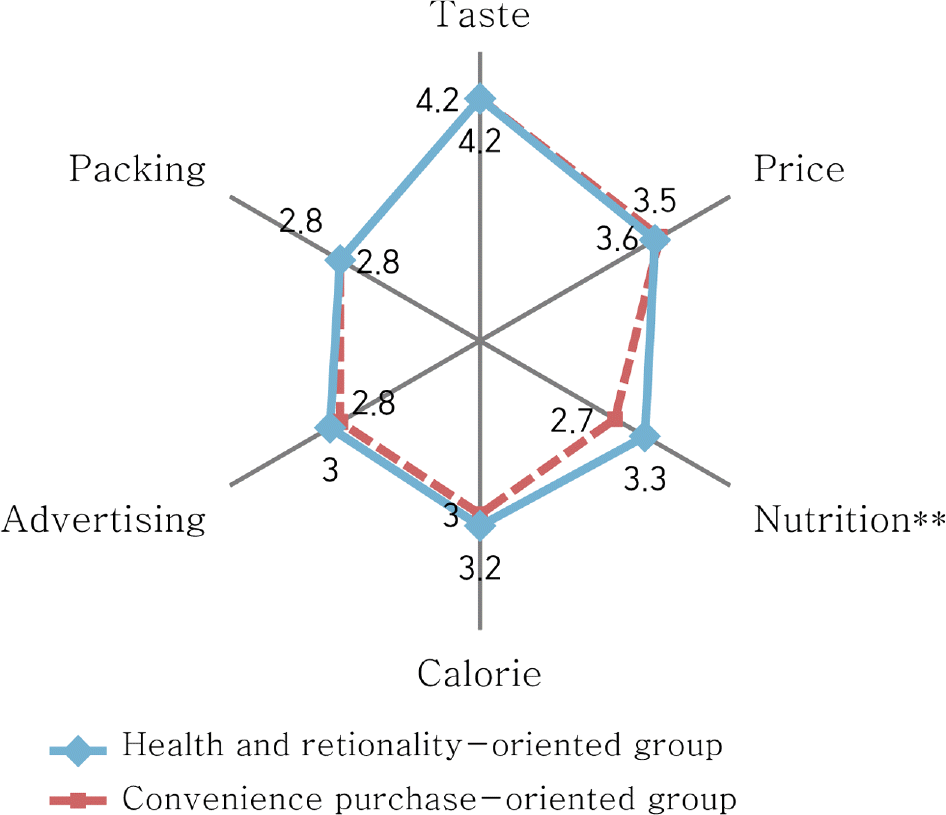 | Fig. 1.Selection attributes for sugar-sweetened beverages of cluster types according to food-related lifestyles. ∗∗p < 0.01 by Student t-test. |
Table 1.
Factor and reliability analysis of subjects' food-related lifestyles
Table 2.
Result of cluster analysis according to food-related lifestyles
Table 3.
General characteristics and anthropometric data of cluster types according to food-related lifestyles
Table 4.
Blood lipid levels of cluster types according to food-related lifestyles
Table 5.
Nutrition knowledge of cluster types according to food-related lifestyles
| Variables | Health and rationality-oriented group (n = 48) | Convenience purchase-oriented group (n = 59) | χ2 or t value |
|---|---|---|---|
| Sugar provides energy of 9 kcal per gram. | 9 (18.8)1) | 11 (18.6) | 0.000 |
| If you eat too much of sugar, the surplus is laid down as fat. | 38 (79.2) | 39 (66.1) | 2.239 |
| WHO recommends a sugar intake should be 10% of your total calories. | 17 (35.4) | 18 (30.5) | 0.290 |
| The brain uses only glucose as a source of energy. | 20 (41.7) | 15 (25.4) | 3.173 |
| Sugars in natural foods are faster in digestion and absorption than sugars in processed foods. | 16 (33.3) | 21 (35.6) | 0.060 |
| Processed food should make an indication of their sugar content in nutrition labeling system compulsory. | 36 (75.0) | 40 (67.8) | 0.667 |
| Natural foods as fruits, honey, sweet potatoes, pumpkin, and etc. contain sugar. | 45 (93.8) | 49 (83.1) | 2.839 |
| Unsweetened juice contains no sugar. | 39 (81.2) | 33 (55.9) | 7.708∗ |
| People with diabetes should never consume sugar. | 37 (77.1) | 40 (67.8) | 1.131 |
| Excessive intake of sugars can lead to diabetes and cardiovascular disease. | 43 (89.6) | 45 (76.3) | 3.212 |
| Average scores | 6.3 ± 1.92) | 5.3 ± 2.3 | 2.390∗ |
Table 6.
Consumption habits regarding sugar-containing food of cluster types according to food-related lifestyles
| Variables | Health and rationality-oriented group (n = 48) | Convenience purchase-oriented group (n = 59) | t value |
|---|---|---|---|
| I like sweet food. | 2.7 ± 1.01) | 3.4 ± 0.9 | –3.558∗∗ |
| I usually eat sweet. | 2.3 ± 0.8 | 3.0 ± 0.9 | –4.303∗∗∗ |
| When I buy food, I check the nutrition labeling on the wrapping paper and buy it. | 2.8 ± 0.9 | 3.8 ± 0.7 | –6.159∗∗∗ |
| I often eat chocolate, candy, caramel, and jelly. | 2.3 ± 0.9 | 2.8 ± 1.0 | –2.568∗ |
| When I eat bread, I eat to put jam, cream cheese, etc. | 2.6 ± 1.0 | 3.2 ± 1.0 | –2.976∗∗ |
| I often eat processed milk such as chocolate milk rather than white milk. | 2.2 ± 0.8 | 2.8 ± 1.1 | –2.756∗∗ |
| I drink beverages more often than water. | 2.2 ± 0.8 | 2.8 ± 1.1 | –3.099∗∗ |
| I drink fruit juice more often than fruit. | 2.5 ± 0.9 | 2.7 ± 0.9 | –1.377 |
| Average total scores | 19.7 ± 4.5 | 24.4 ± 4.7 | –5.284∗∗∗ |
| 1) M ± SD |
Table 7.
Consumption behaviors of sugar-sweetened beverages of cluster types according to food-related lifestyles
| Variables | Health and rationality-oriented group (n = 48) | Convenience purchase-oriented group (n = 59) | χ2 or t value |
|---|---|---|---|
| Place of usual purchase | |||
| Convenience store | 13 (27.1)1) | 21 (35.6) | |
| Large retailer | 24 (50.0) | 16 (27.1) | |
| Fast food store | 1 (2.1) | 4 (6.8) | 6.698 |
| Bakery and coffee shop | 8 (16.7) | 13 (22.0) | |
| Others | 2 (4.2) | 5 (8.5) | |
| Place of usual drinking | |||
| Home | 5 (10.4) | 11 (18.6) | |
| Workplace | 20 (41.7) | 29 (49.2) | |
| Fast food store Bakery and coffee shop | 6 (12.5) 10 (20.8) | 6 (10.2) 3 (5.1) | 8.103 |
| On the move | 5 (10.4) | 9 (15.3) | |
| Others | 2 (4.2) | 1 (1.7) | |
| Time of usual drinking | |||
| Instead of water | 2 (4.2) | 7 (11.9) | |
| After exercise | 3 (6.2) | 2 (3.4) | |
| Snack time Frequently | 17 (35.4) 3 (6.2) | 21 (35.6) 13 (22.0) | 11.248∗ |
| Eating out | 13 (27.1) | 12 (20.3) | |
| Others | 10 (20.8) | 4 (6.8) | |
| A person who drinks together | |||
| Family | 9 (18.8) | 8 (13.6) | |
| Friends | 13 (7.1) | 11 (18.6) | |
| Work colleagues | 14 (29.2) | 20 (33.9) | 7.404 |
| Alone | 9 (18.8) | 20 (33.9) | |
| Others | 3 (6.2) | 0 (0.0) | |
| Check food labeling | 2.7 ± 0.92) | 2.0 ± 0.7 | 4.743∗∗∗ |
| 1) n (%) 2) M ± SD |
Table 8.
Frequency of sugar-sweetened beverages intake of cluster types according to food-related lifestyles
| Variables | Health and rationality-oriented group (n = 48) | Convenience purchase-oriented group (n = 59) | χ2 value |
|---|---|---|---|
| Carbonated drinks | |||
| 1 time and over per day | 3 (6.2)1) | 7 (11.9) | |
| 4 ∼ 6 times per week | 1 (2.1) | 6 (10.2) | 7.902∗ |
| 1 ∼ 3 times per week | 17 (35.4) | 27 (45.8) | |
| Nearly do not drink | 27 (56.2) | 19 (32.2) | |
| Milk and dairy products drinks | |||
| 1 time and over per day | 5 (10.4) | 6 (10.2) | |
| 4 ∼ 6 times per week | 4 (8.3) | 4 (6.8) | 2.462 |
| 1 ∼ 3 times per week | 27 (56.2) | 26 (44.1) | |
| Nearly do not drink | 12 (25.0) | 23 (39.0) | |
| Fruit/vegetable juice | |||
| 1 time and over per day | 5 (10.4) | 1 (1.7) | |
| 4 ∼ 6 times per week | 3 (6.2) | 4 (6.8) | 6.179 |
| 1 ∼ 3 times per week | 18 (37.5) | 33 (55.9) | |
| Nearly do not drink | 22 (45.8) | 21 (35.6) | |
| Fermented beverage | |||
| 1 time and over per day | 5 (10.4) | 4 (6.8) | |
| 4 ∼ 6 times per week | 3 (6.2) | 5 (8.5) | 0.923 |
| 1 ∼ 3 times per week | 16 (33.3) | 23 (39.0) | |
| Nearly do not drink | 24 (50.0) | 27 (45.8) | |
| Americano coffee | |||
| 1 time and over per day | 20 (41.7) | 18 (30.5) | |
| 4 ∼ 6 times per week | 3 (6.2) | 7 (11.9) | 9.216∗ |
| 1 ∼ 3 times per week | 17 (35.4) | 11 (18.6) | |
| Nearly do not drink | 8 (16.7) | 23 (39.0) | |
| Mixed coffee | |||
| 1 time and over per day | 9 (18.8) | 19 (32.2) | |
| 4 ∼ 6 times per week | 4 (8.3) | 6 (10.2) | 3.602 |
| 1 ∼ 3 times per week | 11 (22.9) | 14 (23.7) | |
| Nearly do not drink | 24 (50.0) | 20 (33.9) | |
| Traditional drinks | |||
| 1 time and over per day | 0 (0.0) | 1 (1.7) | |
| 4 ∼ 6 times per week | 3 (6.2) | 7 (11.9) | 2.159 |
| 1 ∼ 3 times per week | 7 (14.6) | 6 (10.2) | |
| Nearly do not drink | 38 (79.2) | 45 (76.3) |
 XML Download