1. Kim HJ, Kim Y, Cho Y, Jun B, Oh KW. Trends in the prevalence of major cardiovascular disease risk factors among Korean adults: results from the Korea National Health and Nutrition Examination Survey, 1998-2012. Int J Cardiol. 2014; 174(1):64–72.

2. Ministry of Health and Welfare. Korea Centers for Disease Control and Prevention. Korea Health Statistics 2012: Korea National Health and Nutrition Examination Survey (KNHANES V-3). Cheongwon: Korea Centers for Disease Control and Prevention;2013.
3. Lim S, Shin H, Song JH, Kwak SH, Kang SM, Yoon JW, Choi SH, Cho SI, Park KS, Lee HK, Jang HC, Koh KK. Increasing prevalence of metabolic syndrome in Korea: the Korean National Health and Nutrition Examination Survey for 1998-2007. Diabetes Care. 2011; 34(6):1323–1328.
4. Korea Food Research Institute. Development of Korean foods marketing model. Sungnam: Korea Food Research Institute;2008.
5. Rural Development Administration. National Institute of Agricultural Sciences (KR). Hansik and health. Suwon: Rural Development Administration;2010.
6. Joo YH. The food humanities: Korean history and culture through food. Seoul: Humanist;2011.
7. Kim JS. Universalizing Korean food. Korean J Food Cult. 2005; 20(5):499–507.
8. Song Y, Joung H. A traditional Korean dietary pattern and metabolic syndrome abnormalities. Nutr Metab Cardiovasc Dis. 2012; 22(5):456–462.
9. Kim J, Jo I, Joung H. A rice-based traditional dietary pattern is associated with obesity in Korean adults. J Acad Nutr Diet. 2012; 112(2):246–253.
10. Rural Development Administration. National Institute of Agricultural Sciences (KR). Hansik is the best 'Hansik and prevention of metabolic syndrome'. Suwon: Rural Development Administration;2012.
11. Kang M, Jung HJ, Joung HJ, Shim JE, Lee SE, Park YH, Paik HY. Development of Han-sik database utilizing an expert focus group and assessment of Han-sik effects on diet quality. Korean J Food Cult. 2014; 29(1):9–17.
12. Ayeleso A, Brooks N, Oguntibeju O, Mukwevho E. Natural antioxidant vitamins: a review of their beneficial roles in management of diabetes mellitus and its complications. Trop J Pharm Res. 2016; 15(6):1341–1348.
13. Pounis G, Costanzo S, di Giuseppe R, de Lucia F, Santimone I, Sciarretta A, Barisciano P, Persichillo M, de Curtis A, Zito F, Di Castelnuovo AF, Sieri S, Benedetta Donati M, de Gaetano G, Iacoviello L. Consumption of healthy foods at different content of antioxidant vitamins and phytochemicals and metabolic risk factors for cardiovascular disease in men and women of the Moli-sani study. Eur J Clin Nutr. 2013; 67(2):207–213.
14. Ministry of Health and Welfare. Korea Centers for Disease Control and Prevention. Korea Health Statistics 2007: Korea National Health and Nutrition Examination Survey (KNHANES IV-1) [Internet]. Cheongwon: Korea Centers for Disease Control and Prevention;2008. cited 2016 May 1. Available from:
https://knhanes.cdc.go.kr/knhanes/index.do.
15. Ministry of Health and Welfare. Korea Centers for Disease Control and Prevention. Korea Health Statistics 2008: Korea National Health and Nutrition Examination Survey (KNHANES IV-2) [Internet]. Cheongwon: Korea Centers for Disease Control and Prevention;2009. cited 2016 May 1. Available from:
https://knhanes.cdc.go.kr/knhanes/index.do.
16. Ministry of Health and Welfare. Korea Centers for Disease Control and Prevention. Korea Health Statistics 2009: Korea National Health and Nutrition Examination Survey (KNHANES IV-3) [Internet]. Cheongwon: Korea Centers for Disease Control and Prevention;2010. cited 2016 May 1. Available from:
https://knhanes.cdc.go.kr/knhanes/index.do.
17. Ministry of Health and Welfare. Korea Centers for Disease Control and Prevention. Korea Health Statistics 2010: Korea National Health and Nutrition Examination Survey (KNHANES V-1) [Internet]. Cheongwon: Korea Centers for Disease Control and Prevention;2011. cited 2016 May 1. Available from:
https://knhanes.cdc.go.kr/knhanes/index.do.
18. Ministry of Health and Welfare. Korea Centers for Disease Control and Prevention. Korea Health Statistics 2011: Korea National Health and Nutrition Examination Survey (KNHANES V-2) [Internet]. Cheongwon: Korea Centers for Disease Control and Prevention;2012. cited 2016 May 1. Available from:
https://knhanes.cdc.go.kr/knhanes/index.do.
19. Ministry of Health and Welfare. Korea Centers for Disease Control and Prevention. Korea Health Statistics 2012: Korea National Health and Nutrition Examination Survey (KNHANES V-3) [Internet]. Cheongwon: Korea Centers for Disease Control and Prevention;2013. cited 2016 May 1. Available from:
https://knhanes.cdc.go.kr/knhanes/index.do.
20. Park YH, Kang M, Baik HW, Oh SW, Park SJ, Paik HY, Choe JS, Lee JY, Kang MS, Joung H. A study on the perception as Hansik (Korean food) for the common dishes in Korean adults residing in Seoul and metropolitan area. Korean J Community Nutr. 2012; 17(5):555–578.
21. Lee SE, Kang M, Park YH, Joung H, Yang YK, Paik HY. Perception of common Korean dishes and foods among professionals in related fields. Korean J Nutr. 2012; 45(6):562–576.
22. World Health Organization Western Pacific Region. International Association for the Study of Obesity. International Obesity Task Force. The Asia-Pacific perspective: redefining obesity and its treatment. Sydney: Health Communications Australia Pty Limited;2000.
23. Kim SA, Jun S, Joung H. Estimated dietary intake of vitamin A in Korean adults: based on the Korea National Health and Nutrition Examination Survey 2007~2012. J Nutr Health. 2016; 49(4):258–268.
24. Tang G. Bioconversion of dietary provitamin A carotenoids to vitamin A in humans. Am J Clin Nutr. 2010; 91(5):1468S–1473S.
25. Ministry of Health and Welfare (KR); The Korean Nutrition Society. Dietary reference intakes for Koreans 2015. Sejong: Ministry of Health and Welfare;2016.
26. Jelliffe DB. The assessment of the nutritional status of the community. Geneva: World Health Organization;1966.
27. Kim BH, Lee JW, Lee Y, Lee HS, Jang YA, Kim CI. Food and nutrient consumption patterns of the Korean adult population by income level – 2001 National Health and Nutrition Survey. Korean J Community Nutr. 2005; 10(6):952–962.
28. Shim JE, Joung H, Paik HY. Effects of food cost on a diet quality. Korean J Nutr. 2006; 39(8):832–840.
29. Kang M, Jung HJ, Paik HY, Joung H. The Hansik consumption and quality of diet. In : Proceedings of the 54th the Korean Society of Food Culture Conference; 2012 Nov 2; Seoul.


 PDF
PDF ePub
ePub Citation
 Print
Print


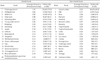
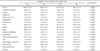
 ) according to the sex and age group. 3) P-values were from chi-square test for categorical variables and proc surveyreg for continuous variables. 4) 'Underweight' meant BMI (body mass index) < 18.5 kg/m2, 'Normal' meant 18.5 kg/m2 ≤ BMI < 23 kg/m2, 'Overweight' meant 23 kg/m2 ≤ BMI < 25 kg/m2, and 'Obese' meant BMI ≥ 25 kg/m2.22


 XML Download