Journal List > J Nutr Health > v.48(5) > 1081407

Ahn, Yoo, and Park: High fructose and high fat diet increased bone volume of trabecular and cortical bone in growing female rats∗

Abstract

Purpose:

The objective of this study was to investigate the effects of a high fructose and fat diet on bone growth and maturation in growing female rats.

Methods:

Three-week-old female SD rats were randomly assigned to four experimental groups; the control group (CON: fed control diet based on AIN-93G, n = 8); the high-fructose diet group (HFrc: fed control diet with 30% fructose, n = 8); the high-fat diet group (Hfat: fed control diet with 45 kcal% fat, n = 8); and the high-fat diet plus high fructose group (HFrc + HFat: fed diets 45 kcal% fat with 30% fructose, n = 8). Each group was assigned their respective diets for the remaining eight weeks. Bone-related parameters (bone mineral density (BMD) and structural parameters, osteocalcin (OC), deoxypyridinoline (DPD)) and morphologic changes of kidney were analyzed at the end of the experiment.

Results:

Final body weights and weight gain were higher in the HFat and HFrc + HFat groups and showed higher tendency in the HFrc group compared with those of the CON group (p < 0.05); however, no significant difference in caloric intake was observed among the four experimental groups. The serum OC levels of the HFrc and HFrc + HFat groups were lower than those of the CON and HFat groups (p < 0.05). Urinary levels of DPD did not differ among the experimental groups. BV/TV and Tb.N of trabecular bone were higher in the HFrc + HFat group and showed a higher tendency in the HFrc group than those of the CON and HFat groups (p < 0.05). Tb.Pf of trabecular bone were lower in the HFrc + HFat group than those in the CON and HFat groups (p < 0.05). However, no difference in trabecular BMD was observed among the experimental groups. Cortical bone volume was higher in the HFat and HFrc + HFat groups than in the CON and HFrc groups (p < 0.05). No morphology change in kidney was observed among the experimental groups.

Conclusion:

Our study suggests that 8 weeks of high-fructose and high fat intake could improve the bone quality (Structural parameters) of trabecular and cortical bone of tibia in growing female rats.

REFERENCES

1.Kim SD., Moon HK., Park JS., Yang HR., Yi YJ., Han EJ., Lee YC., Shin GY., Kim JH., Chae YZ. The content of macrominerals in beverages, liquid teas, and liquid coffees. J Korean Soc Food Sci Nutr. 2012. 41(8):1134–1143.
crossref
2.Kim SD., Moon HK., Park JS., Lee YC., Shin GY., Jo HB., Kim BS., Kim JH., Chae YZ. Macromineral intake in non-alcoholic beverages for children and adolescents: using the fourth Korea National Health and Nutrition Examination Survey (KNHANES ?, 2007-2009). Korean J Nutr. 2013. 46(1):50–60.
3.Chung SJ., Kim JH., Lee JS., Lee DH., Kim SH., Yu CH. A suggestion to develop a nutrition policy on food and nutrition labeling and education systems for fast food and carbonated soft drinks in Korea. Korean J Nutr. 2004. 37(5):394–405.
4.Ruff JS., Hugentobler SA., Suchy AK., Sosa MM., Tanner RE., Hite ME., Morrison LC., Gieng SH., Shigenaga MK., Potts WK. Compared to sucrose, previous consumption of fructose and glucose monosaccharides reduces survival and fitness of female mice. J Nutr. 2015. 145(3):434–441.
crossref
5.Chung M., Ma J., Patel K., Berger S., Lau J., Lichtenstein AH. Fructose, high-fructose corn syrup, sucrose, and nonalcoholic fatty liver disease or indexes of liver health: a systematic review and meta-analysis. Am J Clin Nutr. 2014. 100(3):833–849.
crossref
6.Stanhope KL., Bremer AA., Medici V., Nakajima K., Ito Y., Nakano T., Chen G., Fong TH., Lee V., Menorca RI., Keim NL., Havel PJ. Consumption of fructose and high fructose corn syrup increase postprandial triglycerides, LDL-cholesterol, and apolipoprotein-B in young men and women. J Clin Endocrinol Metab. 2011. 96(10):E1596–E1605.
crossref
7.Douard V., Asgerally A., Sabbagh Y., Sugiura S., Shapses SA., Casi-rola D., Ferraris RP. Dietary fructose inhibits intestinal calcium absorption and induces vitamin D insufficiency in CKD. J Am Soc Nephrol. 2010. 21(2):261–271.
crossref
8.Palanisamy N., Viswanathan P., Anuradha CV. Effect of genistein, a soy isoflavone, on whole body insulin sensitivity and renal damage induced by a high-fructose diet. Ren Fail. 2008. 30(6):645–654.
9.Dissard R., Klein J., Caubet C., Breuil B., Siwy J., Hoffman J., Sicard L., Ducassé L., Rascalou S., Payre B., Buléon M., Mullen W., Mischak H., Tack I., Bascands JL., Buffin-Meyer B., Schanstra JP. Long term metabolic syndrome induced by a high fat high fructose diet leads to minimal renal injury in C57BL/6 mice. PLoS One. 2013. 8(10):e76703.
crossref
10.Whiting SJ., Vatanparast H., Baxter-Jones A., Faulkner RA., Mir-wald R., Bailey DA. Factors that affect bone mineral accrual in the adolescent growth spurt. J Nutr. 2004. 134(3):696S–700S.
crossref
11.Singh D., Sanyal S., Chattopadhyay N. The role of estrogen in bone growth and formation: changes at puberty. Cell Health Cytoskelet. 2011. 3(1):2–12.
crossref
12.Kang BS., Park MS., Cho YS., Lee JW. Beverage consumption and related factors among adolescents in the Chungnam urban area. Korean J Community Nutr. 2006. 11(4):469–478.
13.Song MJ., An EM., Shon HS., Kim SB., Cha YS. A study on the status of beverage consumption of the middle school students in Jeonju. Korean J Community Nutr. 2005. 10(2):174–182.
14.Bass EF., Baile CA., Lewis RD., Giraudo SQ. Bone quality and strength are greater in growing male rats fed fructose compared with glucose. Nutr Res. 2013. 33(12):1063–1071.
crossref
15.Clarke B. Normal bone anatomy and physiology. Clin J Am Soc Nephrol. 2008. 3(Suppl 3):S131-S139.
crossref
16.Seibel MJ. Biochemical markers of bone turnover: part I: biochemistry and variability. Clin Biochem Rev. 2005. 26(4):97–122.
17.Vasikaran SD. Utility of biochemical markers of bone turnover and bone mineral density in management of osteoporosis. Crit Rev Clin Lab Sci. 2008. 45(2):221–258.
crossref
18.Tsanzi E., Light HR., Tou JC. The effect of feeding different sugar-sweetened beverages to growing female Sprague-Dawley rats on bone mass and strength. Bone. 2008. 42(5):960–968.
crossref
19.Felice JI., Gangoiti MV., Molinuevo MS., McCarthy AD., Cortizo AM. Effects of a metabolic syndrome induced by a fructose-rich diet on bone metabolism in rats. Metabolism. 2014. 63(2):296–305.
crossref
20.Li YQ., Xing XH., Wang H., Weng XL., Yu SB., Dong GY. Dose-dependent effects of genistein on bone homeostasis in rats' mandibular subchondral bone. Acta Pharmacol Sin. 2012. 33(1):66–74.
crossref
21.Piekarz AV., Ward WE. Effect of neonatal exposure to genistein on bone metabolism in mice at adulthood. Pediatr Res. 2007. 61(1):48–53.
crossref
22.Seidlová-Wuttke D., Jarry H., Jäger Y., Wuttke W. Bone development in female rats maintained with soy-free or soy-containing food as determined by computer-assisted tomography and serum bone markers. J Bone Miner Metab. 2008. 26(4):321–327.
crossref
23.Kretowicz M., Johnson RJ., Ishimoto T., Nakagawa T., Manitius J. The impact of fructose on renal function and blood pressure. Int J Nephrol. 2011. 2011:315879.
crossref
24.Mohamed Salih S., Nallasamy P., Muniyandi P., Periyasami V., Carani Venkatraman A. Genistein improves liver function and attenuates non-alcoholic fatty liver disease in a rat model of insulin resistance. J Diabetes. 2009. 1(4):278–287.
crossref
25.Nakagawa T., Hu H., Zharikov S., Tuttle KR., Short RA., Glushakova O., Ouyang X., Feig DI., Block ER., Herrera-Acosta J., Patel JM., Johnson RJ. A causal role for uric acid in fructose-induced metabolic syndrome. Am J Physiol Renal Physiol. 2006. 290(3):F625–F631.
crossref
26.Shih CC., Lin CH., Lin WL., Wu JB. Momordica charantia extract on insulin resistance and the skeletal muscle GLUT4 protein in fructose-fed rats. J Ethnopharmacol. 2009. 123(1):82–90.
crossref
27.Hamrick MW., Pennington C., Newton D., Xie D., Isales C. Leptin deficiency produces contrasting phenotypes in bones of the limb and spine. Bone. 2004. 34(3):376–383.
crossref
28.Douard V., Sabbagh Y., Lee J., Patel C., Kemp FW., Bogden JD., Lin S., Ferraris RP. Excessive fructose intake causes 1,25-(OH)(2)D (3)-dependent inhibition of intestinal and renal calcium transport in growing rats. Am J Physiol Endocrinol Metab. 2013. 304(12):E1303–E1313.
29.Douard V., Suzuki T., Sabbagh Y., Lee J., Shapses S., Lin S., Ferraris RP. Dietary fructose inhibits lactation-induced adaptations in rat 1,25-(OH)?D? synthesis and calcium transport. FASEB J. 2012. 26(2):707–721.
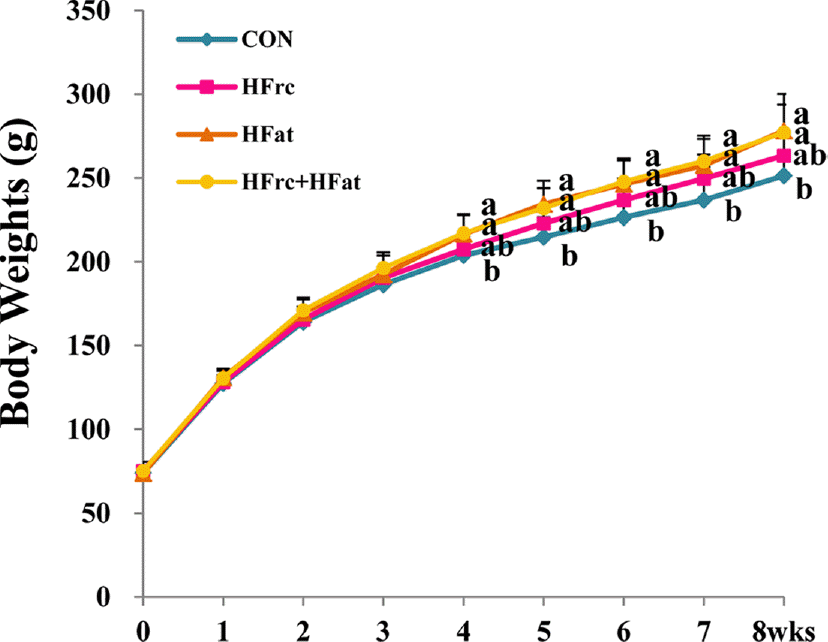
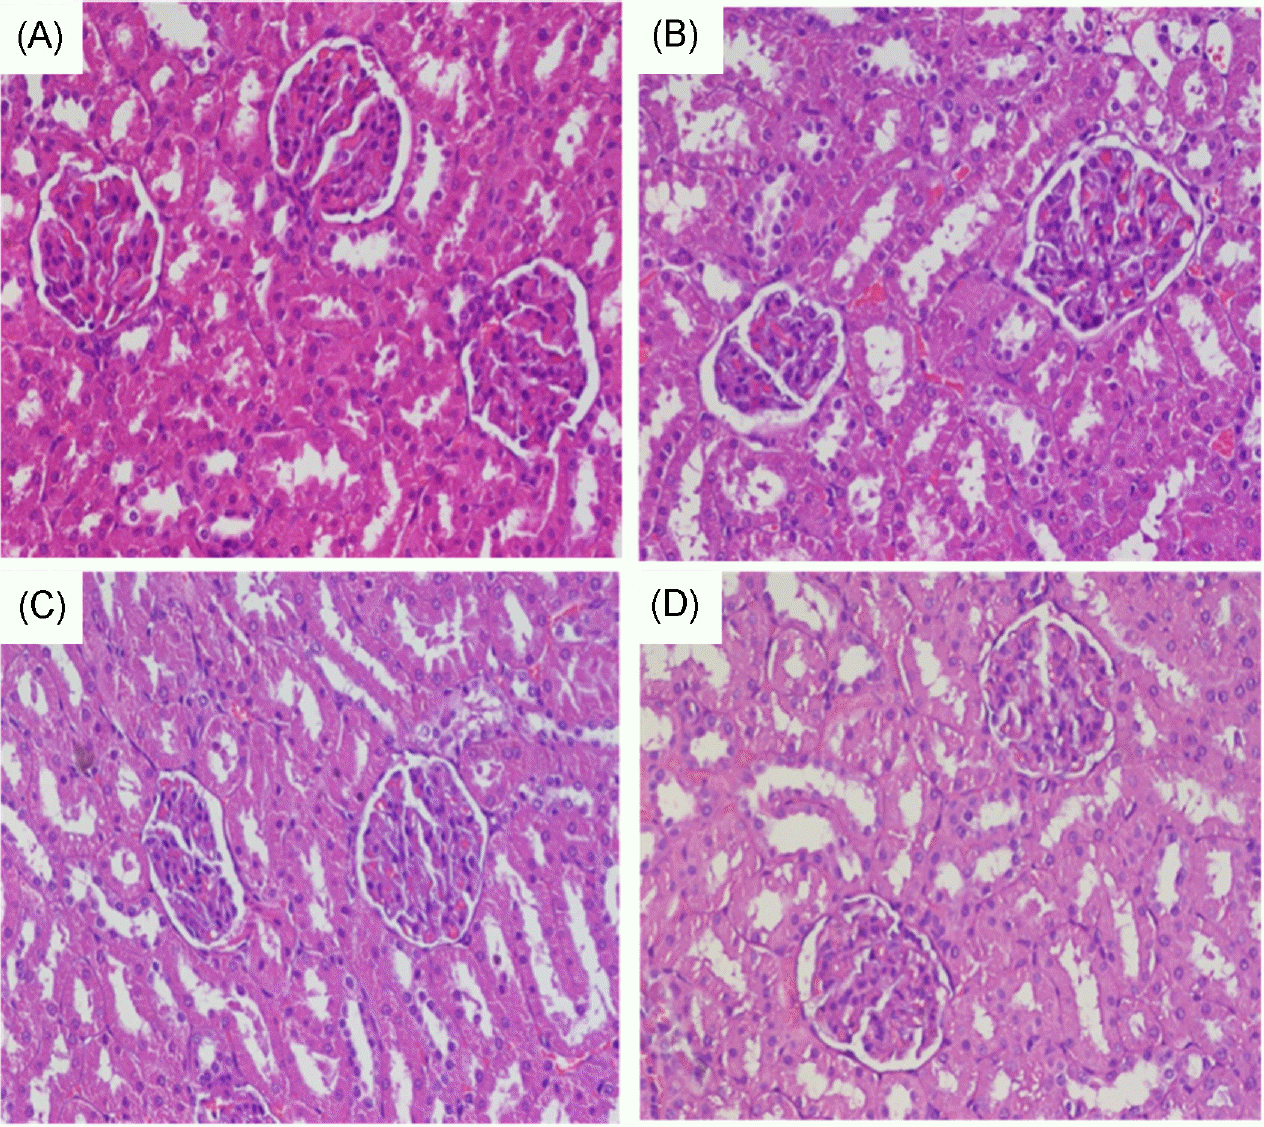
Fig. 1.
Changes of body weight of experimental groups during 8 weeks. CON: rats received control-diet based on AIN-93G (4.0 kcal/g diet), HFrc: rats received 30% fructose-diet based on control-diet (4.0 kcal/g diet), HFat: rats received 45 kcal% fat-diet (4.8 kcal/g diet), HFrc + HFat: rats received 45 kcal% fat-diet with 30% fructose (4.8 kcal/g diet)
jnh-48-381f1.tif
Fig. 2.
Photomicrograph of glomerulus in the experimental groups taken at 8 weeks, pertaining to the respective groups (A: CON, B: HFrc, C: HFat, D: HFrc + HFat). All experimental groups showed normal glomeruli and tubules. H&E stained glomeruli ×400. Magnification bars 40 µm. CON: rats received control-diet based on AIN-93G (4.0 kcal/g diet), HFrc: rats received 30% fructose-diet based on control-diet (4.0 kcal/g diet), HFat: rats received45 kcal% fat-diet (4.8 kcal/g diet), HFrc + HFat: rats received 45 kcal% fat-diet with 30% fructose (4.8 kcal/g diet)
jnh-48-381f2.tif
Fig. 3.
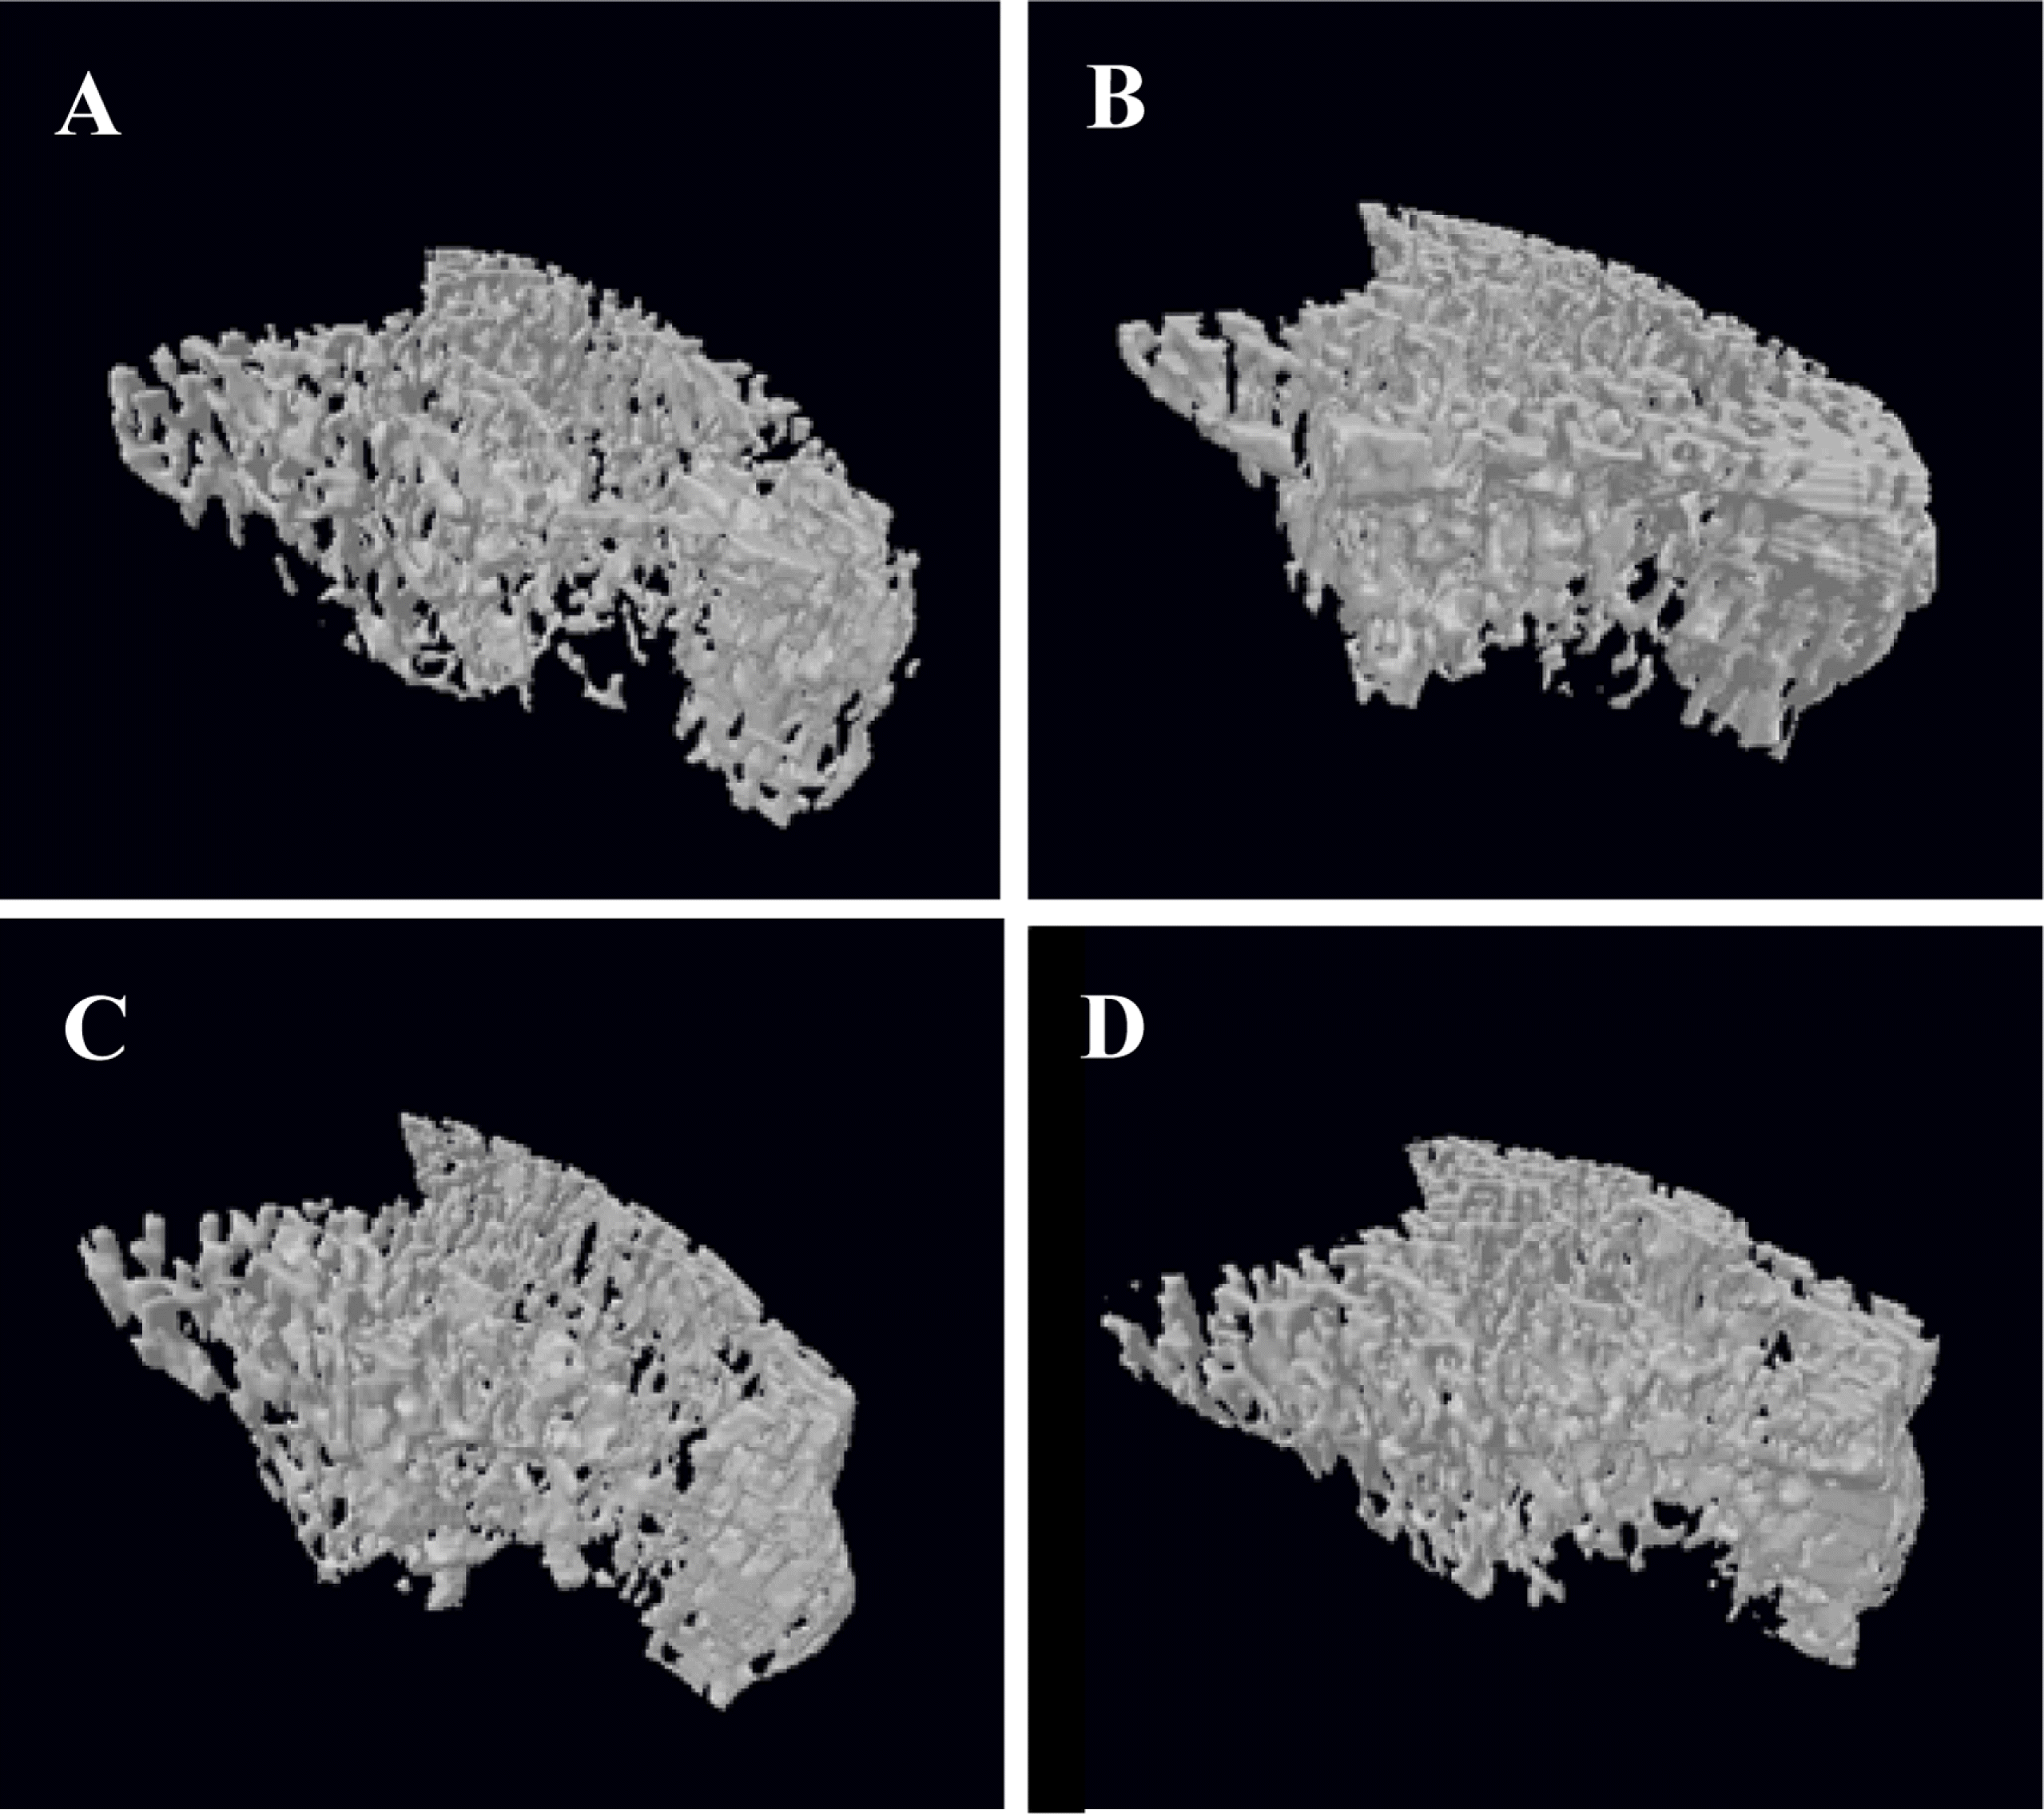
Representative 3D images of trabecular bone (right tibia)taken at 8 weeks, pertaining to the respective groups (A: CON, B: HFrc, C: HFat, D: HFrc + HFat), obtained with in vivo micro-computed tomography (micro-CT). Changes in structural parameters (BV/TV, BS/ BV, Tb.Th, Tb.Sp, Tb.N, Tb.Pf, SMI and BMD) of trabecular bone over eight weeks were quantified and shown in Table 3. CON: rats received control-diet based on AIN-93G (4.0 kcal/g diet), HFrc: rats received 30% fructose-diet based on control-diet (4.0 kcal/g diet), HFat: rats received45 kcal% fat-diet (4.8 kcal/g diet), HFrc + HFat: rats received 45 kcal% fat-diet with 30% fructose (4.8 kcal/g diet)
jnh-48-381f3.tif
Table 1.
Ingredient composition of experimental diets
  CON1) HFrc2) HFat3) HFrc + HFat4)
% gm Kcal gm Kcal gm Kcal gm Kcal
Protein 20 20 20 20 24 20 24 20
Carbohydrate 64 64 64 64 41 35 41 35
Fat 7 16 7 16 24 45 24 45
Total   100   100   100   100
Kcal/gm 4.0   4.0   4.8   4.8  
Ingredient gm Kcal gm Kcal gm Kcal gm Kcal
Casein, 80 Mesh 200 800 200 800 200 800 200 800
L-Cystine 3 12 3 12 3 12 3 12
Corn Starch 397.5 1 1,590 229.5 918 137 548 0 0
Maltodextrin 10 132 528 100 400 100 400 37 148
Sucrose 100 400 0 0 100 400 0 0
Fructose 0 0 300 1200 0 0 300 1200
Cellulose 50 0 50 0 50 0 50 0
Soybean Oil 70 630 70 630 26 234 26 234
t-Butylhydroquinone 0.014 0 0.014 0 0.014 0 0.014 0
Lard 0 0 0 0 174 1,566 174 1,566
Mineral Mix5) 35 0 35 0 35 0 35 0
Vitamin Mix6) 10 40 10 40 10 40 10 40
Choline Bitartrate 2.5 0 2.5 0 2.5 0 2.5 0
Total 1,000 4 4,000 1,000 4,000 837.5 4,000 837.5 4,000

1) CON: rats received control-diet based on AIN-93G (4.0 kcal/g diet)

2) HFrc: rats received 30% fructose-diet based on control-die (4.0 kcal/g diet)

3) HFat: rats received 45 kcal% fat-diet (4.8 kcal/g diet)

4) HFrc + HFat: rats received 45 kcal% fat-diet with 30% fructose (4.8 kcal/g diet)

Table 2.
Serum and urinary levels of bone biomarkers
  CON2) HFrc3) HFat4) HFrc + HFat5)
  (n = 8) (n = 8) (n = 8) (n = 8)
Serum OC6) (ng/ml) 17.4 ± 3.71)a 14.7 ± 1.0b 17.5 ± 1.6a 13.6 ± 2.2b
Urinary DPD7) (nmol/mmolCr8)) 190.8 ± 71.0 158.2 ± 50.4 183.5 ± 40.5 165.3 ± 28.8

1) Data are presented as means ± SD, statistical difference between the experimental groups based on one-way ANOVA and Duncan's multiple range tests at p < 0.05.

2) CON: rats received control-diet based on AIN-93G (4.0 kcal/g diet)

3) HFrc: rats received 30% fructose-diet based on control-diet (4.0 kcal/g diet)

4) HFat: rats received 45 kcal% fat-diet (4.8 kcal/g diet)

5) HFrc + HFat: rats received 45 kcal% fat-diet with 30% fructose (4.8 kcal/g diet)

6) OC: osteocalcin

7) DPD: deoxypyridinoline

8) Cr: creatinine

Table 3.
Architectural and mineralization parameters of the experimental groups
  CON2) HFrc3) HFat4) HFrc + HFat5)
  (n = 4) (n = 4) (n = 4) (n = 4)
Trabecular Bone
  BV/TV (%) 13.6 ± 4.31)b 19.4 ± 4.2ab 14.4 ± 1.4b 21.9 ± 4.3a
  BS/BV (mm) 43.1 ± 2.9 40.4 ± 3.5 42.9 ± 2.3 41.2 ± 6.8
  Tb.Th (mm) 0.09 ± 0.00 0.09 ± 0.01 0.09 ± 0.00 0.09 ± 0.01
  Tb.Sp (mm) 00.6 ± 0.2 00.4 ± 0.1 00.5 ± 0.1 00.4 ± 0.1
  Tb.N (mm) 01.6 ± 0.4b 02.1 ± 0.3ab 01.6 ± 0.1b 02.3 ± 0.4a
  Tb.Pf (1/mm) 12.5 ± 2.1a 09.7 ± 2.2ab 12.6 ± 1.3a 08.1 ± 2.5b
  SMI 02.1 ± 0.2 02.0 ± 0.2 02.2 ± 0.1 01.8 ± 0.2
  BMD 0.14 ± 0.04 0.15 ± 0.05 0.14 ± 0.01 0.15 ± 0.08
Cortical Bone
  BV (mm3) 07.9 ± 0.5b 07.7 ± 0.3b 08.6 ± 0.1a 08.5 ± 0.4a
  MMI (mm4) 11.3 ± 2.2 10.1 ± 0.8 12.0 ± 1.4 12.0 ± 1.0
  Cs.Th (mm) 0.34 ± 0.02 0.35 ± 0.03 0.38 ± 0.03 0.39 ± 0.02
  BMD (g/cm3) 0.94 ± 0.03 0.96 ± 0.03 0.96 ± 0.03 0.99 ± 0.02

1) Data are presented as means ± SD, statistical difference between the experimental groups based on one-way ANOVA and Duncan’ multiple range tests at p < 0.05.

2) CON: rats received control-diet based on AIN-93G (4.0 kcal/g diet)

3) HFrc: rats received 30% fructose-diet based on control-diet (4.0 kcal/g diet)

4) HFat: rats received 45 kcal% fat-diet (4.8 kcal/g diet)

5) HFrc + HFat: rat received 45 kcal% fat-diet with 30% fructose (4.8 kcal/g diet), BV/TV (%): bone volume fraction, BS/BV (mm): bone surface to volume Tb.Th (mm): trabecular thickness, Tb.N (mm): trabecular number, Tb.Sp (mm): trabecular separation, Tb.Pf (mm): trabecular pattern fac tor, SMI: structure model index, BMD (mg/cm3) : bone mineral density, BV (mm3) : bone volume, MMI (mm3) bone volume, MMI (mm4): mean polar moment of inertia, Cs.Th (mm): cross sectional thickness.

TOOLS
Similar articles