Abstract
Purpose
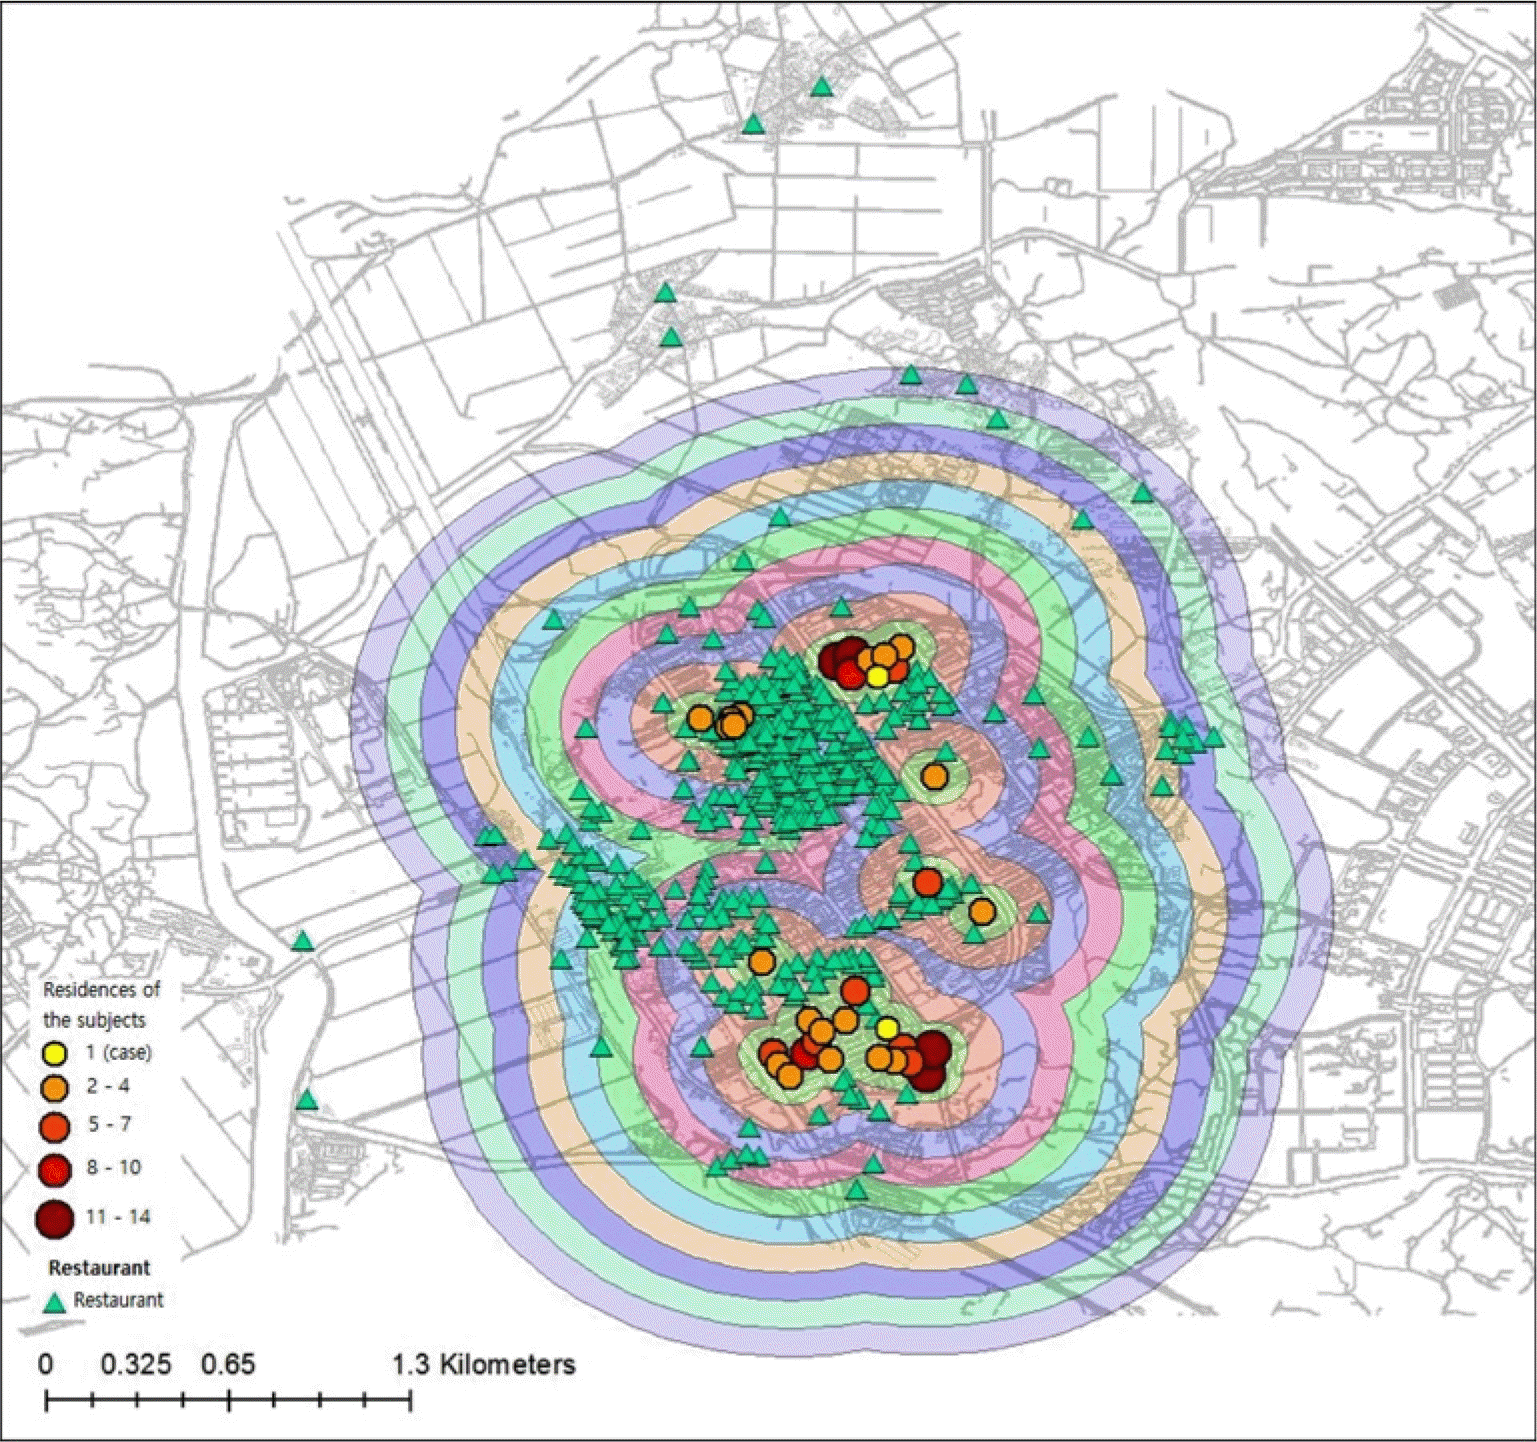
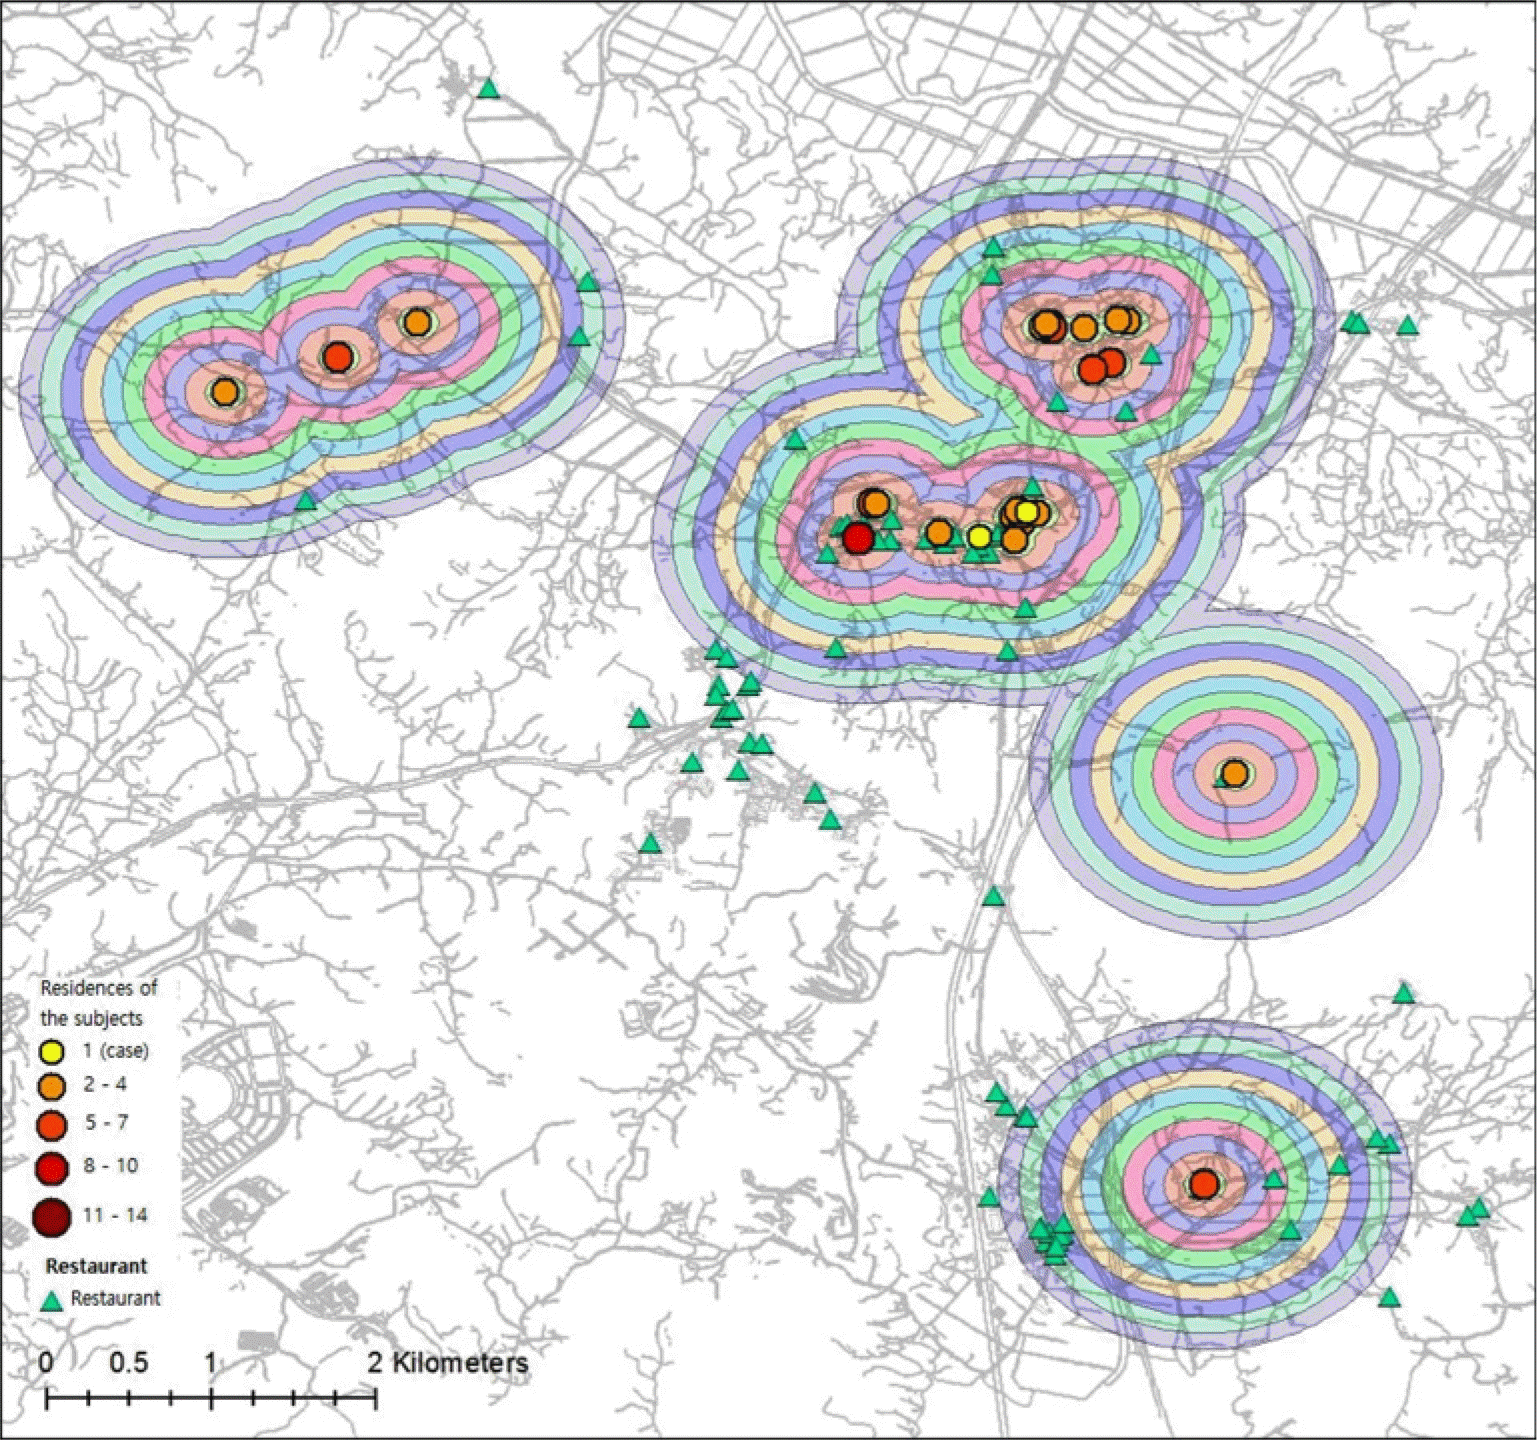
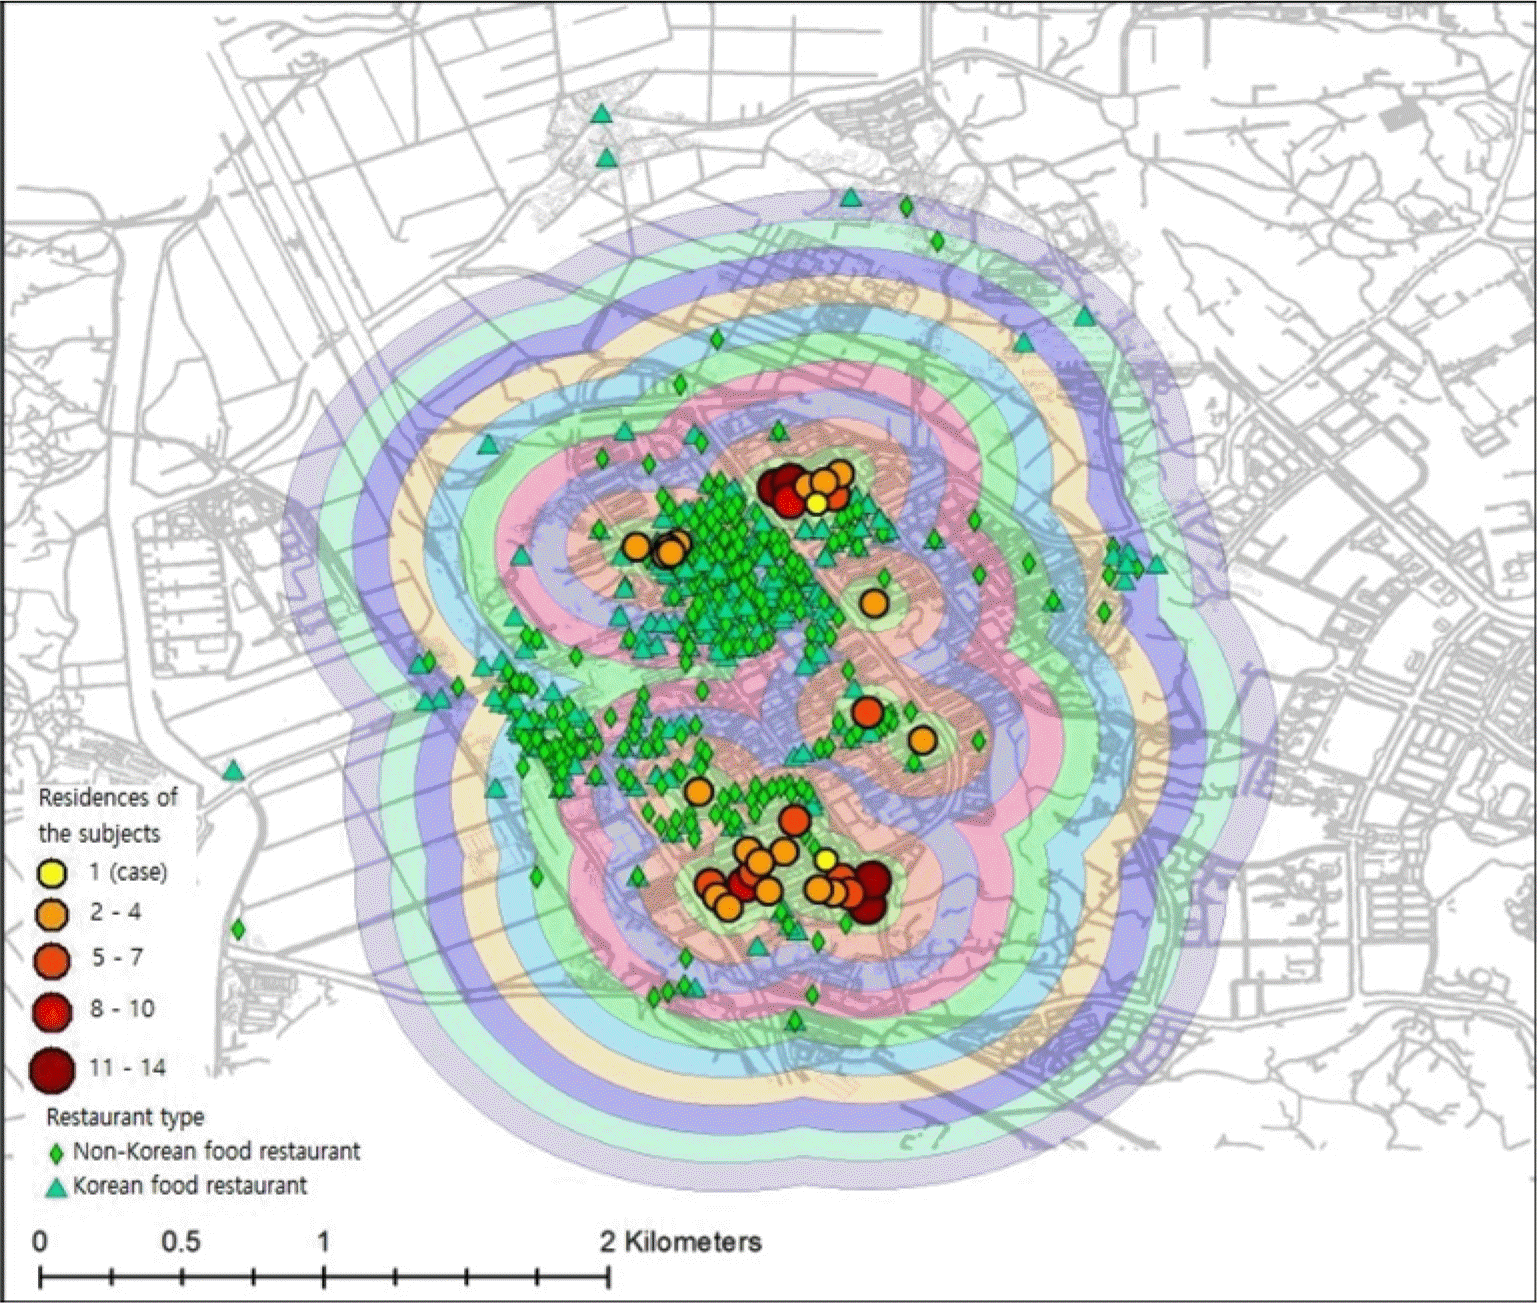
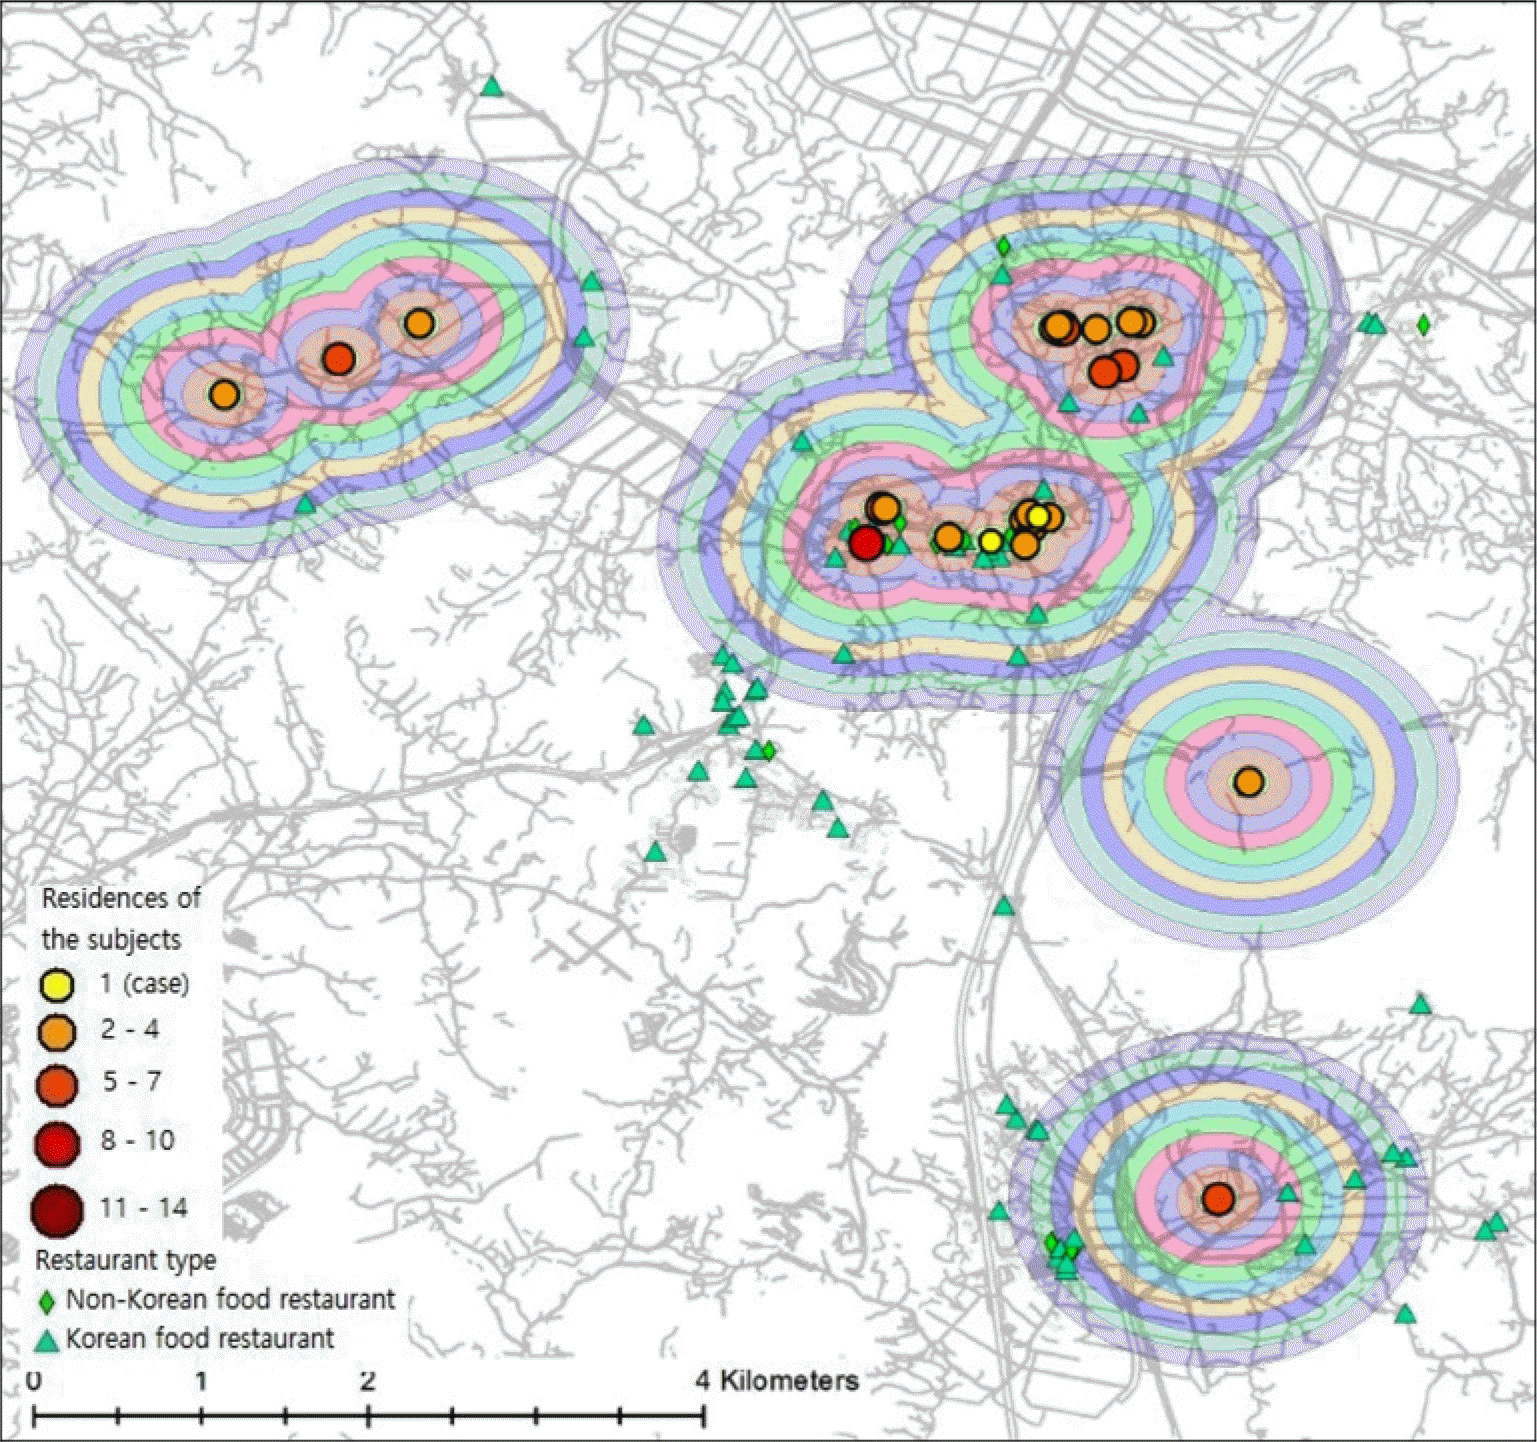
The purpose of this study was to measure accessibility and to examine distribution of restaurants in the local community. Methods: The target area of this study was two urban areas and a rural area in a city. We collected location information on all restaurants in target areas and classified all restaurants according to Korean food restaurants and Non-Korean food restaurants. We measured restaurant density per 100 m from the residences of the study population and calculated the distance of the nearest restaurant from the residences of the subjects using the Geographic Information System (GIS) analysis method. We compared the accessibility and distribution of restaurants in urban areas with that of the rural area, and compared the accessibility and distribution of Korean restaurants with that of Non-Korean restaurants. Results: Restaurants in urban areas were more dense than those in the rural area, and, in urban areas, restaurants were intensively distributed around the subjects' residence. Also, there were more Non-Korean food restaurants than Korean food restaurants in urban areas, and it was opposite in the rural area. Conclusion: It is important that we understood the current state of the restaurant environment in the local community using GIS analysis for the first time in the field of food environment. Further research is necessary on the association of restaurant environments and the dietary life of the population.
References
1. Glanz K, Sallis JF, Saelens BE, Frank LD. Healthy nutrition environments: concepts and measures. Am J Health Promot. 2005; 19(5):330–333. ii.

2. McKinnon RA, Reedy J, Morrissette MA, Lytle LA, Yaroch AL. Measures of the food environment: a compilation of the literature, 1990–2007. Am J Prev Med. 2009; 36(4 Suppl):S124–S133.
3. Galvez MP, Morland K, Raines C, Kobil J, Siskind J, Godbold J, Brenner B. Race and food store availability in an inner-city neighbourhood. Public Health Nutr. 2008; 11(6):624–631.

4. Moore LV, Diez Roux AV. Associations of neighborhood characteristics with the location and type of food stores. Am J Public Health. 2006; 96(2):325–331.

5. Morland K, Filomena S. Disparities in the availability of fruits and vegetables between racially segregated urban neighbourhoods. Public Health Nutr. 2007; 10(12):1481–1489.

6. Kipke MD, Iverson E, Moore D, Booker C, Ruelas V, Peters AL, Kaufman F. Food and park environments: neighborhood-level risks for childhood obesity in east Los Angeles. J Adolesc Health. 2007; 40(4):325–333.

7. Jeffery RW, Baxter J, McGuire M, Linde J. Are fast food restaurants an environmental risk factor for obesity? Int J Behav Nutr Phys Act. 2006; 3:2.

8. Statistics Korea. 2008 Korean statistical information service: an investigation of consumer prices [Internet]. Daejeon: Statistics Korea;2009. [cited 2014 Oct 20]. Available from:. http://www.kosis.kr.
9. Ministry of Health and Welfare, Korea Centers for Disease Control and Prevention. Korea Health Statistics 2012: Korea National Health and Nutrition Examination Survey (KNHANES V-3) [Internet]. Cheongwon: Korea Centers for Disease Control and Prevention;2013. [cited 2014 Oct 20]. Available from:. https://knhanes.cdc.go.kr/knhanes/index.do.
10. Korea Food Service Industry Management Institute. 2011 Korean food service yearbook. Seoul: Korea Food Service Industry Management Institute;2011.
11. Johnson RK, Appel LJ, Brands M, Howard BV, Lefevre M, Lustig RH, Sacks F, Steffen LM, Wylie-Rosett J. American Heart Association Nutrition Committee of the Council on Nutrition, Physical Activity, and Metabolism and the Council on Epidemiology and Prevention. Dietary sugars intake and cardiovascular health: a scientific statement from the American Heart Association. Circulation. 2009; 120(11):1011–1020.
12. Beegom R, Singh RB. Association of higher saturated fat intake with higher risk of hypertension in an urban population of Trivandrum in south India. Int J Cardiol. 1997; 58(1):63–70.

13. van Dam RM, Willett WC, Rimm EB, Stampfer MJ, Hu FB. Dietary fat and meat intake in relation to risk of type 2 diabetes in men. Diabetes Care. 2002; 25(3):417–424.

14. Giovannucci E, Rimm EB, Colditz GA, Stampfer MJ, Ascherio A, Chute CG, Willett WC. A prospective study of dietary fat and risk of prostate cancer. J Natl Cancer Inst. 1993; 85(19):1571–1579.

15. Krauss RM, Eckel RH, Howard B, Appel LJ, Daniels SR, Deckelbaum RJ, Erdman JW Jr, Kris-Etherton P, Goldberg IJ, Kotchen TA, Lichtenstein AH, Mitch WE, Mullis R, Robinson K, Wylie-Rosett J, St Jeor S, Suttie J, Tribble DL, Bazzarre TL. AHA Dietary Guidelines: revision 2000: A statement for healthcare professionals from the Nutrition Committee of the American Heart Association. Circulation. 2000; 102(18):2284–2299.
16. National Cancer Institute (US). Measures of the food environment [Internet]. Bethesda (MD): National Cancer Institute;2014. [cited 2014 Oct 20]. Available from:. http://appliedresearch.cancer.gov/mfe.
17. Rushton G. Public health, GIS, and spatial analytic tools. Annu Rev Public Health. 2003; 24:43–56.

18. Pearce J, Blakely T, Witten K, Bartie P. Neighborhood deprivation and access to fast-food retailing: a national study. Am J Prev Med. 2007; 32(5):375–382.
19. Kang M, Jung HJ, Joung H, Shim JE, Lee SE, Park YH, Paik HY. Development of Hansik database utilizing an expert focus group and assessment of Hansik effects on diet quality. Korean J Food Cult. 2014; 29(1):9–17.

20. Chae SW. Beneficial effects of Korean traditional diet in patients with hypertension and type 2 diabetes. Food Ind Nutr. 2011; 16(2):15–26.
21. Hur YI. Study on Korean food and obesity related to metabolic diseases. Food Ind Nutr. 2011; 16(2):34–44.
22. Lee MS. Health inequalities among Korean adults: socioeconomic status and residential area differences. Korean J Sociol. 2005; 39(6):183–209.
23. Yoon TH. Regional health inequalities in Korea the status and policy tasks. J Crit Soc Welf. 2010; 30:49–77.
24. Kim J. The changes in income-related health inequality and their influencing factors from 2005 to 2010. Korean Soc Secur Stud. 2012; 28(3):121–151.
25. Gang MS, Lee EH, Chyun JH. A study on the Korean traditional food consumption of the elementary schoolchildren in urban and rural area. Korean J Food Cult. 2006; 21(4):357–365.
26. Kim YK, Shin WS. A comparison study on perception of body image and dietary habits of high school students between urban and rural areas Korean J Community Nutr. 2008; 13(2):153–163.
27. Kwon WJ, Chang KJ, Kim SK. Comparison of nutrient intake, dietary behavior, perception of body image and iron nutritional status among female high school students of urban and rural areas in Kyunggi-do. Korean J Nutr. 2002; 35(1):90–101.
28. Statistics Korea. Korea standard industrial classification (KSIC) [Internet]. Daejeon: Statistics Korea;2008. [cited 2014 Jan 20]. Available from:. http://kssc.kostat.go.kr/ksscNew_web/index.jsp.
29. Small Enterprise and Market Service (KR). Business district information system [Internet]. Daejeon: Small Enterprise and Market Service;2014. [cited 2014 Jan 20]. Available from:. http://sg.kmdc.
30. National Spatial Information Clearinghouse (KR). National Spatial Information Clearinghouse [Internet]. Sejong: National Spatial Information Clearinghouse;2014. [cited 2014 Jan 20]. Available from:. https://www.nsic.go.kr.
31. Baicker K, Chandra A, Skinner JS. Geographic variation in health care and the problem of measuring racial disparities. Perspect Biol Med. 2005; 48(1 Suppl):S42–S53.

32. Pickle LW, Su Y. Within-state geographic patterns of health insurance coverage and health risk factors in the United States. Am J Prev Med. 2002; 22(2):75–83.

33. Obisesan TO, Vargas CM, Gillum RF. Geographic variation in stroke risk in the United States. Region, urbanization, and hypertension in the Third National Health and Nutrition Examination Survey. Stroke. 2000; 31(1):19–25.
34. Krieger N, Chen JT, Waterman PD, Soobader MJ, Subramanian SV, Carson R. Geocoding and monitoring of US socioeconomic inequalities in mortality and cancer incidence: does the choice of area-based measure and geographic level matter?: the Public Health Disparities Geocoding Project. Am J Epidemiol. 2002; 156(5):471–482.

35. Bellander T, Berglind N, Gustavsson P, Jonson T, Nyberg F, Pershagen G, Järup L. Using geographic information systems to assess individual historical exposure to air pollution from traffic and house heating in Stockholm. Environ Health Perspect. 2001; 109(6):633–639.

36. Yeom HA, Jung D, Choi M. Adherence to physical activity among older adults using a geographic information system: Korean National Health and Nutrition Examinations Survey IV. Asian Nurs Res. 5(2):118–127.

37. Ha EH, Kim O, Kim BM, Seo JH, Oh SY, Park HS, Kim YJ, Lee BE, Leem J, Hong Y. GIS based environmental surveillance of low birth weight in Korea. Epidemiology. 2006; 17(6):): S377.

38. Son S. Differential growth of urban-rural consolidated city through the changes of population size. J Korean Urban Geogr Soc. 2013; 16(1):85–98.
39. Garasky S, Morton LW, Greder K. The food environment and food insecurity: Perceptions of rural, suburban, and urban food pantry clients in Iowa. Fam Econ Rev. 2004; 16(2):41–48.
40. Dean WR, Sharkey JR. Rural and urban differences in the associations between characteristics of the community food environment and fruit and vegetable intake. J Nutr Educ Behav. 2011; 43(6):426–433.

41. Chung SJ, Kang SH, Song SM, Ryu SH, Yoon J. Nutritional quality of Korean adults' consumption of lunch prepared at home, commercial places, and institutions: analysis of the data from the 2001 National Health and Nutrition Survey. Korean J Nutr. 2006; 39(8):841–849.
42. Suh Y, Kang J, Kim H, Chung YJ. Comparison of nutritional status of the Daejeon metropolitan citizens by frequency of eating out. Korean J Nutr. 2010; 43(2):171–180.

43. Lee HS. Studies on salt intake through eat-out foods in Andong area. Korean J Soc Food Sci. 1997; 13(3):314–318.
44. National Academy of Agricultural Science. Hansik and health. Paju: Kyomunsa;2010.
Table 1.
Distribution of restaurants of urban and rural area
Table 2.
Distribution of the Korean food restaurants and non Korean food restaurants by area type


 PDF
PDF ePub
ePub Citation
 Print
Print


 XML Download