

 PDF
PDF ePub
ePub Citation
 Print
Print


Abstract
Purpose
Methods
Results
Figures and Tables
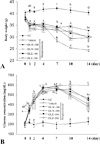 | Fig. 1Change in body weight and glucose concentration following DLW and DLE treatment. (A) Body weight of the mice in the 6 groups was measured using a chemical balance after the final DLW and DLE treatment. (B) The mice were treated orally with DLW and DLE (100, 200 mg/kg body weight/day) for 2 weeks. The glucose concentration was measured in the blood collected from the tail vein of mice at seven different times using the sensitive strip of the Blood Glucose Monitoring System The control group received the vehicle only. Data are reported as the mean ± SD from 3 replicates. a~dMeans with the different letters are significantly different (p < 0.05) by Duncan's multiple range test. A statistically significant difference for specific level in some groups was represented as a group within Dash-lined box. NC, normal control; STZ/DLW-100, streptozotocin/water extract of leaf-100 mg/kg; STZ/DLW-200, streptozotocin/water extract of leaf-200 mg/kg; STZ/DLE-100, streptozotocin/ethanol extract of leaf-100 mg/kg; STZ/DLE-200, streptozotocin/ethanol extract of leaf-200 mg/kg.
|
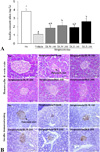 | Fig. 2Change in insulin concentration and the morphology of pancreatic islet following DLW and DLE treatment. (A) The insulin concentration was detected in the serum of streptozotocin-induced diabetic model animals on the final day. This kit has 0.1 ng/mL of sensitivity and inter-assay coefficient of variation was in the 2.86-5.17 range. Data are reported as the mean ± SD from 3 replicates. a~cMeans with the different letters are significantly different (p < 0.05) by Duncan's multiple range test. (B) Histological analysis and immunostaining analysis for insulin expression. The expression level of insulin was detected in the pancreatic islets of STZ/vehicle treated mice by immunostaining analysis. A high intensity was observed in the pancreatic islets of the DLW or DLE treated mice compared with the STZ/vehicle treated mice at 200x magnification.NC, normal control; STZ/DLW-100, streptozotocin/water extract of leaf-100 mg/kg; STZ/DLW-200, streptozotocin/water extract of leaf-200 mg/kg; STZ/DLE-100, streptozotocin/ethanol extract of leaf-100 mg/kg; STZ/DLE-200, streptozotocin/ethanol extract of leaf-200 mg/kg.
|
Table 1
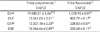
1) Milligrams of total polyphenol content/g of plants based on gallic acid as standard. 2) Milligrams of total flavonoid content/g of plants based on quercetin as standard. 3) Each value is mean ± S.D. (n ≥ 3).
a~d Means with the different letters are significantly different (p < 0.05) by Duncan's multiple range test.
DLW, water extract of leaf; DLE, the ethanol extract of leaf; DSW, water extract of stem; DSE, ethanol extract of stem.
![]()
Table 2
![]()
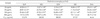
Table 3
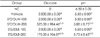
Values are mean ± SD(n=6).
a~b Means with the different letters are significantly different (p < 0.05) by Duncan's multiple range test.
NC, normal control; STZ/DLW-100, streptozotocin/water extract of leaf-100 mg/kg; STZ/DLW-200, streptozotocin/water extract of leaf-200 mg/kg; STZ/DLE-100, streptozotocin/ethanol extract of leaf-100 mg/kg; STZ/DLE-200, streptozotocin/ethanol extract of leaf-200 mg/kg.
![]()
 XML Download