Abstract
Breast cancer is the most common malignancy in women, both in the developed and developing countries. Anthocyanins are natural coloring of a multitude of foods, such as berries, grapes or cherries. Glycosides of the aglycons delphinidin represent the most abundant anthocyanins in fruits. Delphinidin has recently been reported to inhibit the growth of human tumor cell line. Also, delphinidin is a powerful antioxidant that reportedly exerts beneficial effects in patients with advanced cancer by reducing the level of reactive oxygen species and increasing glutathion peroxidase activity. This study investigates the effects of delphinidin on protein ErbB2, ErbB3 and Akt expressions associated with cell proliferation and Bcl-2, Bax protein associated with cell apoptosis in MDA-MB-231 human breast cancer cell line. MDA-MB-231 cells were cultured with various concentrations (0, 5, 10, and 20 μ mol/L) of delphinidin. Delphinidin inhibited breast cancer cell growth in a dose dependent manner (p < 0.05). ErbB2 and ErbB3 expressions were markdly lower 5 μ mol/L delphinidin (p < 0.05). In addition, total Akt and phosphorylated Akt levels were decreased dose-dependently in cells treated with delphinidin (p < 0.05). Futher, Bcl-2 levels were dose-dependently decreased and Bax expression was significantly increased in cells treated with delphinidin (p < 0.05). In conclusion, I have shown that delphinidin inhibits cell growth, proliferation and induces apoptosis in MDA-MB-231 human breast cancer cell lines. (J Nutr Health 2013; 46(6): 503 – 510)
References
1). National Health Insurance Service (KR). Analysis of cancer patients in 2008 [Internet]. Seoul: National Health Insurance Service;2010. [cited 2010 Jun 5]. Available from:. http://www.nhis.or.kr/cms/board/board/Board.jsp?act=VIEW&communityKey=B0070&boardId=20108.
2). National Cancer Information Center (KR). Types of breast cancer [Internet]. Goyang: National Cancer Information Center;2013. [cited 2013 February 1]. Available from:. http://www.cancer.go.kr/mbs/cancer/jsp/cancer/cancer.jsp?cancerSeq=4757&menuSeq=4761&viewType=all&id=cancer_020112000000.
3). Korean Breast Cancer Society. Breast cancer facts & figures 2006–2008. Seoul: Korean Breast Cancer Society;2008.
4). Doll R, Peto R. The causes of cancer: quantitative estimates of avoidable risks of cancer in the United States today. J Natl Cancer Inst. 1981; 66(6):1191–1308.

5). Wu C, Ray RM, Lin MG, Gao DL, Horner NK, Nelson ZC, Lampe JW, Hu YW, Shannon J, Stalsberg H, Li W, Fitzgibbons D, Porter P, Patterson RE, Satia JA, Thomas DB. A case-control study of risk factors for fibrocystic breast conditions: Shanghai Nutrition and Breast Disease Study, China, 1995–2000. Am J Epidemiol. 2004; 160(10):945–960.

6). Magee PJ, McGlynn H, Rowland IR. Differential effects of isoflavones and lignans on invasiveness of MDA-MB-231 breast cancer cells in vitro. Cancer Lett. 2004; 208(1):35–41.

7). Schley PD, Jijon HB, Robinson LE, Field CJ. Mechanisms of omega-3 fatty acid-induced growth inhibition in MDA-MB-231 human breast cancer cells. Breast Cancer Res Treat. 2005; 92(2):187–195.

8). Klass CM, Shin DM. Current status and future perspectives of chemoprevention in head and neck cancer. Curr Cancer Drug Targets. 2007; 7(7):623–632.

9). Lila MA. From beans to berries and beyond: teamwork between plant chemicals for protection of optimal human health. Ann N Y Acad Sci. 2007; 1114:372–380.

10). Harborne JB. Comparative biochemistry of the flavonoids. New York (NY): Academic Press;1967.
11). Bae EA, Moon GS. A study on the antioxidative activities of Korean soybeans. J Korean Soc Food Sci Nutr. 1997; 26(2):203–208.
12). Ding M, Feng R, Wang SY, Bowman L, Lu Y, Qian Y, Castrano-va V, Jiang BH, Shi X. Cyanidin-3-glucoside, a natural product derived from blackberry, exhibits chemopreventive and chemotherapeutic activity. J Biol Chem. 2006; 281(25):17359–17368.

13). Hou DX. Potential mechanisms of cancer chemoprevention by anthocyanins. Curr Mol Med. 2003; 3(2):149–159.

14). Katsube N, Iwashita K, Tsushida T, Yamaki K, Kobori M. Induction of apoptosis in cancer cells by Bilberry (Vaccinium myrtil-lus) and the anthocyanins. J Agric Food Chem. 2003; 51(1):68–75.

15). Yoon TH, Lee SW. Stability of anthocyanins in foods. Korean J Food Sci Technol. 1979; 11(1):63–73.
16). Kong JM, Chia LS, Goh NK, Chia TF, Brouillard R. Analysis and biological activities of anthocyanins. Phytochemistry. 2003; 64(5):923–933.

17). Chu SK, Seo EY, Kim WK, Kang NE. Effect of cyanidin on cell motility and invasion in MDA-MB-231 human breast cancer cells. Korean J Nutr. 2008; 41(8):711–717.
18). Li L, Adams LS, Chen S, Killian C, Ahmed A, Seeram NP. Euge-nia jambolana Lam. Berry extract inhibits growth and induces apoptosis of human breast cancer but not non-tumorigenic breast cells. J Agric Food Chem. 2009; 57(3):826–831.

19). Hui C, Bin Y, Xiaoping Y, Long Y, Chunye C, Mantian M, Wen-hua L. Anticancer activities of an anthocyanin-rich extract from black rice against breast cancer cells in vitro and in vivo. Nutr Cancer. 2010; 62(8):1128–1136.

20). Weng MS, Ho CT, Ho YS, Lin JK. Theanaphthoquinone inhibits fatty acid synthase expression in EGF-stimulated human breast cancer cells via the regulation of EGFR/ErbB-2 signaling. Toxicol Appl Pharmacol. 2007; 218(2):107–118.

21). Seo EY, Lee HS, Kim WK. Effect of [6]-gingerol on inhibition of cell proliferation in MDA-MB-231 human breast cancer cells. Korean J Nutr. 2005; 38(8):656–662.
22). Landesberg R, Cozin M, Cremers S, Woo V, Kousteni S, Sinha S, Garrett-Sinha L, Raghavan S. Inhibition of oral mucosal cell wound healing by bisphosphonates. J Oral Maxillofac Surg. 2008; 66(5):839–847.

23). Meiers S, Kemény M, Weyand U, Gastpar R, von Angerer E, Marko D. The anthocyanidins cyanidin and delphinidin are potent inhibitors of the epidermal growth-factor receptor. J Agric Food Chem. 2001; 49(2):958–962.

24). Zhang Y, Vareed SK, Nair MG. Human tumor cell growth inhibition by nontoxic anthocyanidins, the pigments in fruits and vegetables. Life Sci. 2005; 76(13):1465–1472.

25). Martin S, Andriambeloson E, Takeda K, Andriantsitohaina R. Red wine polyphenols increase calcium in bovine aortic endothelial cells: a basis to elucidate signalling pathways leading to nitric oxide production. Br J Pharmacol. 2002; 135(6):1579–1587.

26). Koide T, Hashimoto Y, Kamei H, Kojima T, Hasegawa M, Terabe K. Antitumor effect of anthocyanin fractions extracted from red soybeans and red beans in vitro and in vivo. Cancer Biother Ra-diopharm. 1997; 12(4):277–280.

27). Marko D, Puppel N, Tjaden Z, Jakobs S, Pahlke G. The substitution pattern of anthocyanidins affects different cellular signaling cascades regulating cell proliferation. Mol Nutr Food Res. 2004; 48(4):318–325.

28). Sainsbury JR, Malcolm AJ, Appleton DR, Farndon JR, Harris AL. Presence of epidermal growth factor receptor as an indicator of poor prognosis in patients with breast cancer. J Clin Pathol. 1985; 38(11):1225–1228.

29). Sainsbury JR, Farndon JR, Needham GK, Malcolm AJ, Harris AL. Epidermal-growth-factor receptor status as predictor of early recurrence of and death from breast cancer. Lancet. 1987; 1(8547):1398–1402.
30). Koenders PG, Beex LV, Geurts-Moespot A, Heuvel JJ, Kienhuis CB, Benraad TJ. Epidermal growth factor receptor-negative tumors are predominantly confined to the subgroup of estradiol receptor-positive human primary breast cancers. Cancer Res. 1991; 51(17):4544–4548.
31). Slamon DJ, Clark GM, Wong SG, Levin WJ, Ullrich A, McGuire WL. Human breast cancer: correlation of relapse and survival with amplification of the HER-2/neu oncogene. Science. 1987; 235(4785):177–182.
32). Slamon DJ, Godolphin W, Jones LA, Holt JA, Wong SG, Keith DE, Levin WJ, Stuart SG, Udove J, Ullrich A, Press MF. Studies of the HER-2/neu proto-oncogene in human breast and ovarian cancer. Science. 1989; 244(4905):707–712.
33). Toi M, Osaki A, Yamada H, Toge T. Epidermal growth factor receptor expression as a prognostic indicator in breast cancer. Eur J Cancer. 1991; 27(8):977–980.

34). De Potter CR, Beghin C, Makar AP, Vandekerckhove D, Roels HJ. The neu-oncogene protein as a predictive factor for haematogenous metastases in breast cancer patients. Int J Cancer. 1990; 45(1):55–58.
35). Gusterson BA, Machin LG, Gullick WJ, Gibbs NM, Powles TJ, Elliott C, Ashley S, Monaghan P, Harrison S. c-erbB-2 expression in benign and malignant breast disease. Br J Cancer. 1988; 58(4):453–457.

36). Sweeney C, Fambrough D, Huard C, Diamonti AJ, Lander ES, Cantley LC, Carraway KL 3rd. Growth factor-specific signaling pathway stimulation and gene expression mediated by ErbB receptors. J Biol Chem. 2001; 276(25):22685–22698.

37). Crovello CS, Lai C, Cantley LC, Carraway KL 3rd. Differential signaling by the epidermal growth factor-like growth factors neu-regulin-1 and neuregulin-2. J Biol Chem. 1998; 273(41):26954–26961.

38). Tzahar E, Pinkas-Kramarski R, Moyer JD, Klapper LN, Alroy I, Levkowitz G, Shelly M, Henis S, Eisenstein M, Ratzkin BJ, Sela M, Andrews GC, Yarden Y. Bivalence of EGF-like ligands drives the ErbB signaling network. EMBO J. 1997; 16(16):4938–4950.

39). Graus-Porta D, Beerli RR, Daly JM, Hynes NE. ErbB-2, the preferred heterodimerization partner of all ErbB receptors, is a mediator of lateral signaling. EMBO J. 1997; 16(7):1647–1655.

40). Franke TF, Kaplan DR, Cantley LC. PI3K: downstream AKTion blocks apoptosis. Cell. 1997; 88(4):435–437.

41). Meyskens FL Jr, Szabo E. Diet and cancer: the disconnect between epidemiology and randomized clinical trials. Cancer Epidemiol Biomarkers Prev. 2005; 14(6):1366–1369.

42). Ramos S, Alía M, Bravo L, Goya L. Comparative effects of food-derived polyphenols on the viability and apoptosis of a human hepatoma cell line (HepG2). J Agric Food Chem. 2005; 53(4):1271–1280.

43). Heo HJ, Lee CY. Strawberry and its anthocyanins reduce oxidative stress-induced apoptosis in PC12 cells. J Agric Food Chem. 2005; 53(6):1984–1989.

44). Tessitore L, Davit A, Sarotto I, Caderni G. Resveratrol depresses the growth of colorectal aberrant crypt foci by affecting bax and p21 (CIP) expression. Carcinogenesis. 2000; 21(8):1619–1622.
45). Bunz F, Hwang PM, Torrance C, Waldman T, Zhang Y, Dillehay L, Williams J, Lengauer C, Kinzler KW, Vogelstein B. Disruption of p53 in human cancer cells alters the responses to therapeutic agents. J Clin Invest. 1999; 104(3):263–269.

46). Afaq F, Syed DN, Malik A, Hadi N, Sarfaraz S, Kweon MH, Khan N, Zaid MA, Mukhtar H. Delphinidin, an anthocyanidin in pigmented fruits and vegetables, protects human HaCaT keratinocytes and mouse skin against UVB-mediated oxidative stress and apoptosis. J Invest Dermatol. 2007; 127(1):222–232.

Fig. 1.
Effect of delphinidin on cell proliferation in MDA-MB-231 cells. MDA-MB-231 cells were plated at a density of 2.5 × 10⁴ cells/ml in 24 well plate with DMEM/F12 supplemented with 10% FBS for 48 hour, the monolayers were serum-starved with DMEM/F12 supplemented with 5 μ g/mL transferrin, 5 μ g/mL selenium, and 1 mg/mL bovine serum albumin for 24 hour. After serum starvation, the mo-nolayer were incubated in serum free medium with 0, 5, 10, 20 μ M delphinidin. Viable cell numbers were estimated by the MTT assay. Each bar represents the mean ± SE from three independent experiments. Comparison among different concentrations of delphinidin that yielded significant differences (p < 0.05) are indicated by different letters above each bar.

Fig. 2.
Effects of delphinidin on ErbB2 expression in MDA-MB-231 cells. Cell lysates were subjected to immunoblotting with an antibody against ErbB2 and β-actin. A: The photographs of chemiluminescent detection of the blots, which were representative of three independent experiments are shown. B: Quantitative analysis of immunoblots. The relative abundance of each band was estimated by densitometric scanning of the exposed films. Each bar represents the mean ± SE (n = 3). Comparisons between groups that yielded significant differences (p < 0.05) are indicated by different letters above each bar.
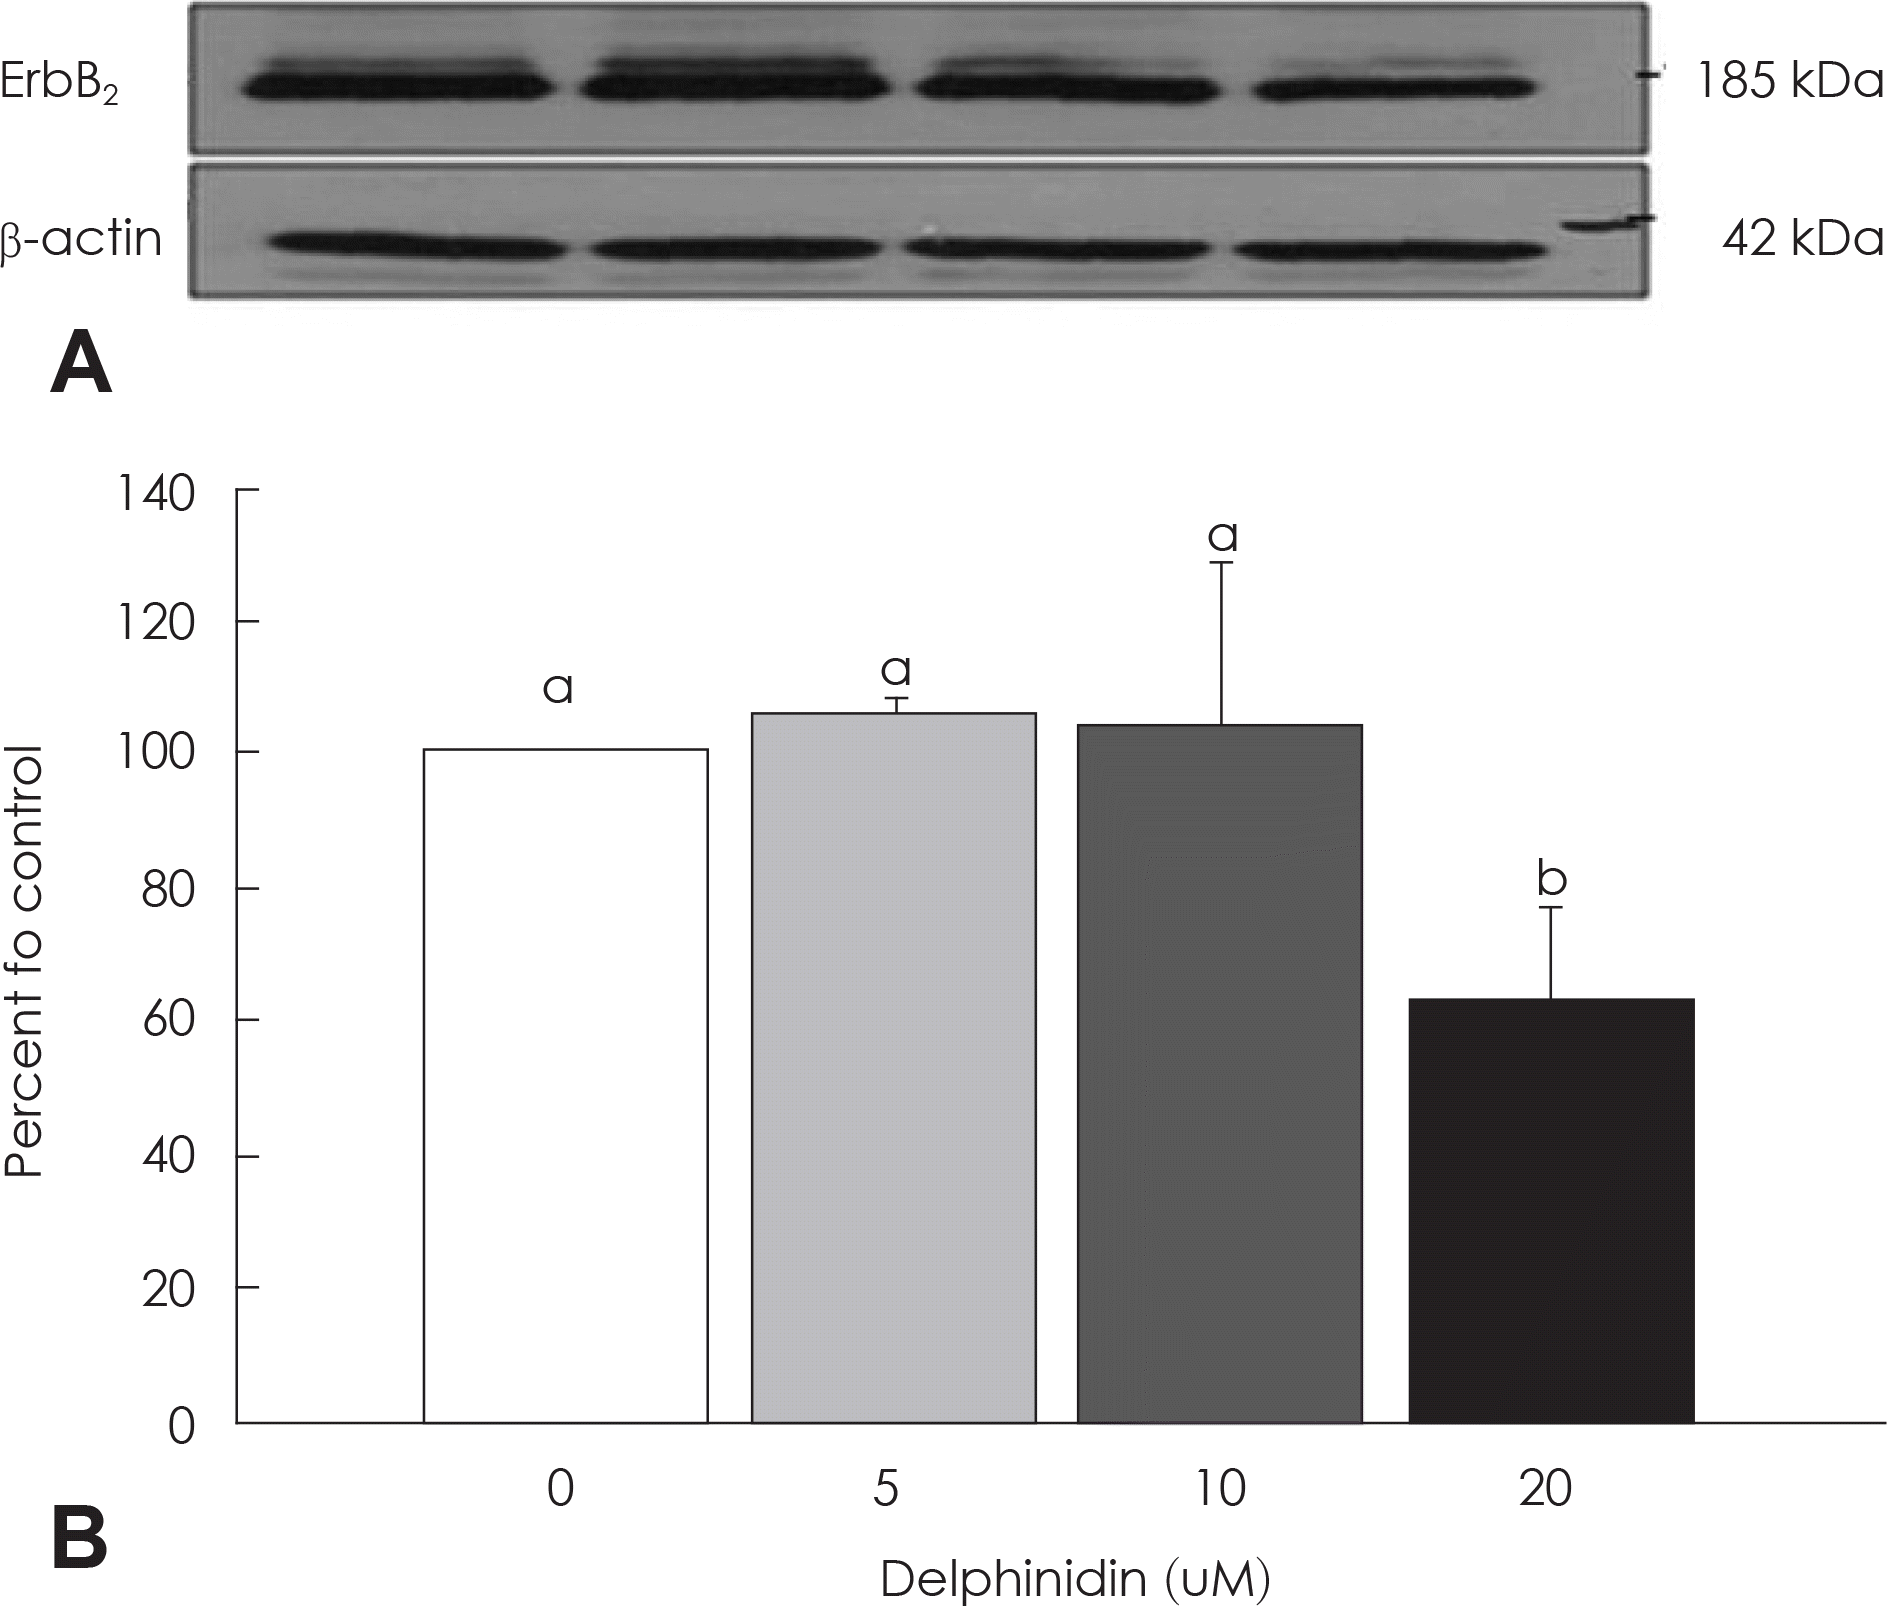
Fig. 3.
Effects of delphinidin on ErbB3 expression in MDA-MB-231 cells. MDA-MB-231 cells were treated with delphinidin for 48 hr as described in Fig. 1. Cell lysates were subjected to immunoblotting with an antibody against ErbB3 and β-actin. A: The photographs of chemiluminescent detection of the blots, which were representative of three independent experiments are shown. B: Quanti-tative analysis of immunoblots. The relative abundance of each band was estimated by densitometric scanning of the exposed films. Each bar represents the mean ± SE (n = 3). Comparisons between groups that yielded significant differences (p < 0.05) are indicated by different letters above each bar.
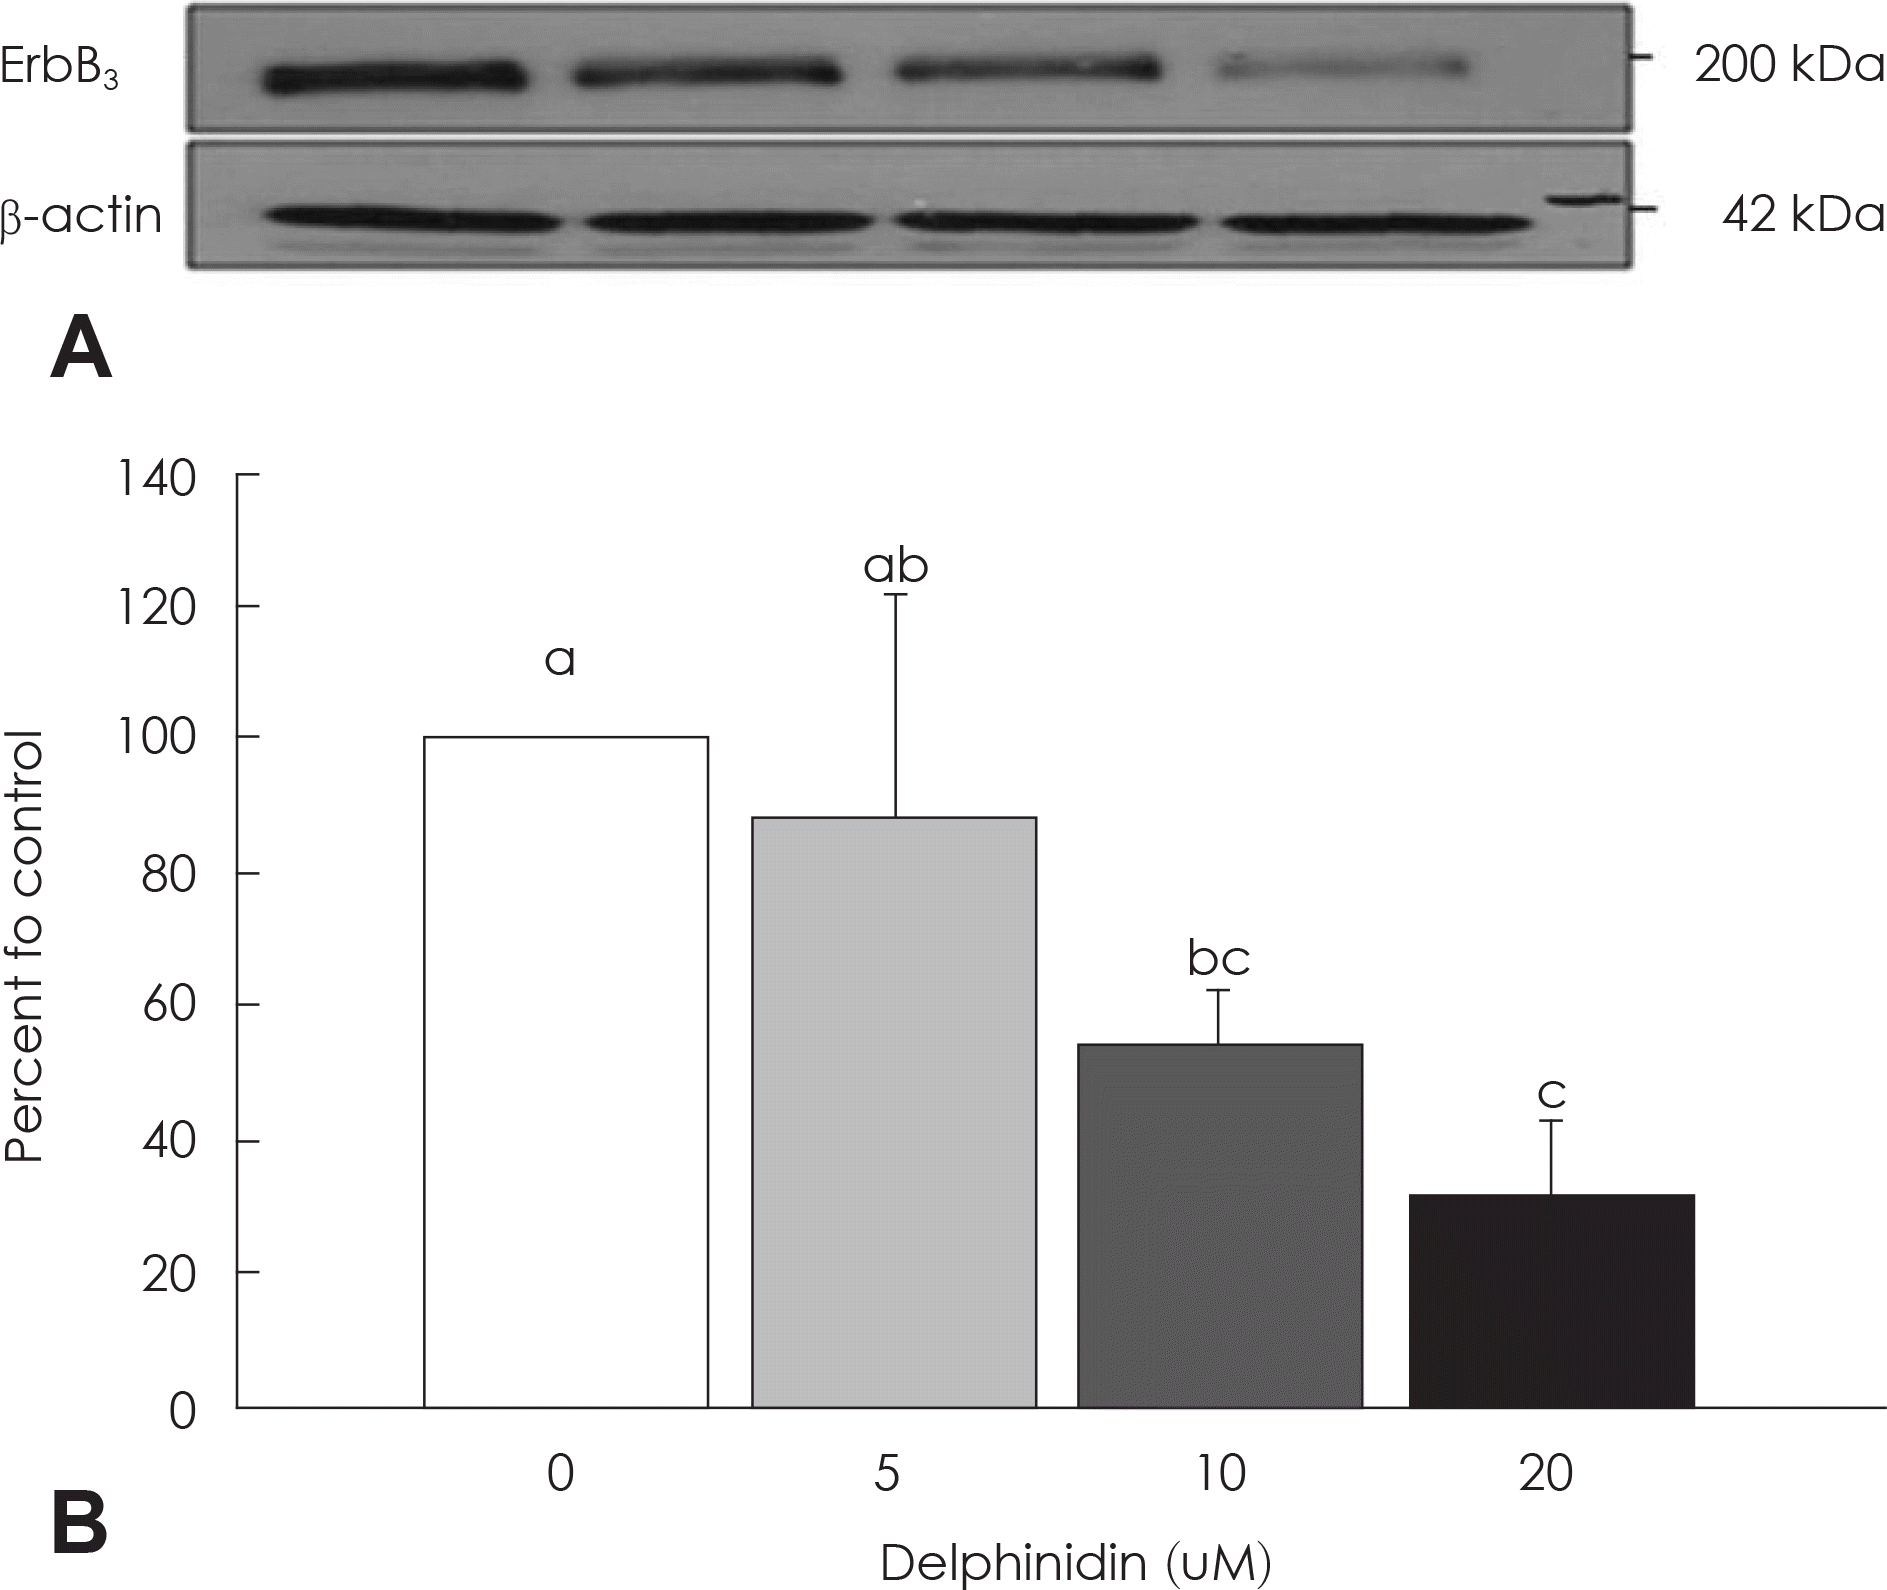
Fig. 4.
Effects of delphinidin on Akt expression in MDA-MB-231 cells. Cells were treated as described in Fig. 1 and protein samples were analyzed by immunoblotting with anti-Akt protein antiboby or β-actin. A: The photographs of chemiluminescent detection of the blots, which are representative of three independent experiments, are shown. B: Quantitative analysis of immunoblots. The relative change in Akt band on Western blots was quantitated by densitometric analysis. Each bar represents the mean ± SE (n = 3). Comparisons between groups that yielded significant differences (p < 0.05) are indicated by different letters above each bar.
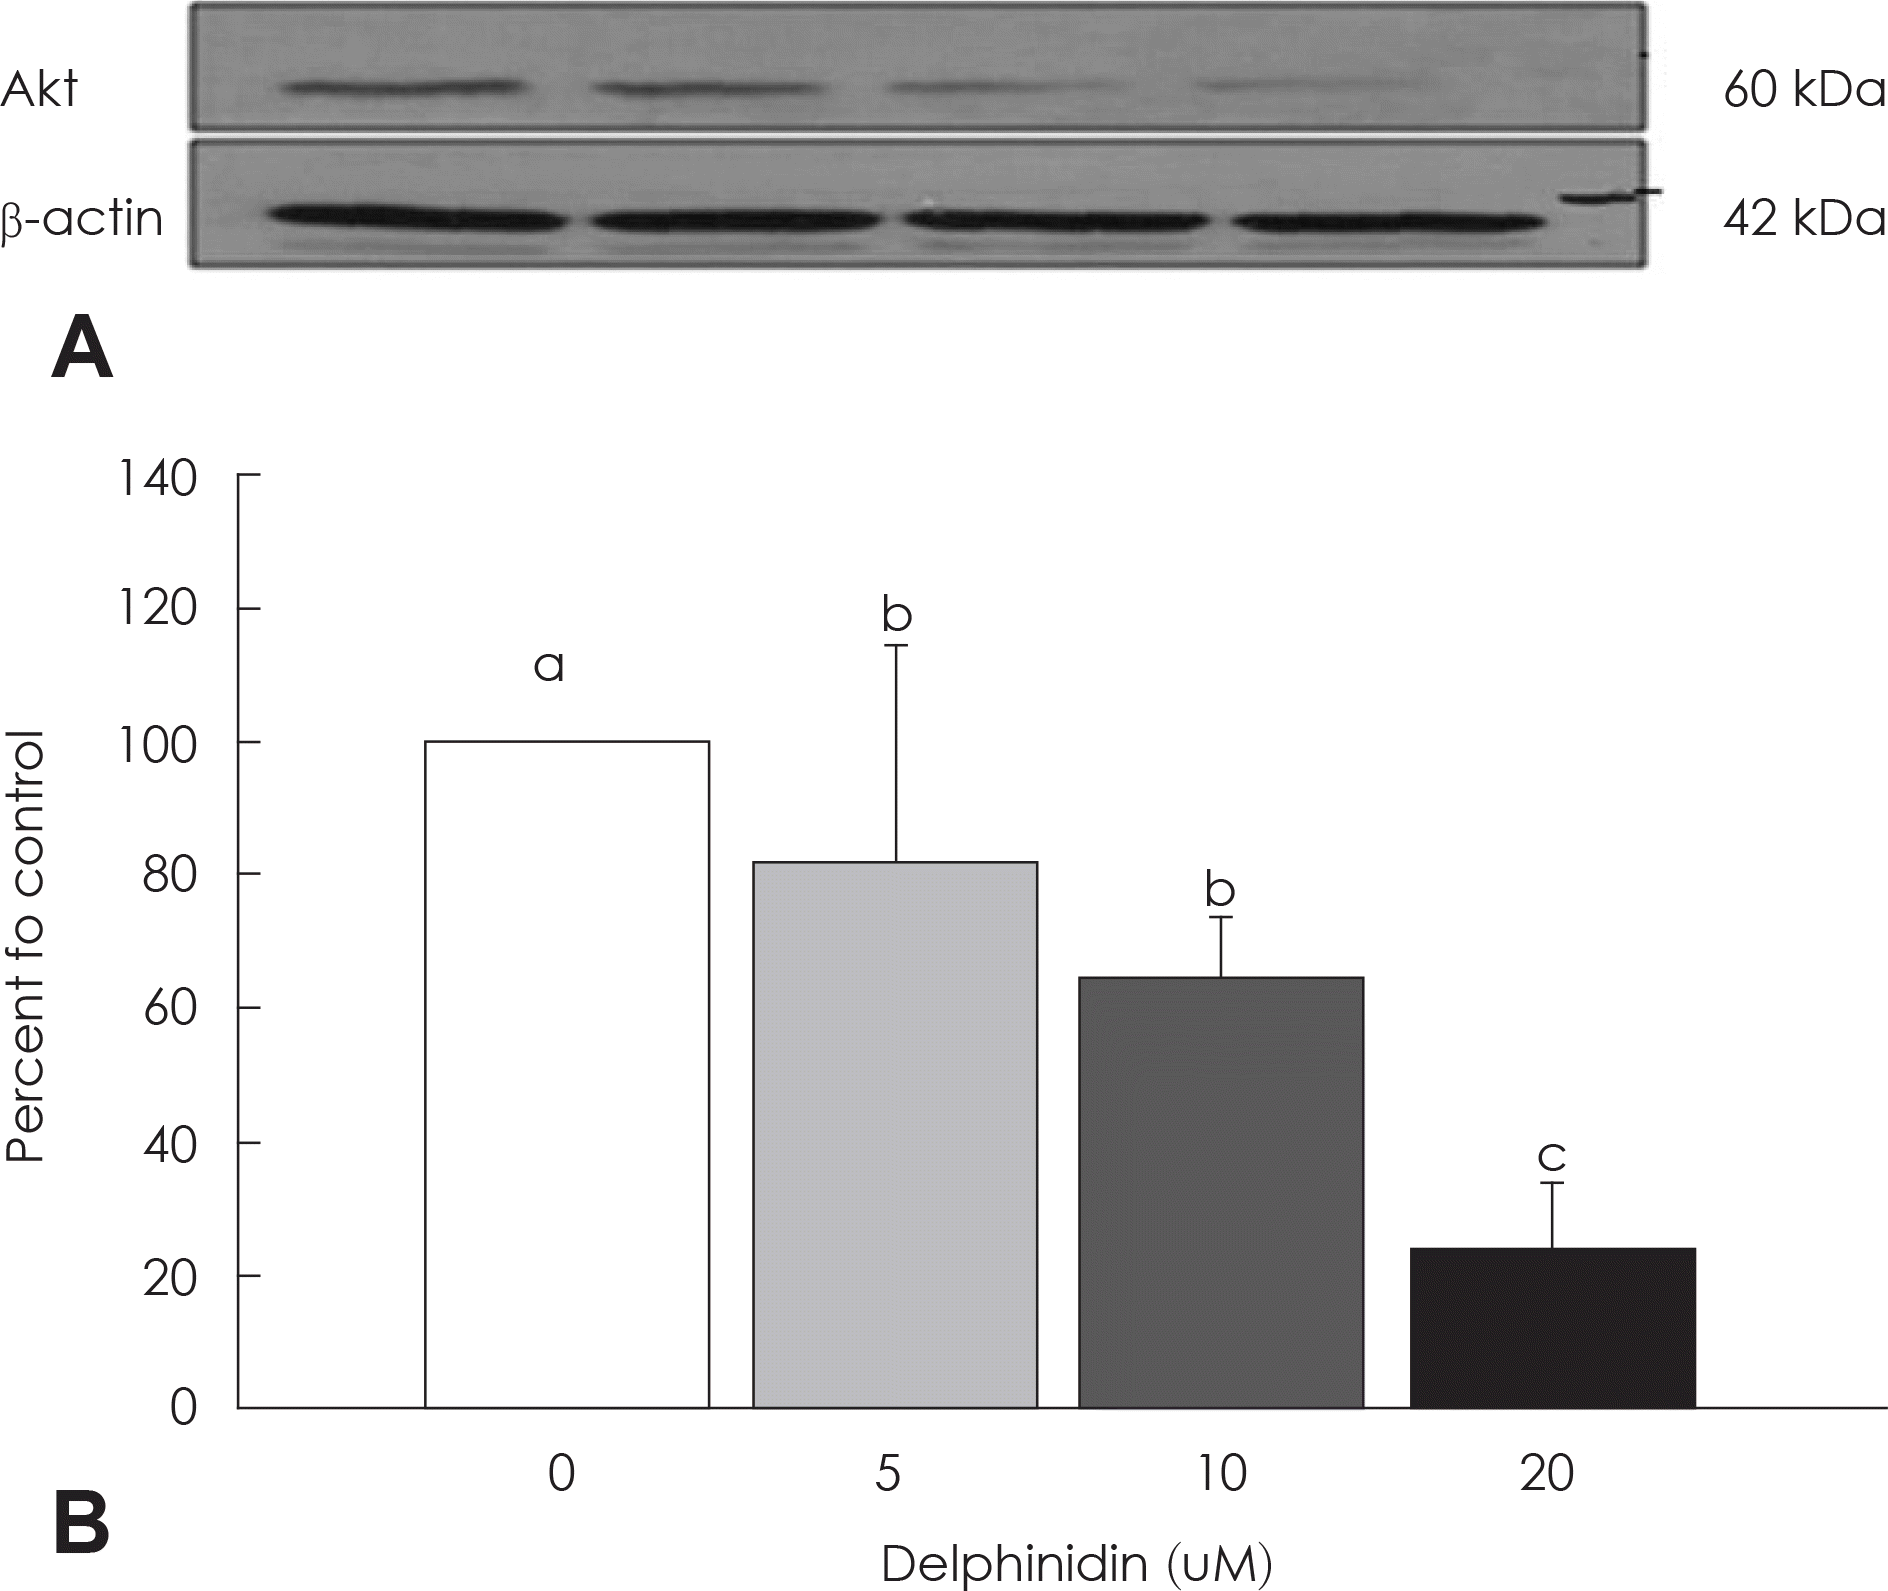
Fig. 5.
Effects of delphinidin on p-Akt expression in MDA-MB-231 cells. Cells were treated as described in Fig. 1 and protein samples were analyzed by immunoblotting with antiphospho-Akt protein or β-actin antiboby. A: The photographs of chemiluminescent detection of the blots, which were representative of three independent experiments, are shown. B: Quantitative analysis of im-munoblots. The relative change in p-Akt band on western blots was quantitated by densitometric analysis. Each bar represents the mean ± SE (n = 3). Comparisons between groups that yielded significant differences (p < 0.05) are indicated by different letters above each bar.
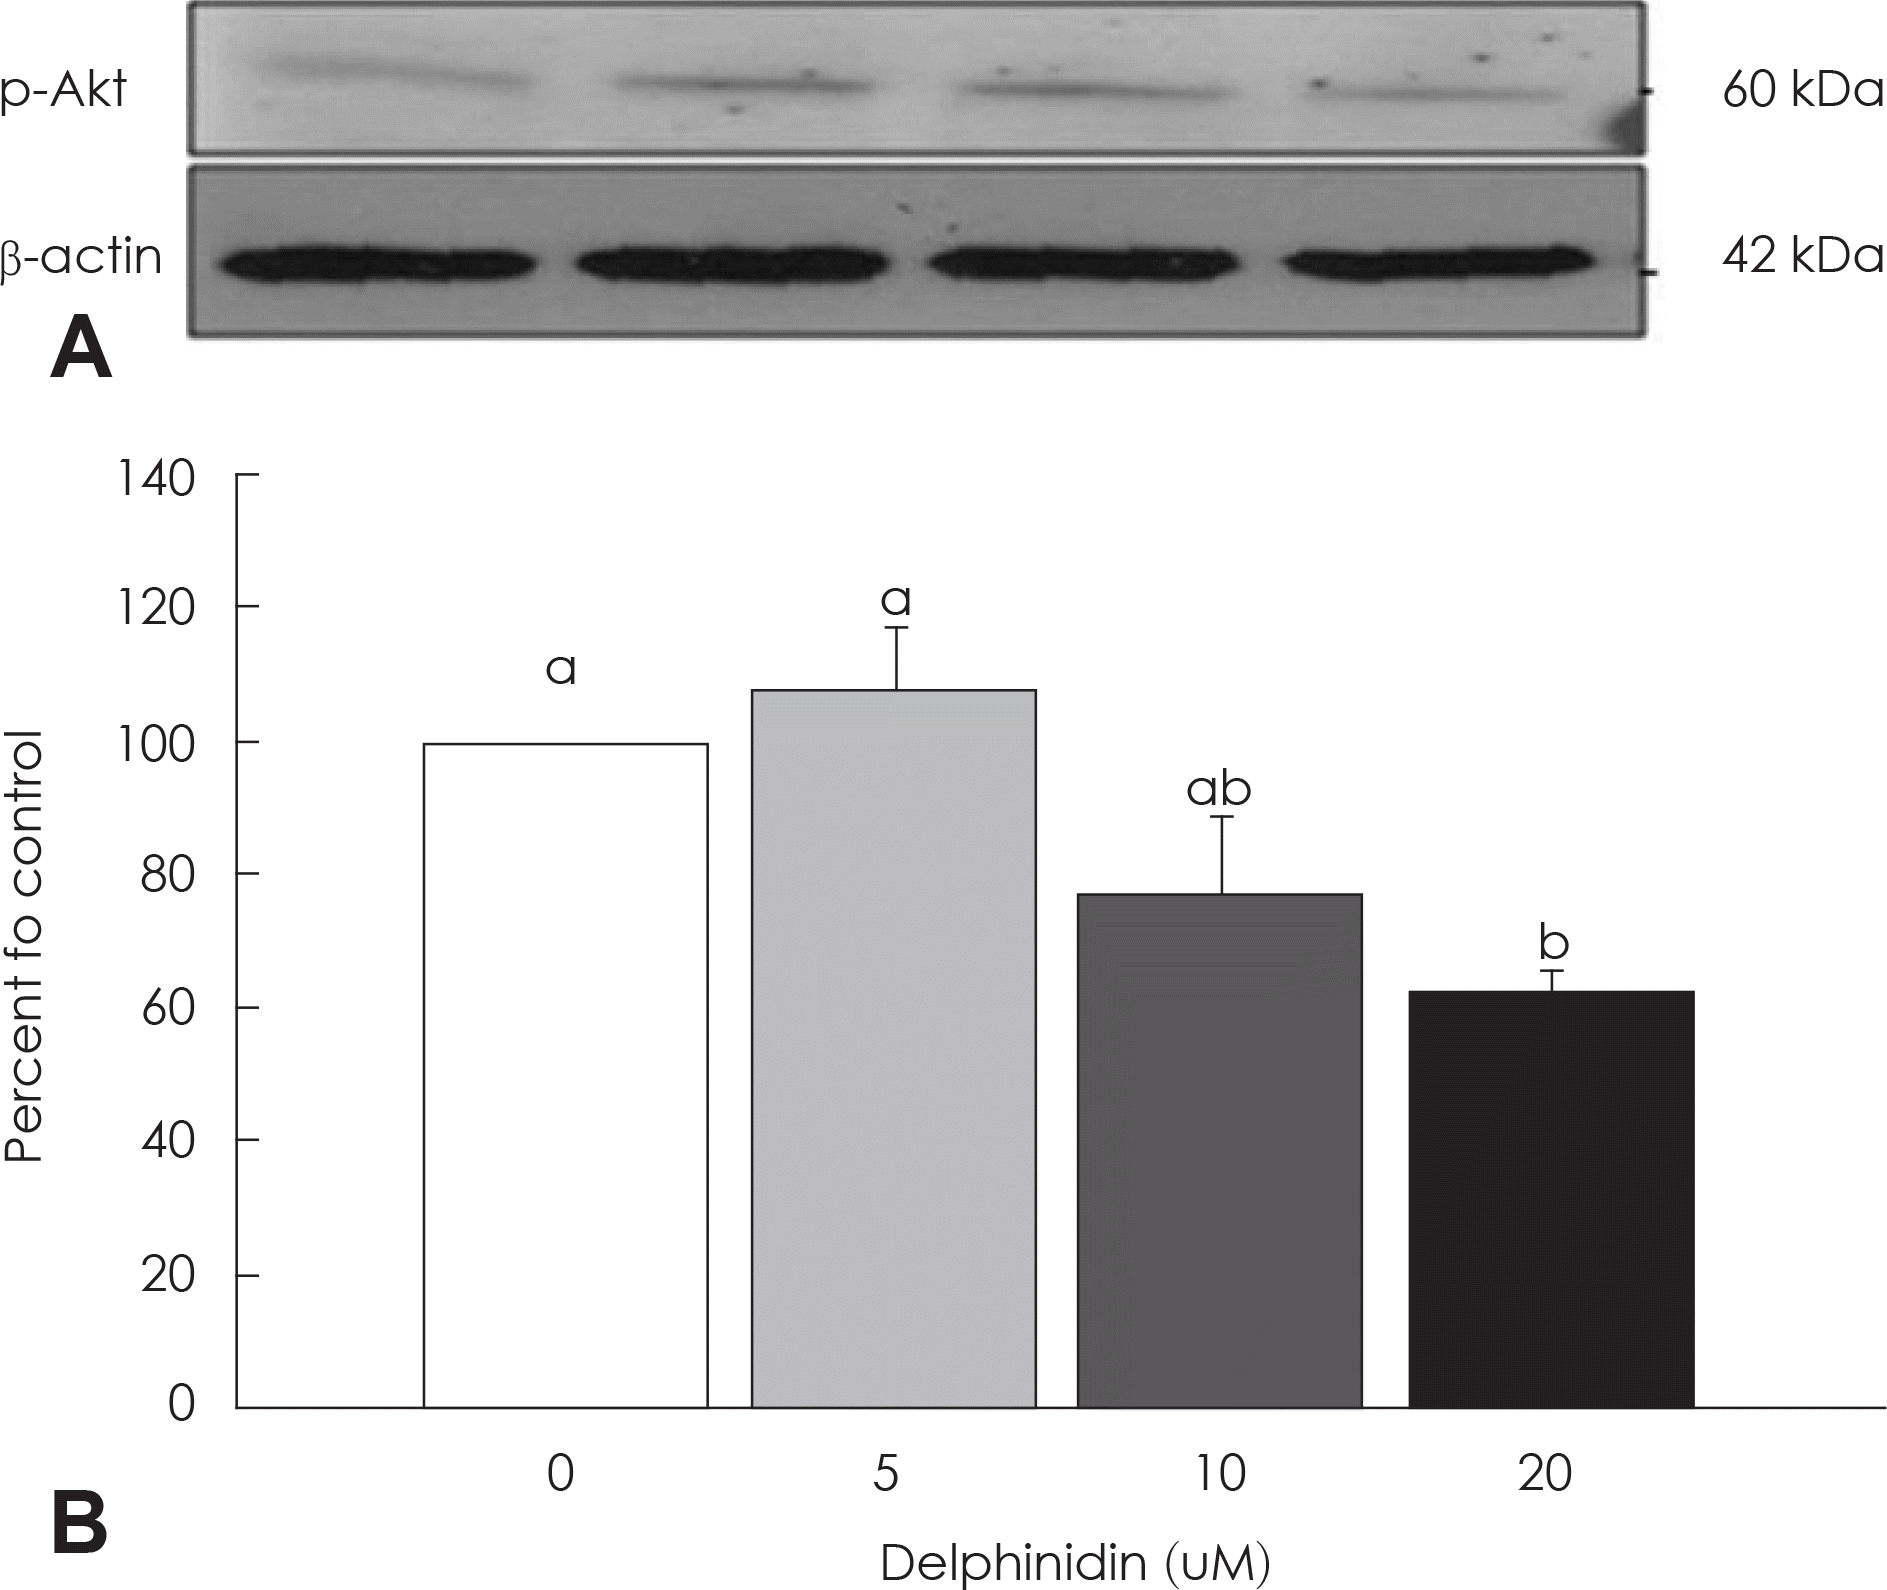
Fig. 6.
Effects of delphinidin on Bcl-2 expression in MDA-MB-231 cells. Cells were treated as described in Fig. 1 and protein samples were analyzed by immunoblotting with an Bcl-2 or β-actin antiboby. A: photographs of chemiluminescent detection of the blots, which were representative of threeindependent experiments, are shown. B: quantitative analysis of immunoblots. The relative abundance of each bar was estimated by densitometric scaning of the exposed films. Each bar represents the mean ± SE (n = 3). Comparisons between groups that yielded significant differences (p < 0.05) are indicated by different letters above each bar.
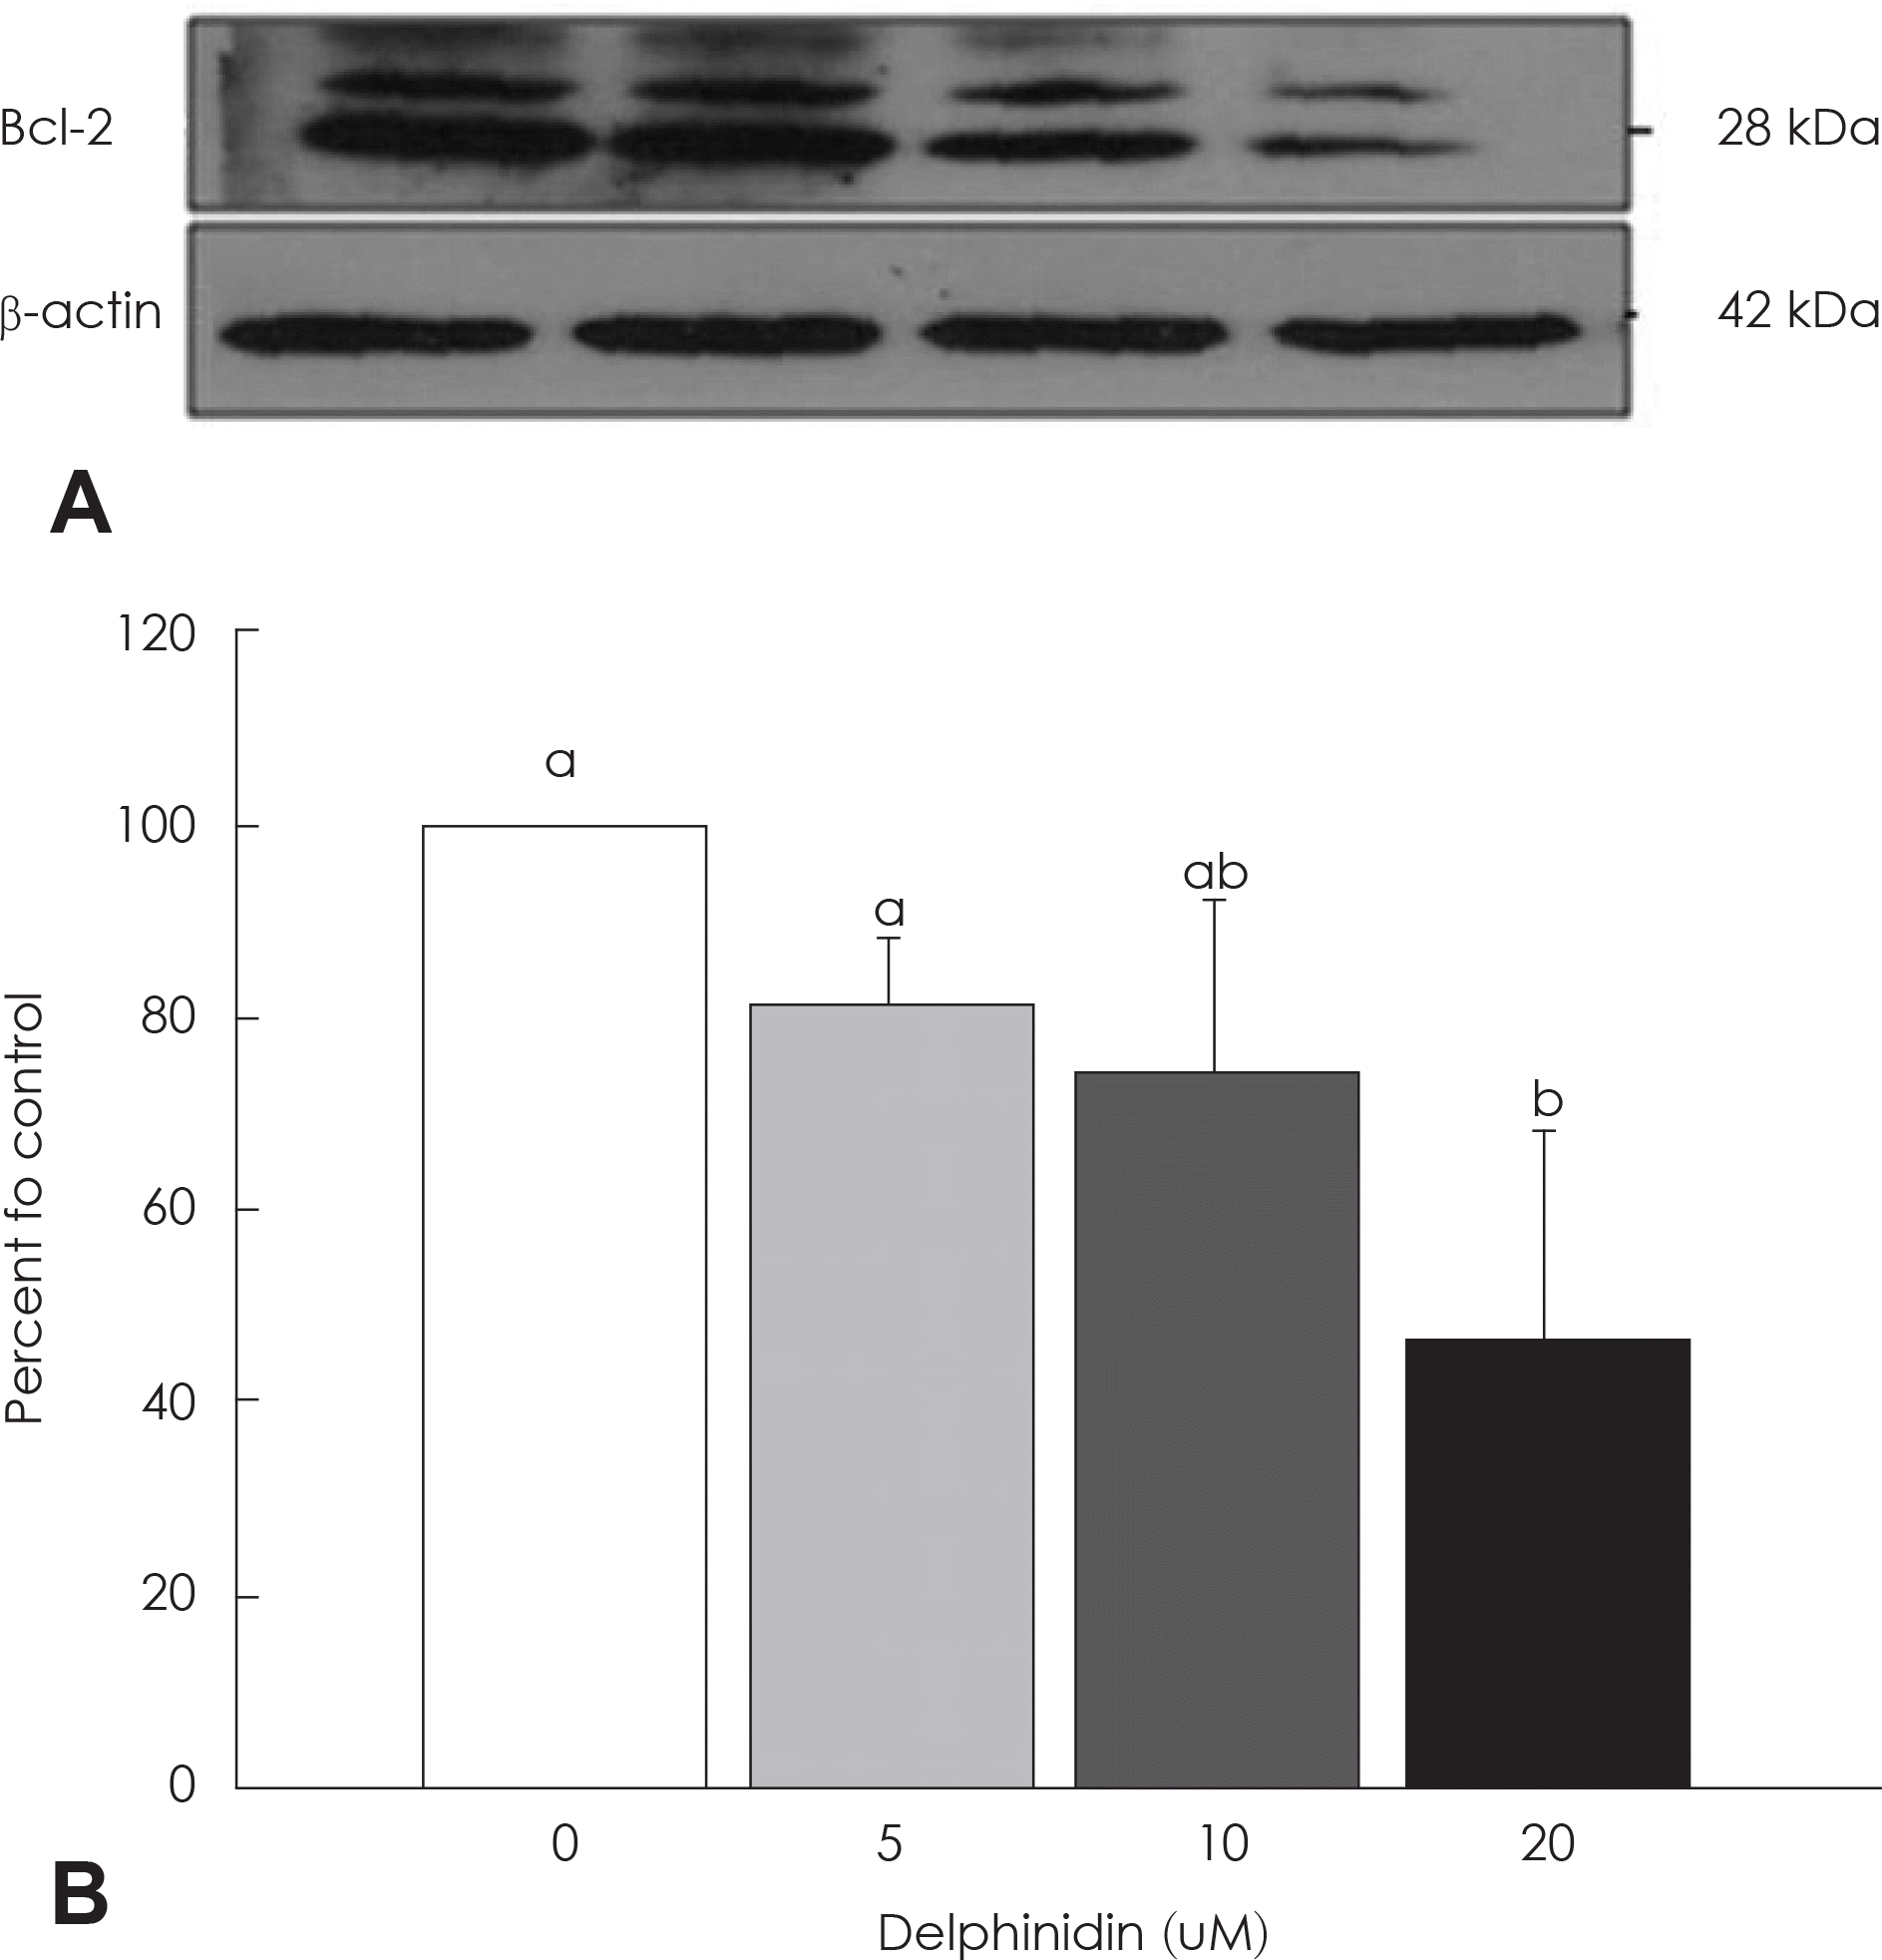
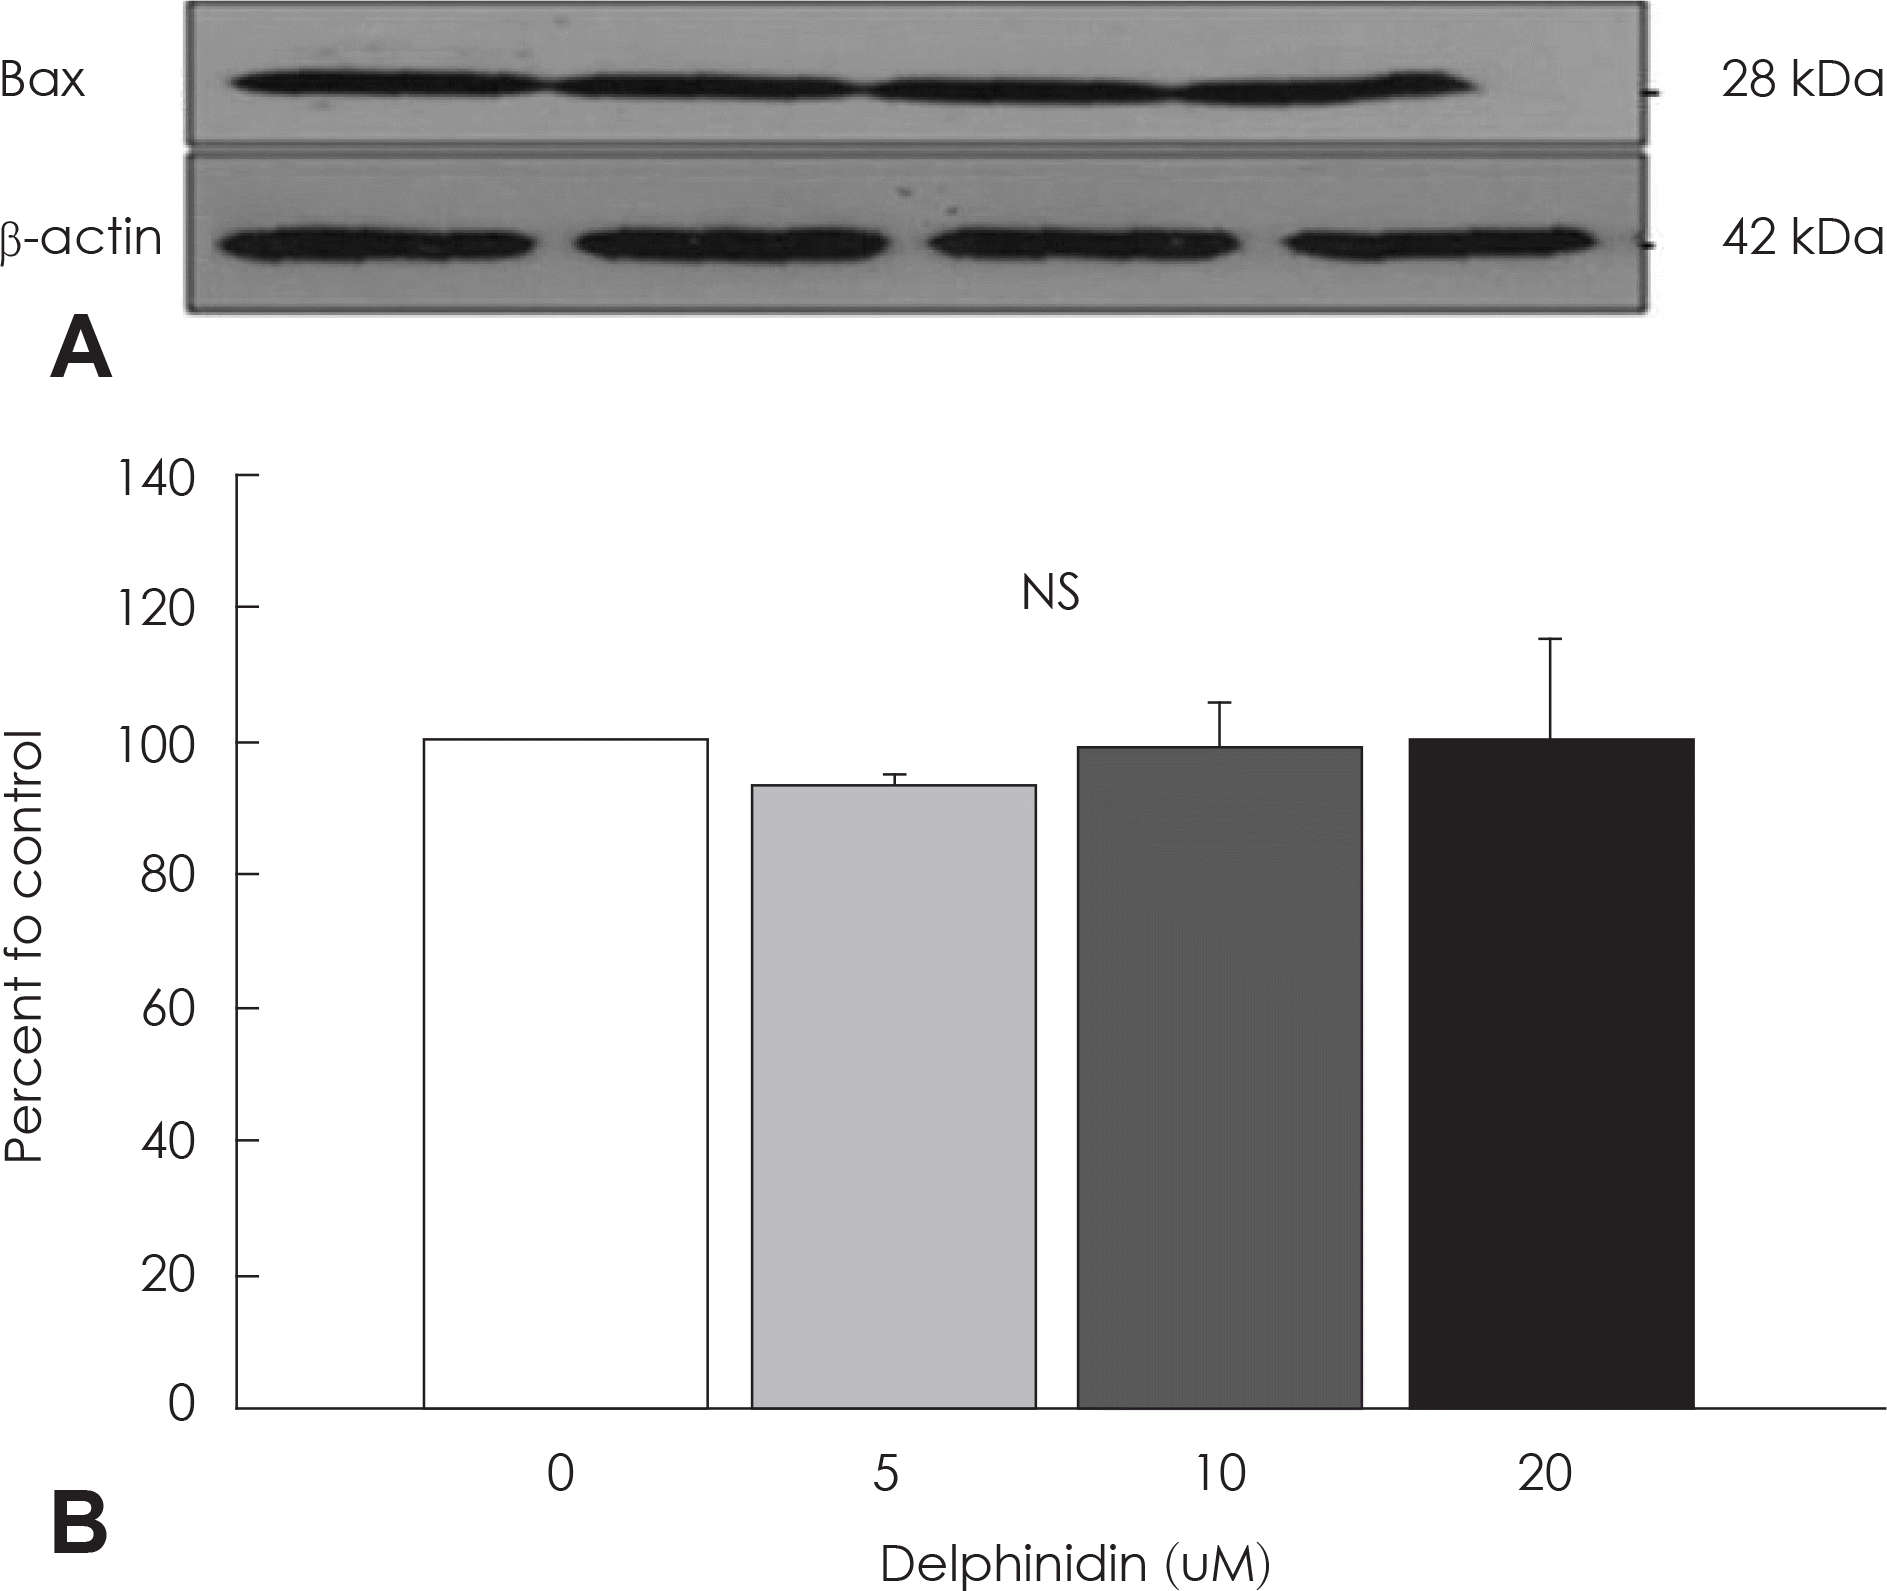
Fig. 7.
Effects of delphinidin on Bax expression in MDA-MB-231 cells. Cells were treated as described in Fig. 1 and protein samples were analyzed by immunoblotting with an Bax or β-actin antiboby. A: photographs of chemiluminescent detection of the blots, which were representative of three independent experiments, are shown. B: quantitative analysis of immunoblots. The relative abundance of each bar was estimated by densitometric scaning of the exposed films. Each bar represents the mean ± SE (n = 3). Comparisons between groups that yielded significant differences (p < 0.05) are indicated by different letters above each bar.


 PDF
PDF ePub
ePub Citation
 Print
Print


 XML Download