

 PDF
PDF ePub
ePub Citation
 Print
Print


INTRODUCTION
Stroke is the most common debilitating neurological deficit and the third cause of adult death worldwide.1 It leads to a significant decrease in the quality of life and an increase in treatment costs. The annual incidence rate of stroke is about 37 million cases, as world health organization reported in 2004.23 The number of people having a stroke each year is estimated to be about 725 thousand in America and 40 thousand in Australia. Direct costs resulting from stroke are estimated to be about 16.4 billion dollars a year.4 Data shows that in our country, the mortality rate resulting from stroke is 51-100 cases per 100,000 people.5
Air pollution is a complex heterogeneous mixture of liquids, gases and particulate matter (PM). It is a major risk factor for cardiovascular and respiratory diseases, stroke, and cancer.6789 In the last 20 years numerous epidemiologic studies have reported the probable dangerous effects of air pollution on cardiovascular diseases and stroke.1011 In this regard, the effects of carbon monoxide (CO), nitrogen oxides, sulfur dioxide, ozone, Lead and PMs such as thoracic particles like PM10 and fine particles like PM2.5 have received more attention.12131415161718 The results of these studies demonstrate the direct correlation between the level of these molecules in the air and the rate of hospital admission and mortality due to stroke.18 Yet, little data exists regarding the morbidity resulting from air pollution, most of which was extracted during the 1990s and in 2000. Since sulfur dioxide, PM10 and PM2.5 levels have significantly increased in recent years,19 re-evaluating this relationship is of great importance. We should note that due to geographical differences in the levels of air pollutants, hospital admission patterns on polluted days may vary significantly from locations to location.20 Therefore, it is necessary for the health care system to be aware of the hospital admission patterns on polluted days to be able to manage this crisis more efficiently. Recent studies have proved that racial and geographical differences play a role in the effect of air pollution on diseases such as stroke16 which emphasizes the importance of local studies. Therefore, the present study aimed to determine the relationship between air pollutant levels and the rate of stroke admissions to hospitals.
MATERIALS AND METHODS
1. Study design
In this retrospective cross-sectional study, the relationship between air pollutant levels and IS patients admitted to Imam Hossein Hospital, Tehran, Iran was evaluated. As Iran's capital, Tehran is the most polluted of Iranian cities. Its population is about 8.5 million people which are more than 10% of the country's total population. The most important source of its air pollution is traffic and transportation. This study was approved by the ethics committee of Shahid Beheshti University of Medical Sciences and was carried out in winter of 2012 and 2013. The reason for selecting the winter months for this study is that during this time Tehran experiences the highest levels of air pollution for the year. The phenomenon of temperature inversion during the colder months of the years causes retention of pollutants and more dangerous air pollution conditions.21
2. Patients and stroke admissions
In this retrospective study, patients who were brought to the emergency department during the study period (from January 2012 to March 2012 and from January 2013 to March 2013) and who were eventually coded with a diagnosis of IS based on the International Classification of Disease (ICD-10) were selected using the hospital's electronic registration system. The number of these admissions was determined for each date (day and month). The definition used for stroke in this study was a new neurologic defect without evidence of hemorrhage on brain computed tomography, attributable to acute CNS ischemia as determined by Magnetic Resonance Imaging of the brain.
3. Air pollution and meteorological characteristics
Tehran has a recording system which is active 24 hours a day. There are 31 stations that monitor the quality of air throughout the city and record PM10, PM2.5, nitrogen dioxide (NO2), ozone (O3), and sulfur dioxide (SO2) levels every hour. In the present study, these data points were used to calculate mean pollutant concentrations over 24 hours.
The Meteorology Organization of Tehran measures average humidity, temperature, and wind speed, hourly. Thirteen meteorological stations exist in Tehran's province, five of which give data regarding the city of Tehran. Therefore, the data extracted from these five stations and their means were used in all analyses.
4. Statistical analyses
Descriptive statistics and correlation patterns between hospital admissions, air pollutants, and meteorological factors (temperature, humidity, and wind speed) were analyzed using STATA statistical software version 12.0. Relative risk of IS admission was calculated using a generalized additive model (GAM) based on Poisson distribution since previous studies showed that data distributions regarding air pollutants do not follow normal patterns1011 and therefore parametric analyses could not be done.
Each GAM was fitted based on the logarithm of the number of stroke admissions to the hospital, as well as the overall adjusted and linear effects of predictive factors (air pollutants). Therefore, smoothing spline functions were applied to temperature, wind speed, and humidity as confounding factors. This function is a non-parametric tool that identifies non-linear relationships of the air factors such as temperature, humidity, and month with the number of hospital admissions and ensures correct fitting of the model. The degree of freedom was defined in terms of Akaike's criterion in this model.21 Daily levels of pollutants for the same day (Lag 0), and the averages of the day before and the same day (Lag1), the last two days and the same day (Lag 2), the previous week (Lag7), the last 2 weeks (Lag 14), the last 3 weeks (Lag 21), and the previous month (Lag 30) were calculated and the relationship between pollutant levels and the number of daily hospital admissions was evaluated in each period. All findings were presented as relative risk (RR) of hospitalization with 95% confidence intervals (95% CI) corresponding to an increase in the inter-quartile range (a difference between 25th and 75th centile) of air pollutant levels in comparison with the annual average. In all analyses p<0.05 was considered as a significance level.
RESULTS
In the present study, 379 patients with IS were admitted to the hospital. Of these, 199 (52.5%) were male and 180 (47.5%) were female and their mean age was 68.2±13.3 years ranging from 21 to 96 years old. The number of the patients admitted was not different in the studied months (p=0.45).
1. Meteorological variables and air pollutants
Average relative humidity was 55.5±3.3 percent in the studied period. The mean wind speed was 16.5±2.9 km/hour and mean temperature was 4.4±4.3℃. A one-way analysis of variance showed that average humidity was not significantly different in the studied months (df:5, 173, F=1.7, p=0.07), similar findings were obtained regarding average wind speed in various months (df:5, 173, F=1.1, p=0.35) but temperature varied significantly throughout the different months of the year (df:5, 173, F=37.4, p<0.0001).
The average CO level in the air was 38.1±8.7µg/m3 throughout the study (ranging from 21 to 65 µg/m3). The average O3 level was 25.0±7.9 µg/m3 (ranging from 12 to 55 µg/m3). The mean levels of NO2 and SO2 were 59.0±11.2 µg/m3 and 31.8±5.9 µg/m3, respectively. The PM10 pollutants' level was 65.7±15.2 µg/m3 and the PM2.5 level was 107.3±27.8 µg/m3.
The relationship between air pollution indicators is shown in Table 1. Based on this table, PM2.5 and NO2 correlated with all other pollutants. The strongest correlations were seen between PM10 and PM2.5 (r=0.89, p<0.001), NO2 and PM2.5 (r=0.71, p<001), and NO2 and CO (r=0.75, p<0,001). O3 (r=0.44, p<0.001) and PM2.5 (r=–0.38, p<0.05) levels significantly correlated with temperature while all pollutants showed a significant correlation with wind speed.
2. The relationship between air pollutant levels and IS admission
1) Carbon monoxide:
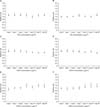
Apart from the CO levels in the 2 weeks leading up to each day (Lag14), at all other times a raise in this pollutant was associated with an increase in RR of stroke admission. An increase in CO concentration on the same day, raised the risk of stroke admission 1.09 times (95% CI:1.06-1.12, p< 0.001) while the increase was 1.12 times for the last 2 days (95% CI:1.06-1.18, p<0.001), 1.1 times for the last 3 days (95% CI:1.06-1.14, p<0.001), 1.08 times for the last 3 weeks (95% CI:1.04-1.12, p<0.001), and 1.1 times for the last month (95% CI:1.06-1.14, p<0.001) (Fig. 1A).
2) Ozone
A single inter-quartile rise in the O3 concentration throughout the week before, increased the risk of stroke admission 1.07 times (95% CI:1.03-1.11, p=0.02) and an increase in its monthly levels amplified this risk 1.11 times (95% CI:1.06-1.14, p<0.001) (Fig. 1B).
3) Nitrogen dioxide
One inter-quartile increase in NO2 level raised the risk of stroke admission 1.07 times on the admission day (95% CI:1.04-1.1, p<0.001), 1.1 times during the previous 2 days (95% CI:1.07-1.13, p<0.001), 1.06 times during the past 3days (95% CI:1.04-1.08, p<0.001), and 1.03 times throughout the week before (95% CI:1.01-1.05, p=0.03) (Fig. 1C).
4) Sulfur dioxide
One inter-quartile increase in the level of SO2 increased the risk of a stroke 1.08 times (95% CI:1.06-1.1, p<0.001) on the admission day, 1.09 times (95% CI:1.05-1.13, p< 0.001) on during the previous 2 days, 1.07 times (95% CI: 1.02-1.08, p<0.001) on the previous 3 days, and 1.05 times (95% CI:1.01-1.07, p=0.04) during the previous week (Fig. 1D).
5) PM10
An increased PM10 concentration throughout the week before, raised the risk of IS admission 1.14 times (95% CI:1.06-1.22, p<0.001) while an increase during the past 3 weeks raised the risk up to 1.16 times (95% CI:1.1-1.22, p<0.001) and a monthly increase of this pollutant led to an 1.13 times increase (95% CI:1.04-1.21, p<0.001)(Fig. 1E).
6) PM2.5
An increased concentration of this pollutant over the previous 2 weeks elevated the risk of stroke admission 1.09 times (95% CI:1.03-1.15, p<0.001) while the increased rate was 1.15 times (95% CI:1.03-1.27, p<0.001) for the previous 3 weeks and 1.14 times (95% CI:1.06-1.22, p< 0.001) for the last month (Fig. 1F).
DISCUSSION
The findings of this study showed that the level of air pollutants directly correlates with the number of stroke admissions to the emergency department. Both transient and long-term rises in CO levels increase the risk of stroke. Increased weekly and monthly O3 levels amplify this risk, while a transient increase in NO2 and SO2 levels (during the week before the stroke) have the same effect. Long-term changes in PM10 and PM2.5 also increase the risk of stroke.
Many studies have introduced CO as the most important pollutant affecting hospital stroke admissions. Tsai et al. demonstrated that the CO level has a significant correlation with stroke admissions to hospitals on both cold and hot days.22 Hong et al. also expressed that an increased CO level is associated with a higher risk of stroke a day later.23 Many studies have proved that other pollutants also significantly correlate with the chance of stroke. For instance, Wellenius et al. revealed that being exposed to normal levels of PM2.5 also significantly increases the risk of stroke.24 Chen et al. showed that NO2, CO, and PM2.5 levels in the air significantly correlate with stroke incidence.25 Villeneuve et al. found a significant correlation between stroke and NO2 levels.26 Also, in a study, Cruz et al. demonstrated that CO, NO2, So2, O3, PM10, and PM2.5 all significantly correlate with stroke incidence.27 The effect of these pollutants is not limited to strokes. In fact, they have been introduced as major causes of cardiovascular diseases in numerous studies. For example, Qorbani et al. demonstrated that a significant correlation exists between acute coronary syndrome admissions and CO level in Tehran but PM10 and PM2.5 have no relationship with coronary heart diseases.12 Hosseinpoor et al. demonstrated that the relative risk of angina pectoris increases with higher levels of CO two days before admission but does not correlate with other pollutants. 28
Nowadays, many urban areas have high concentrations of air pollutants due to human activities. Sources of these air pollutants include motor vehicles, energy generation, domestic heating, and industry. Urban air pollution is a serious threat not only for human health and urban environments regionally, but also globally.29 Motor vehicles are considered the major source of air pollution in urban areas. These vehicles diffuse pollutants such as CO, nitrogen oxide, photochemically reactive hydrocarbons, and sulfuric acid aerosols that are destructive to the population health.30 In today's cities, air quality deviates from the standard many days each year, especially in developing countries. If the cities continue to grow at the current speed, air pollution and its health threats will worsen unless preventive laws are enforced. Measures to control pollution is necessary in many cities around the world especially those located in eastern Europe, east of Mediterranean, west of Pacific ocean, Latin America and south-east Asia. They need to measure air pollutants to control industrial pollutions and prevent transportation pollutions by developing and carrying out transportation policies and urban planning. 31
It has been suggested that pollutants may increase the risk of cardiovascular disease through various mechanisms. Destabilizing atherosclerotic plaques, inflammatory effects on the cardiovascular system, and creating a hypercoagulability state are among these. The effects of air pollution represent a continuous pathophysiological process, evolving from acute to chronic effects. With increased exposure duration, there may be an accumulation of these effects thus the evaluation of the lag effect is of importance. Rudez and colleagues showed that the hypercoagulability induced by PM2.5 does increase with longer exposure.32 In our study short and mid-term lag effects were calculated to clarify this as discussed in the results section. On the other hand, interpreting a lag effect should be done with caution since misclassification of the time of event onset may lead to underestimation of the effect.33 Although we did not take into account possible delays in presentation, we believe our events were of an acute nature since we used Magnetic Resonance Imaging to confirm acute ischemia.
One of the most important limitations of the present study was that we only gathered the data from one hospital. Therefore, the results may not represent the pattern of the city as a whole, but since the hospital is located near the center of Tehran, there is a high probability that the patients were being referred to this center from various districts of the city. Moreover, many stroke risk factors such as smoking, alcohol, nutrition, cholesterol level and obesity have not been addressed here, but as these factors do not change with time as air pollutants do, many researchers believe that these risk factors cannot be considered as confounding factors in time series studies.
CONCLUSION
The findings of this study showed that the level of air pollutants directly correlates with the number of stroke admissions to the emergency department. Both transient and long-term rise in CO level increases the risk of stroke. Increased weekly and monthly O3 levels amplifies this risk, while a transient increase in NO2 and SO2 levels (during the week before the stroke) had the same effect. Long-term changes in PM10 and PM2.5 also increased the risk of stroke.

 XML Download