Abstract
Objective
We wanted to evaluate the prevalence of gout and its features in Korean people using the National Health Insurance Corporation (NHIC) database.
Methods
Using the NHIC database from 2001 to 2008, we selected the gout patients who were coded as having gout as a main diagnosis. From the total number of gout patients, we evaluated the prevalence of gout and its features.
Results
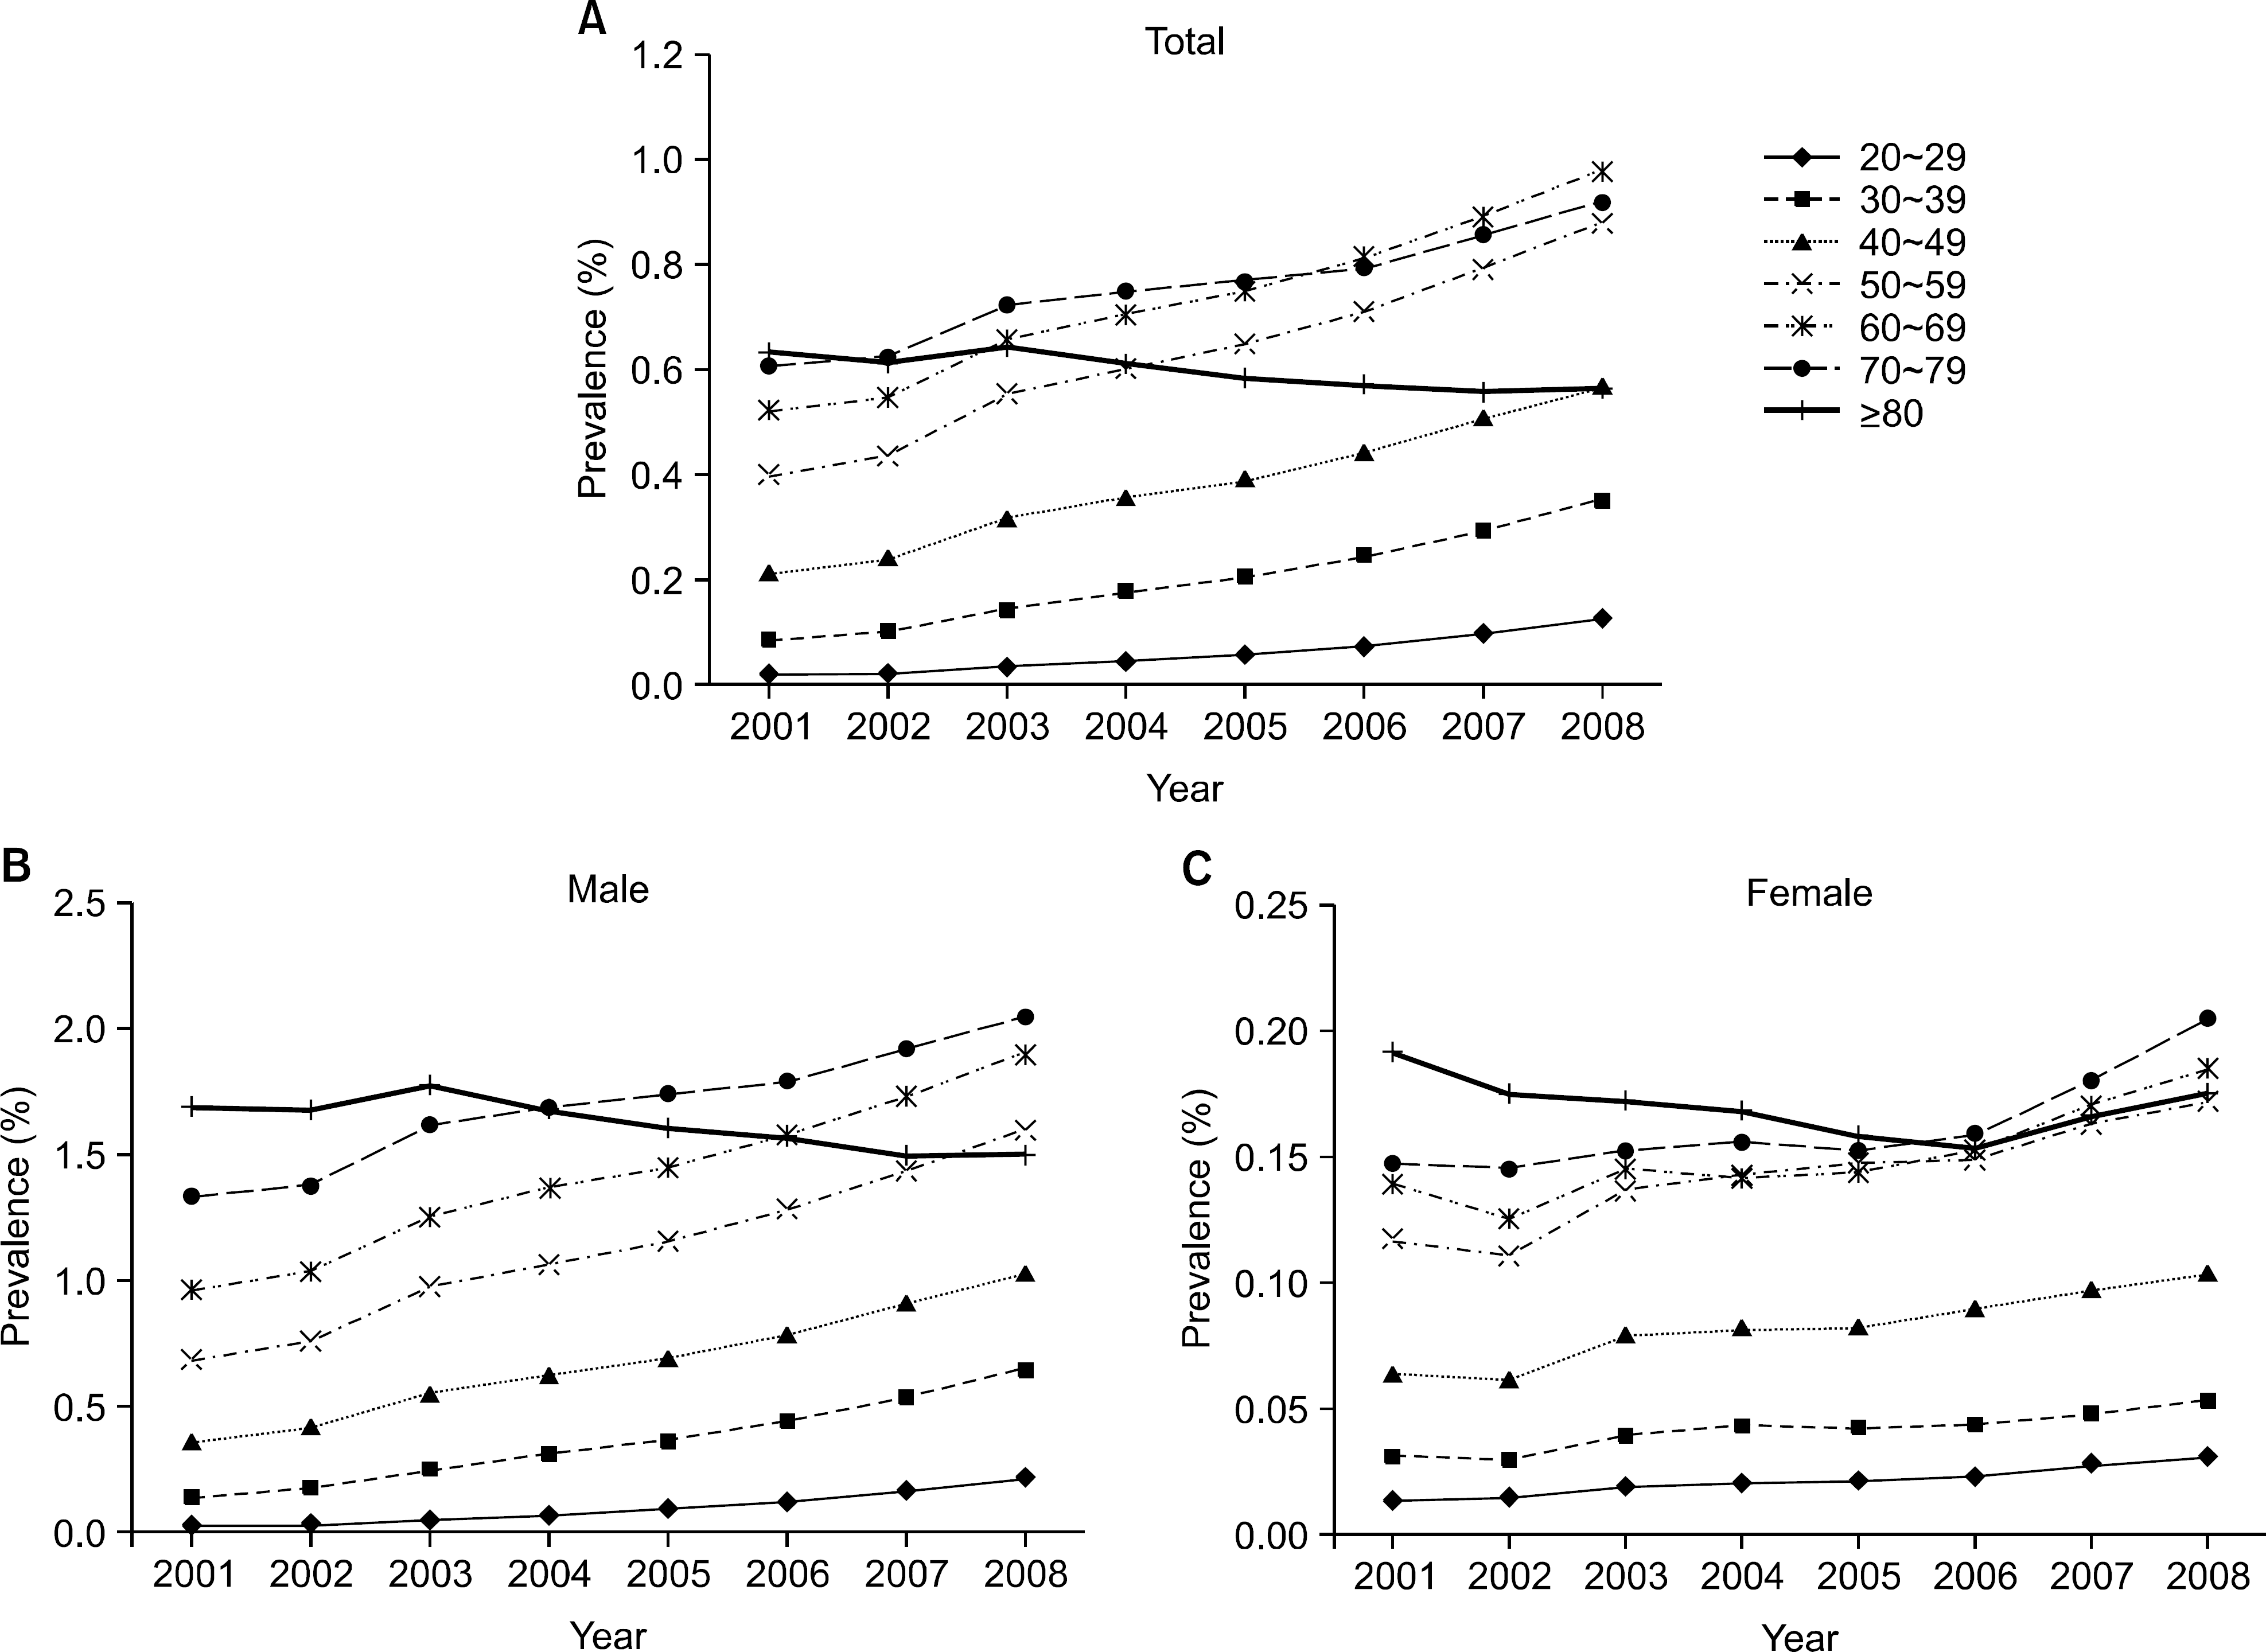
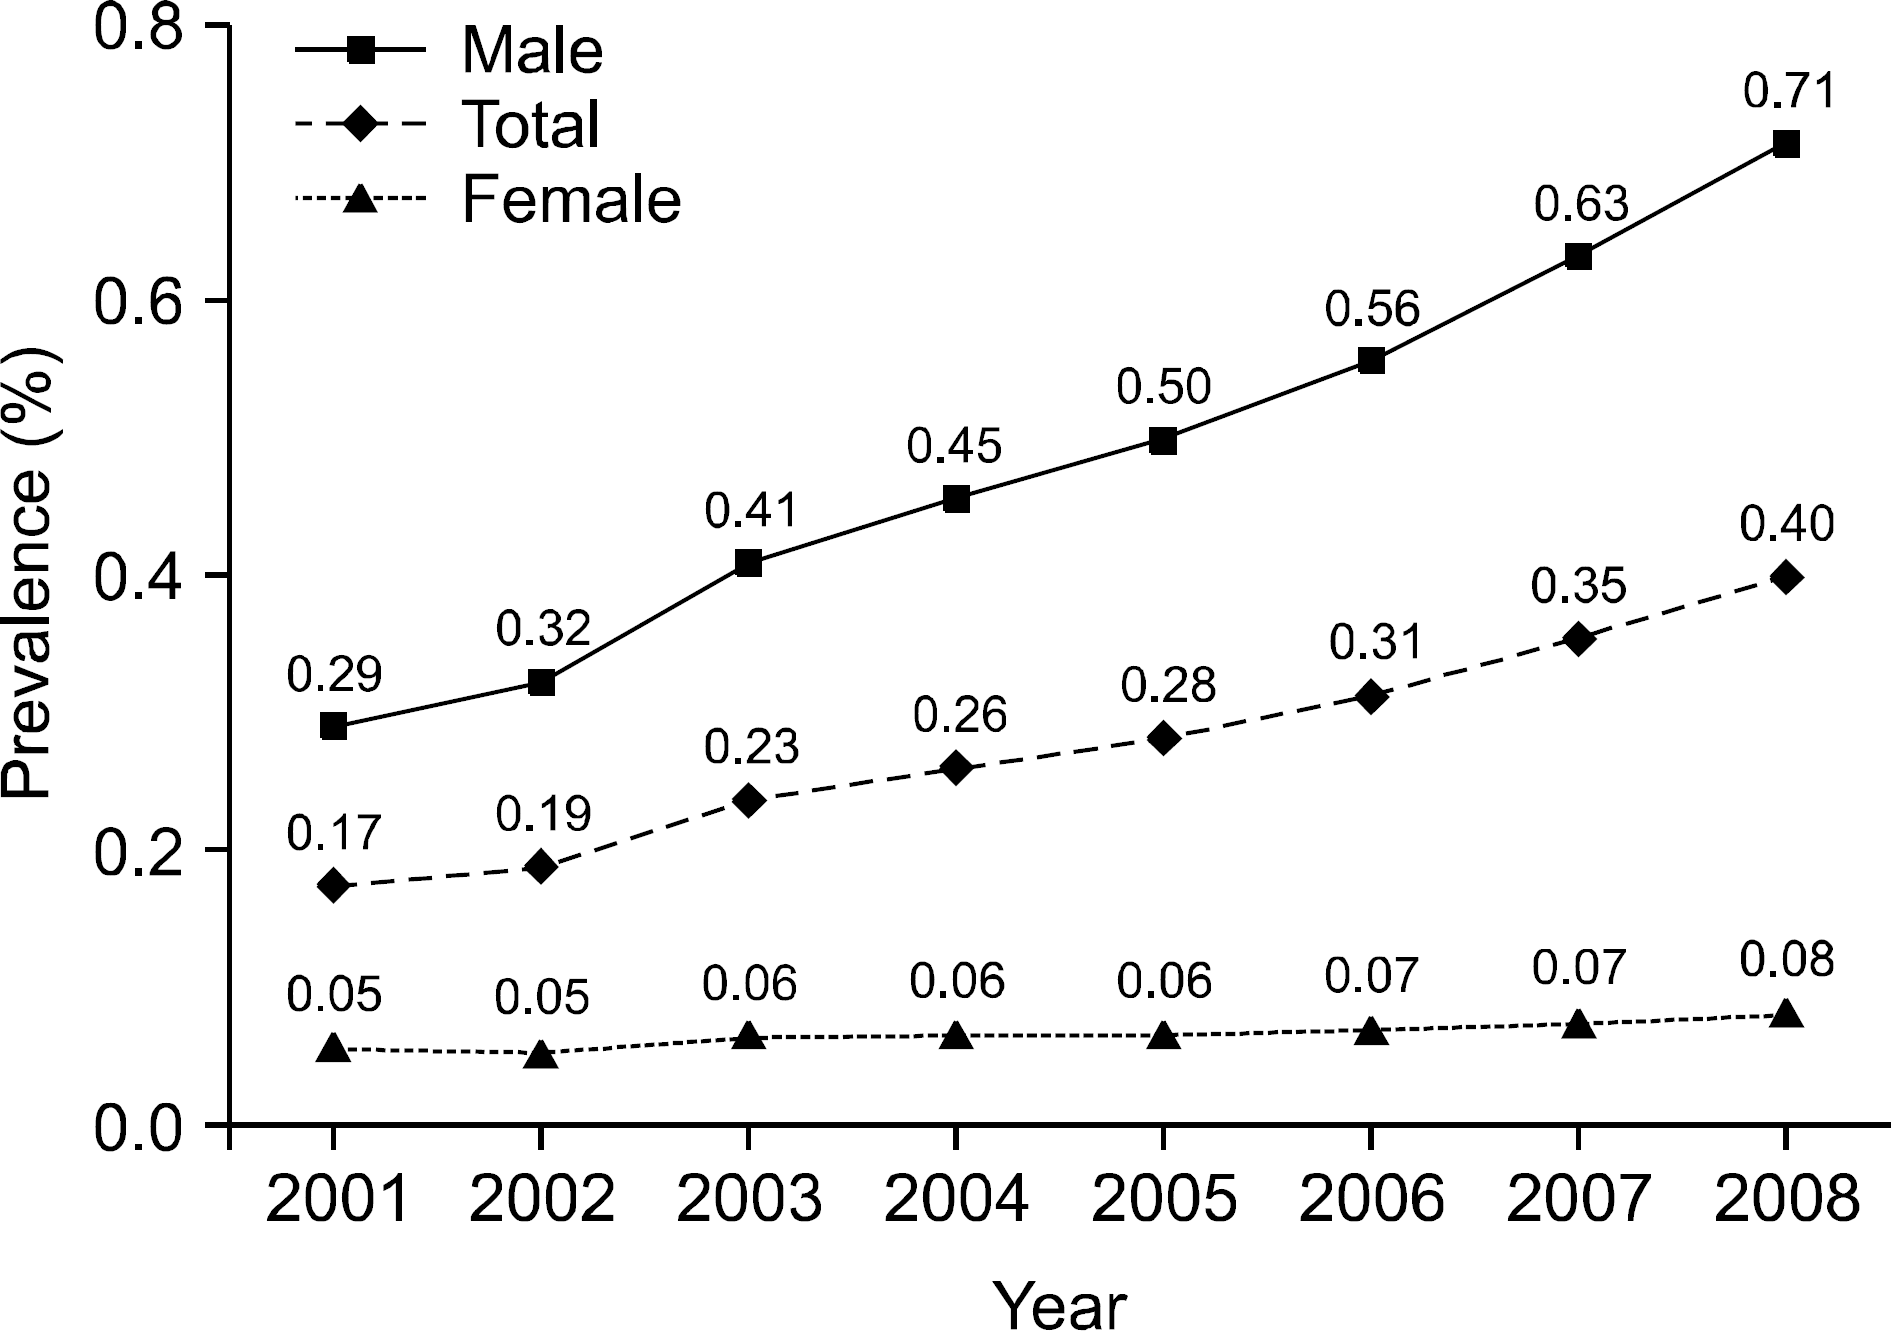
The prevalence of gout prevalence was 0.171% in 2001 and 0.397% in 2008, and there was a 2.317 fold increased during over the 7 years. In 2008, the percentage of fifth and sixth decade patients was 48.5% and that of the male patients were 89.8% of the total gout patients. The increasing rate of the prevalence of gout during the same period was also higher in males (the male vs. female ratio was 5.3:1 in 2001 and 8.8:1 in 2008). The gout prevalence increased year by year to the eighth decade, and the peak prevalence age group was the ninth decade in 2001, the eighth decade in 2002–2005 and the seventh decade in 2006–2008. The prevalence ratio of 2008 to 2001 was higher for the males and the younger age group; that of third decade for males was 9.87, which was over the 10 times higher compared to that of the ninth decade (9.87 vs. 0.89, respectively).
Go to : 
References
1. Arromdee E, Michet CJ, Crowson CS, O'Fallon WM, Gabriel SE. Epidemiology of gout: is the incidence rising? J Rheumatol. 2002; 29:2403–6.
2. Currie WJ. Prevalence and incidence of the diagnosis of gout in Great Britain. Ann Rheum Dis. 1979; 38:101–6.

3. Harris CM, Lloyd DC, Lewis J. The prevalence and prophylaxis of gout in England. J Clin Epidemiol. 1995; 48:1153–8.

4. Mikuls TR, Farrar JT, Bilker WB, Fernandes S, Schumacher HR Jr, Saag KG. Gout epidemiology: results from the UK General Practice Research Database, 1990–1999. Ann Rheum Dis. 2005; 64:267–72.

5. Isomäki H, von Essen R, Ruutsalo HM. Gout, particularly diuretics-induced, is one the increase in Finland. Scand J Rheumatol. 1977; 6:213–6.
6. Klemp P, Stansfield SA, Castle B, Robertson MC. Gout is on the increase in New Zealand. Ann Rheum Dis. 1997; 56:22–6.

7. Lin KC, Lin HY, Chou P. Community based epidemiological study on hyperuricemia and gout in Kin-Hu, Kinmen. J Rheumatol. 2000; 27:1045–50.
8. Chang HY, Pan WH, Yeh WT, Tsai KS. Hyperuricemia and gout in Taiwan: results from the Nutritional and Health Survey in Taiwan (1993–96). J Rheumatol. 2001; 28:1640–6.
9. Choi HK, Atkinson K, Karlson EW, Curhan G. Obesity, weight change, hypertension, diuretic use, and risk of gout in men: the health professionals followup study. Arch Intern Med. 2005; 165:742–8.
10. Yoo B. Serum uric acid levels in Korean adult population and their correlates. J Korean Rheum Assoc. 1995; 2:60–8.
11. Kim EH, Jeon K, Park KW, Kim HJ, Ahn JK, Jeon CH, et al. The prevalence of gout among hyperuricemic population. J Korean Rheum Assoc. 2004; 11:7–13.
12. Choi HK, Ford ES, Li C, Curhan G. Prevalence of the metabolic syndrome in patients with gout: the Third National Health and Nutrition Examination Survey. Arthritis Rheum. 2007; 57:109–15.

13. Lawrence RC, Felson DT, Helmick CG, Arnold LM, Choi H, Deyo RA, et al. National Arthritis Data Workgroup. Estimates of the prevalence of arthritis and other rheumatic conditions in the United States. Part II. Arthritis Rheum. 2008; 58:26–35.
14. Annemans L, Spaepen E, Gaskin M, Bonnemaire M, Malier V, Gilbert T, et al. Gout in the UK and Germany: prevalence, comorbidities and management in general practice 2000–2005. Ann Rheum Dis. 2008; 67:960–6.

15. Gabriel SE, Michaud K. Epidemiological studies in incidence, prevalence, mortality, and comorbidity of the rheumatic diseases. Arthritis Res Ther. 2009; 11:229.

17. Bhole V, de Vera M, Rahman MM, Krishnan E, Choi H. Epidemiology of gout in women: Fifty-two-year followup of a prospective cohort. Arthritis Rheum. 2010; 62:1069–76.

18. Korea National Statistical Office. Age-and-gender-specific population size. 2005. p. 854. Daejeon: Korea National Statistical Office;2006.
19. Anagnostopoulos I, Zinzaras E, Alexiou I, Papathanasiou AA, Davas E, Koutroumpas A, et al. The prevalence of rheumatic diseases in central Greece: a population survey. BMC Musculoskelet Disord. 2010; 11:98.

20. Miao Z, Li C, Chen Y, Zhao S, Wang Y, Wang Z, et al. Dietary and lifestyle changes associated with high prevalence of hyperuricemia and gout in the Shandong coastal cities of Eastern China. J Rheumatol. 2008; 35:1859–64.
21. Xiang YJ, Dai SM. Prevalence of rheumatic diseases and disability in China. Rheumatol Int. 2009; 29:481–90.

22. Choi HK, Curhan G. Gout: epidemiology and lifestyle choices. Curr Opin Rheumatol. 2005; 17:341–5.
24. Kim J. Using national health insurance data to vitalize the evidence-based health care: the current status and tasks. The Korean society for preventive medicine, The Korean society for preventive medicine winter symposium. 2007. p. 1–28. Seoul: The Korean society for preventive medicine;2007.
25. Park BJ, Sung JH, Park KD, Seo SW, Kim SW. Report of the evaluation for validity of discharged diagnoses in Korean health insurance database. p. 223. Seoul: Seoul National University;2003.
26. Park IB, Kim DJ, Kim J, Kim H, Kim H, Min KW, et al. Current status of aspirin user in Korean diabetic patients using Korean health insurance database. J Korean Diabetes Assoc. 2006; 30:363–71.

27. Kim J. Validity of health insurance data. Korean diabetes association-Health insurance review and assessment service; Task force team for basic statistical study of Korean diabetes mellitus, Diabetes in Korea. 2007. p. 7–13. Seoul: Goldfishery;2008.
28. Park SK, Cheong HK, Ki M, Son YM, Kim H. Assessment of the availability of health insurance data for epidemiologic study of childhood aseptic meningitis. Korean J Prev Med. 2003; 36:349–58.
29. Cheong HK, Park SK, Ki M, Lee K. Six year national trend of childhood aseptic meningitis incidence in Korea, 1996–2001. Korean J Epidemiol. 2008; 30:252–62.

30. Koh MJ, Han JT, Lee AK, Kim MK, Park SH. Construction of national health screening examinee cohort - Development of the validity test. p. 170. Seoul: National health insurance corporation;2008.
31. Park IS, Koh MJ, Kim HJ. Construction of national health screening examinee cohort - Validity test of National health insurance database (II). p. 112. Seoul: National health insurance corporation;2009.
Go to : 
 | Figure 2.Gout prevalence of the total (A) males (B) and females (C) in 2001∼2008 according to the age group. |
Table 1.
Number of gout patients and the prevalence in 2001–2008
| Year | Total | Male | Female | |||
|---|---|---|---|---|---|---|
| Gout patient (n) | Prevalence∗ (%) | Gout patient (n) | Prevalence† (%) | Gout patient (n) | Prevalence‡ (%) | |
| 2001 | 80,583 | 0.1713 | 67,755 | 0.2887 | 12,828 | 0.0544 |
| 2002 | 87,586 | 0.1862 | 75,443 | 0.3215 | 12,143 | 0.0515 |
| 2003 | 110,202 | 0.2343 | 95,682 | 0.4078 | 14,520 | 0.0616 |
| 2004 | 121,661 | 0.2586 | 106,678 | 0.4546 | 14,983 | 0.0636 |
| 2005 | 131,798 | 0.2802 | 116,706 | 0.4973 | 15,092 | 0.0640 |
| 2006 | 146,098 | 0.3106 | 130,313 | 0.5553 | 15,785 | 0.0670 |
| 2007 | 165,646 | 0.3521 | 148,125 | 0.6312 | 17,521 | 0.0743 |
| 2008 | 186,705 | 0.3969 | 167,718 | 0.7147 | 18,987 | 0.0805 |
Table 2.
Gout prevalence per 100,000 people and the gender ratio in 2001–2008
| Year | Prevalence per 100,000 | Prevalence ratio of males vs females‡ | ||
|---|---|---|---|---|
| Total | Male (n)∗ | Female (n)† | ||
| 2001 | 171.3 | 144.0 | 27.3 | 5.3 |
| 2002 | 186.2 | 160.4 | 25.8 | 6.2 |
| 2003 | 234.3 | 203.4 | 30.9 | 6.6 |
| 2004 | 258.6 | 226.8 | 31.9 | 7.1 |
| 2005 | 280.2 | 248.1 | 32.1 | 7.7 |
| 2006 | 310.6 | 277.0 | 33.6 | 8.3 |
| 2007 | 352.1 | 314.9 | 37.2 | 8.5 |
| 2008 | 396.9 | 356.5 | 40.4 | 8.8 |
Table 3.
Comparison of the gout prevalence between 2001 and 2008 according to the age group and gender


 PDF
PDF ePub
ePub Citation
 Print
Print


 XML Download