

 PDF
PDF ePub
ePub Citation
 Print
Print


Introduction
The global prevalence of hyperuricemia is increasing [1], and this may be related to recent changes in diet, lifestyle and increasing prevalence of obesity. There appears to be a recent increase in the prevalence of hyperuricemia owing to the rapid economic development and the effect of westernized dietary habits in Korea [2].
Hyperuricemia is a precursor to gout and is associated with metabolic syndrome and cardiovascular disease. Many studies have reported that elevated uric acid is one of the most important risk factors for cardiovascular disease and that it plays a significant role in the development of metabolic syndrome [3-7]. Hyperuricemia can induce endothelial dysfunction in addition to inflammatory and oxidative changes, which may explain the association with metabolic syndrome [8]. Uric acid is an organic compound that is endogenously produced as a purine metabolite. It is formed by the liver and primarily excreted by the kidneys (65-75%) and intestines (25-35%) [9]. Hyperuricemia occurs due to a decrease in uric acid excretion, an overproduction of uric acid, or an excessive intake of purine. But the primary cause is known to be a decrease in the excretion by the kidneys [10].
Although a purine-rich diet is responsible for increasing uric acid by only 1-2 mg/dL [11], the management of hyperuricemia has been focused on dietary recommendations to avoid purine-rich foods such as meats and meat products and alcoholic beverage [12]. To our knowledge, a few studies have reported the prevalence and clinical features of hyperuricemia in Korea [13-15], but there has been no study on the associations between diet and hyperuricemia among Korean adults. Therefore, the objective of our study was to investigate and compare nutrient intake and diet quality between hyperuricemia subjects and controls in Korea.
Materials and Methods
Subjects
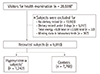
This cross-sectional study compared nutritional intake and quality between hyperuricemia subjects and controls. Of the 28,589 subjects who underwent health examination between January 2008 and December 2011, those that completed a self-administered questionnaire, laboratory tests, and a complete 3-day food record were included. Subjects were excluded who reported an unrealistic daily energy intake (<500 kcal or ≥3,500 kcal). This resulted in 9,010 subjects in the final analysis (Figure 1).
Anthropometric and biochemical measurements
Weight (kg) and height (m) were measured using an automatic body composition analyzer (X-scan Plus II, Jawon Medical, Gyeongsan, South Korea) in light clothing and with shoes off, and body mass index (BMI) was calculated (kg/m2). The waist circumference was taken at the narrowest point between the lower costal margin and the superior iliac crest.
Biochemical data, including uric acid, glucose, and serum lipid such as total cholesterol, serum triglycerides (TG), high-density lipoprotein (HDL) cholesterol, and low-density lipoprotein (LDL) cholesterol levels, were collected from the medical records relating to the health examination. During the screening, venous blood samples were collected in the morning following a 10-12 h overnight fast.
Nutrient intake assessment
Usual dietary intake was assessed using 3-day food records (1 weekend and 2 week days). A self-administered 3-day food record and written instructions were sent via post to the subjects 2 weeks before the scheduled visit.
During the scheduled visit, the food records were reviewed by trained nutritionists using aids such as food models to improve the reporting accuracy. The daily energy, macro-, and micro-nutrient intakes were calculated using the Korean Nutrition Society nutrient database (Can-Pro 3.0, The Korean Nutrition Society, Seoul, South Korea) [17]. Nutrient density (ND) was calculated by standardizing the nutrient intake per 1,000 kcal based on the individual's intake.
Dietary habits and diet quality assessment
Dietary habits were evaluated using a self-reported 10-item questionnaire focusing on skipped meals, meal speed, meal regularity, and preference for salty foods. For each question, subjects selected Yes (1 point) or No (0 points), and the total Food Habit Score (FHS) ranged from 0-10 points. A higher score indicated better food habits.
The nutrient adequacy ratio (NAR; nutrient intake of an individual/recommended nutrient intake for that nutrient) and mean adequacy ratio (MAR; sum of the NAR for all of the nutrients/number of nutrients) were calculated to assess the appropriateness of nutrient intake. In addition, the index of nutritional quality (INQ; nutrient intake per 1,000 kcal/recommended nutrient intake per 1,000 kcal), a comparison of the nutrient intake against the 12 nutrients for which the recommended nutrient intake (RNI) is defined by the Korean Dietary Reference Intake (KDRIs), was analyzed.
Statistical analysis
Data were expressed as frequencies or mean ± standard deviation and were analyzed using SAS ver.9.1 (SAS Institute, Cary, NC, USA). A generalized linear model (GLM) was used to compare the distribution of subjects and the mean differences between the hyperuricemia subjects and controls. The significance level was set at p < 0.05.
Results
The overall prevalence of hyperuricemia was 13.8% (27.1%, men; 5.2%, women), and the proportion of men was significantly higher in the hyperuricemia subjects than in the controls (83.7% vs 49.3%, p < 0.0001). Table 1 provided the demographic and clinical characteristics of the subjects, compared between hyperuricemia subjects and controls. BMI and energy intake were also significantly higher in the hyperuricemia subjects than in the controls (both p < 0.0001).
The age-, sex-, and BMI-adjusted value for waist circumference, triglycerides, total cholesterol, and LDL cholesterol were all significantly higher (p < 0.0001), and HDL cholesterol (p < 0.001) was significantly lower in the hyperuricemia subjects than in controls.
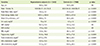
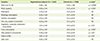
The differences in ND between the hyperuricemia subjects and controls were provided in Table 2. Hyperuricemia subjects had significantly lower intakes of carbohydrate (p < 0.01), fiber (p < 0.001), calcium (p < 0.001), phosphorus (p < 0.001), iron (p < 0.001), sodium (p < 0.05), potassium (p < 0.001), vitamin A (p < 0.01), vitamin B2 (p < 0.01), vitamin C (p < 0.001), and folate (p < 0.001).
Table 3 provided the comparison of daily food group intake between the groups. The intake of vegetables (p < 0.001), seaweed (p < 0.05), and dairy products (p < 0.001) was significantly lower in the hyperuricemia subjects than in controls, and alcohol intake was significantly higher with the hyperuricemia consuming approximately twice the amount of alcohol than the controls (137.1 g vs 69.2 g, p < 0.001). Although the consumption of meat, eggs, fish, and shellfish was higher in the hyperuricemia, the differences were not significant.
Table 4 listed the total and component FHS compared between the hyperuricemia subjects and controls. The total FHS was significantly lower in the hyperuricemia subjects than in the controls (p < 0.001). The items that contributed to the lower score in the hyperuricemia were meal regularity, vegetable consumption, fruit consumption, and dairy product consumption.
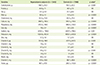
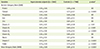
The NAR and MAR values for the hyperuricemia subjects and controls were provided in Table 5. The NARs for calcium (p < 0.001), vitamin A (p < 0.05), vitamin B2 (p < 0.001), vitamin C (p < 0.001), and folate (p < 0.001) were significantly lower in the hyperuricemia subjects than in the controls. The MAR was also significantly lower in the hyperuricemia subjects than in the controls (p < 0.001).
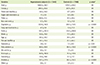
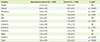
The comparison of the INQ values was shown in Table 6. The INQs for calcium (p < 0.001), vitamin A (p < 0.01), vitamin B2 (p < 0.01), vitamin C (p < 0.001), and folate (p < 0.001) were significantly lower, while the phosphorus (p < 0.01) and iron (p < 0.01) values were significantly higher in the hyperuricemia subjects than in the controls.
Discussion
To our knowledge, this study was the first to compare nutrient intake and diet quality between hyperuricemia subjects and controls in Korea. A larger portion of the hyperuricemia subjects was men, and they also had higher BMIs, poorer lipid profiles, and poorer diet quality than the controls.
Previous studies have also reported that the prevalence of hyperuricemia is higher in men than in women. Such a difference between genders is probably due to the estrogen which purportedly increases urinary excretion of uric acid [11,18]. Poletto et al. [18] reported that the prevalence of hyperuricemia, in 1,330 Japanese-Brazilian adults was lower in younger women than in older women (women <55 years, 24%; women ≥55 years, 76%; p < 0.05). Similarly, in the current study, the prevalence of hyperuricemia was significantly higher in men than in women.
Obesity is another strong risk factor for the development of hyperuricemia. A large prospective study indicated that weight gain was the risk factor for hyperuricemia in men, while weight loss reduced the risk [19]. Our study also showed that BMI was significantly higher in the hyperuricemia subjects than in the controls.
A number of previous studies have reported that hyperuricemia is associated with various chronic diseases such as arterial hypertension, cardiovascular disease, dyslipidemia, diabetes mellitus, and gout, all of which are associated with an increase in mortality risk [3-7, 20-24]. Furthermore, animal studies indicate that a decrease in uric acid levels can prevent or reverse the features of metabolic syndrome [25-26]. We also found significantly higher waist circumference, triglyceride, total cholesterol, and LDL cholesterol and lower HDL cholesterol in the hyperuricemia subjects than in the controls after adjusting for age, sex, and BMI.
Relationships between the consumption of animal protein and hyperuricemia have been reported in the literature [27]. In this study, the intake of the purine-rich foods such as meat, fish, and shellfish tended to be higher in the hyperuricemia subjects than in the controls. The intake of vegetables, seaweed, and dairy products was significantly lower, while alcohol intake was higher in the hyperuricemia subjects than in the controls. Consequently, the intake of fiber, potassium, vitamin C, and folate was lower and resulted in lower NARs for calcium, vitamin A, vitamin B2, vitamin C, and folate in the hyperuricemia subjects than in the controls.
Previous studies indicate that a greater vitamin C intake is independently associated with lower serum uric acid levels via its uricosuric effects [28-29]. The presence of milk-forming proteins such as lactalbumin and casein, which have uricosuric effects [30], may explain the inverse relationship observed between the consumption of dairy products and uric acid levels [31]. However, there does not appear to be an association between calcium supplementation and uric acid levels [2].
Alcohol abuse can increase the production of uric acid by promoting the metabolism of adenine nucleotide to uric acid [32]. In addition, ethanol can decrease renal uric acid excretion through an increase in lactic acid concentrations, which then competitively suppress the excretion of acid in the renal tubules by activating the ion exchange function of human urate anion exchanger (URAT1) to stimulate the reabsorption of uric acid in the proximal tubule [33-34]. We also found that alcohol intake in the hyperuricemia subjects were significantly higher than in the controls.
In summary, the results of the dietary quality indices indicated that the hyperuricemia subjects had poorer diet quality than the controls, especially relating to meal regularity and the intake of vegetables, fruit, and dairy products. Few studies have examined the associations between diet quality and hyperuricemia. However, a number of studies have reported that poor diet quality is likely to result in obesity, abdominal obesity, elevated blood pressure, hyperlipidemia, and other risk factors associated with metabolic syndrome [35-37].
Our study had certain limitations. First, the dietary information might not reflect an individual's usual intake owing to the use of 3-day food records. Second, it was not possible to establish causal associations between hyperuricemia and diet, because of the cross-sectional study design. Therefore, prospective or longitudinal studies are necessary to further elucidate the dietary factors related to hyperuricemia among Koreans. However, the strengths of the current study include the large sample size and the related statistical power. Furthermore, this study was the first to investigate nutrient intake and diet quality in people with hyperuricemia in Korea.
In conclusion, the hyperuricemia subjects reported poorer diet quality than the controls, including higher alcohol intake and lower vegetable and dairy product intake. Our findings suggest that a balanced diet that includes consumption of dairy products and plenty of vegetables, limited alcohol intake, and maintenance of a healthy weight can assist with the management of hyperuricemia. However, further research is needed to clarify the role of dietary factors in hyperuricemia and to establish evidence-based dietary guidelines for the management of hyperuricemia.
 XML Download