

 PDF
PDF ePub
ePub Citation
 Print
Print


INTRODUCTION
Free radicals and reactive oxygen species (ROS) are closely associated with various degenerative diseases, including atherosclerosis, ischemic heart disease, and aging, etc [1,2]. ROS are largely generated from mitochondrial energy metabolism through oxidative phosphorylation and mostly removed by endogenous antioxidants such as superoxide dismutase (SOD), glutathione peroxidase (GPx), and catalase (CAT) [3]. Reactive oxygen species (ROS) such as superoxide, hydrogen peroxide (H2O2), and hydroxyl radical have been recognized as one of the factors involved in the mechanisms of a variety of diseases, including cardiovascular dysfunction, atherosclerosis, inflammation, carcinogenesis, and reperfusion injury [4]. Many results have suggested that levels of oxygen free radicals are increased in hypercholesterolemia. The increase in oxygen free radicals could be due to their overproduction and/or decreased antioxidant reserve and antioxidant enzyme activity [5].
In recent years, increased attention has been focused on industrial wastes, particularly those containing residual phenols from plant raw materials [6]. Grape is one of the most commonly consumed fruits in the world. It has various biological functions, due to its rich polyphenol ingredients, most of which are contained in its seeds (60-70%) and skin (30%) [7]. Grapes are antimutagenic, antineoplastic, and reduce human low-density lipoprotein (LDL) oxidation and allergic inflammation [8].
Grape seeds, which are removed as pomace during the winemaking process, are also known to be a rich source of polyphenols. Unlike the skin of grapes, grape seeds contain little resveratrol [9]. Grape products made from grape seed, grape skin, and grape juice, including red wine, contain a wide variety of powerful antioxidants in the form of polyphenols, which include phenolic acids (e.g., gallic acid), resveratrol, proanthocyanidins, and flavonoids such as anthocyanins, flavonols, and quercetin [10]. Grape skin, seeds, and stems are known to contain the highest concentration of polyphenols [11]. Grape seeds are increasingly being used to obtain functional food ingredients such as natural antioxidants and dietary supplements [12].
No previous study on the lipid lowering and hepatoprotective effects of red grape dried seeds (RGDS) on paracetamol-induced hepatotoxicity in rats has been reported. Therefore, in the current study we planned to evaluate the protective effect of RGDS on lipid metabolism and liver and kidney functions in rats suffering from paracetamol-induced hepatotoxicity.
MATERIALS AND METHODS
Chemicals
Unless stated otherwise, all chemicals and Biochemical Kits used for determinations were of analytical grade and procured from Sigma Chemicals Co., USA.
Preparation of plant materials
Freshly harvested ripened red grapes (Vitis vinifera) were purchased from a local farm in Riyadh. Grapes were excised from the stems, sorted, and washed. Seeds were manually removed from grapes and oven dried at 70℃ (in order to prevent lipid degradation) for 7 hours until the moisture level was constant (6.2% w/w). Dried grape seeds were ground to a powdered form using an electric grinder and passed through a 0.5 mm sieve and kept in a desiccator until use [13].
Estimation of total phenolics
Total phenolic content of the extract was determined using the Folin-Ciocalteu micro-method [14]. Briefly, 20 µl of ethanol extract were mixed with 1.16 ml distilled water and 100 µl of Folin-Ciocalteu reagent, followed by addition of 300 µl of Na2CO3 solution (20%) after 1 min and before 8 min. Subsequently, the mixture was incubated in a shaking incubator at 40℃ for 30 min and its absorbance was measured at 760 nm in a Cintra 20 (GMBH, Germany) double beam spectrophotometer. The phenolic content was expressed as gallic acid equivalents using the following linear equation based on the calibration curve: A = 0.98C + 9.925 × 10⁻³; R2 = 0.9996, where A is the absorbance and C is concentration as gallic acid equivalents (µg/g).
Determination of total antioxidant activity:
The total antioxidant activity of the RGDS was evaluated using the phosphomolybdenum complex method [15]; 0.4 mL of sample solution (RGDS extract) (100 µL/mL methanol) was combined with 4 mL of phosphomolybdenum complex containing 0.6 M sulphuric acid, 2 mM sodium phosphate, and 4 mM ammonium molybdate. Test tubes were capped and placed in hot water for 90 min at 95℃. Samples were cooled to room temperature and the absorbance was measured at 695 nm on a spectrophotometer (TU-1800; Human Corporation). Antioxidant activity was expressed as the mg ascorbic acid equivalent per mL (mg AE/mL).
The basal diet was prepared using AIN-93 according to the method described by Reeves et al. [16]. It consists of 20% protein (casein), 10% sucrose, 4.7% corn oil, 2% choline chloride, 1% vitamin mixture, 3.5% salt mixture, and 5% fiber. The remainder was corn starch up to 100%.
Experimental animals
Thirty five adult male rats of Sprague Dawley Strain weighing 180 ± 10 gm, procured from the college of pharmacy, King Saud University, KSA, were maintained in an air conditioned room (25 ± 1℃) with a 12 h light/12 h dark cycle. Feed and water were provided ad libitum for one week before the start of the experiment for adaptation. Procedures involving animals and their care were approved by the CAMS Research Ethics Committee, King Saud University. (Ethics Number: CAMS 22 -34/35).
Paracetamol-induced hepatotoxicity
After adaptation, rats were randomly divided into five groups of seven animals each. Group I (normal control) animals were administered only basal diet. Group II served as a treated group (positive control). Groups III-IV were given basal diet containing 5%, 10%, and 20% red grape dried seeds (RGDS), respectively. Supplemented levels were altered by partially replacing the starch in the basal diet with 5, 10, and 20% powdered dried RGDS. All of these treatments were administered for six weeks. On the last day of the treatments, animals in groups II-V received a single dose of paracetamol suspension, administered by oral route, at a dose of 750 mg/kg body weight.
The biochemical parameters were estimated after an 18h fast following the last dose. Food intake was calculated daily and body weight gain was recorded weekly [17]. Feed efficiency ratio (FER): FER = weight gain (g)/ feed intake (g) was then calculated. At the end of the experimental period, the animals were anesthetized by anesthetic ether. The liver samples were dissected and blood was collected [18]. Livers were immediately dissected out, and washed in ice-cold saline for removal of blood. Tissues were sliced into pieces and homogenized in an appropriate buffer (pH 7.0) in cold condition to give 20% homogenate (w/v). The homogenates were centrifuged at 1000 rpm for 10 min at 0℃ in a cold centrifuge. The supernatants were separated and used for various biochemical estimations.
Assessment of hepatoprotective activity
The collected blood was allowed to clot and serum was separated at 2500 rpm for 15 min. The biochemical parameters such as aspartate aminotransferase (AST, U/L), alanine aminotransferase (ALT, U/L) [19] and alkaline phosphatase (ALP, U/L) [20] were determined. Serum urea nitrogen, uric acid and creatinine were determined according to the methods described by Patton and Crouch [21], Fossati et al. [22] and Husdan and Rapoport [23]. respectively. Serum cholesterol was determined according to the enzymatic method described by Allain et al. [24], serum triglycerides were colorimetrically determined according to the method described by Wahlefeld [25], HDL-c was determined according to the method described by Albers et al. [26], while concentration of VLDL-c was estimated according to the method described by Friedewald's equation (27). According to the method described by Friedewald et al. [27]. Low density lipoprotein cholesterol can be calculated as follows : LDL-c = Total cholesterol - (HDL-c) - (VLDL-c).
Lipid peroxidation and non-enzymatic antioxidant biomarker:
Liver homogenates were used for determination of tissue lipid peroxide (MDA), non-enzymatic antioxidant biomarkers (GSH), and enzymatic antioxidant biomarkers (SOD and CAT). Lipid peroxidation (LPO) was determined by quantifying malondialdehyde (MDA) that formed in terms of thiobarbituric acid reactive substances (TBARS) using the methods of Rudnicki et al. [28]. As follows: In a centrifuge tube, 600 µl of trichloroacetic acid solution (10%, w/v) were added to 300 µl of the liver slices homogenate and centrifuged at 10,000 rpm for 10 min; 400 µl of supernatant were taken in a clean test tube then mixed well with 400 µl of thiobarbituric acid solution (0.67%, w/v). After 30 min in a boiling water bath, the reaction mixture was cooled to room temperature, and the absorbance (A) was measured at 532 nm using a Jenway 6300 spectrophotometer. The malondialdehyde (MDA) content (µmol/ml) was calculated using molar extinction coefficient (156,000 M/cm). The data are expressed as MDA equivalents (µmol/mg protein). Reduced glutathione (GSH) was estimated using the methods of Ellman [29], as follows; 0.1 ml of liver tissue homogenate, 2.4 ml of 0.02 M EDTA solution was added and kept on an ice bath for 10 min. Then 2 ml of distilled water and 0.5 ml of 50% TCA were added. This mixture was kept on ice for 10-15 min and then centrifuged at 3000 rpm for 15 min; 1 ml of supernatant was taken and 2 ml of Tris-Hcl buffer was added. Then, 0.05 ml of DTNB solution (Ellman's reagent) was added, followed by thorough vortexing. OD was read (within 2-3min after addition of DTNB) at 412 nm against a reagent blank. Absorbance values were compared using a standard curve generated from known GSH.
Enzymatic antioxidant biomarkers
The activities of liver tissue superoxide dismutase (SOD) was determined calorimetrically according to the method described by Spitz and Oberley [30]; in brief, for SOD activity assays, liver tissue was homogenized in 50 mM potassium phosphate buffer, pH 7.8, and SOD activity in the homogenates was measured using the nitroblue tetrazolium (NBT)-bathocuproine sulfonate (BCS) reduction inhibition method. Sodium cyanide at 5 mM was used to inhibit Cu/ZnSOD and thus measure only MnSOD activity. BCS and sodium cyanide were purchased from Aldrich. Catalase (CAT) was determined according to Sinha [31]. Using, the Sinha method, based on reduction of dichromate in acetic acid to chromic acetate when heated in the presence of hydrogen peroxide, chromic acetate was measured at 570 nm. One unit of CAT activity is defined as the amount of enzyme that degrades one mmol H2O2/min.
Histopathological studies
For histological studies, the liver tissues were fixed with 10% phosphate buffered neutral formalin, dehydrated in graded (50-100%) alcohol, and embedded in paraffin. Thin sections (5 M) were cut and stained with routine hematoxylin and eosin stain for photo microscopic assessment. The initial examination was qualitative, with the purpose of determining histopathological lesions in liver tissue.
RESULTS
Determination of total phenols and total antioxidants of RGDS extract
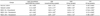
Data from determination of total phenols and total antioxidants of RGS extract are shown in Table 1. The mean value of total phenols expressed as gallic acid equivalent per 100 ml RGS extract was 1.438 mg·mL-1, while the total antioxidant activity in RGS extract was 1.231 mg·mL-1, expressed as ascorbic acid equivalent.
Effect of RGDS levels on food consumption, body weight Gain ratio, and FER
From the data in Table 2, it could be observed that rats in paracetamol induced control showed a significant increase in food consumption and body weight gain ratio compared with rats fed the basal diet (Normal Control), vice versa for food efficiency ratio (FER). In addition, all paracetamol groups administered different levels of RGDS (5, 10, and 20%) showed a decrease in food consumption and no significant decrease in body weight gain ratio compared with the induced control group. No significant differences in body weight gain and FER were observed between all RGDS groups.
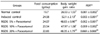
Effect of RGDS levels on serum lipid profiles
Data in Table 3 show the effect of RGDS levels on serum lipid profiles of paracetamol-induced hepatotoxicity in rats. Administration of paracetamol (750 mg/kg/body weight) resulted in a significant (P < 0.05) increase in total cholesterol, triglycerides, low density lipoprotein (LDL-c), and very low density lipoprotein (VLDL-c) while the level of high density lipoprotein (HDL-c) showed a significant (P < 0.05) decrease compared with normal control. Treatment with RGDS (5, 10, and 20%) resulted in significant (P < 0.05) differences in change of the mentioned lipid parameters towards normal levels.
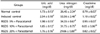
Effect of RGDS levels on serum kidney functions and liver biomarkers
Tables 4 and 5 show the effects of RGDS levels on serum kidney functions and liver biomarkers of paracetamol-induced hepatotoxicity in rats. Paracetamol induced control showed a significant (P < 0.05) increase in serum uric acid, urea nitrogen, and creatinine compared with normal control. In addition, serum hepatic biomarkers AST, ALT, and ALP showed a significant (P < 0.05) increase in induced control compared with normal control. On administration of RGDS with different levels (5, 10, and 20%), a significant (P < 0.05) decrease was observed in kidney and liver biomarkers, bringing them near to normal level compared to induced control.
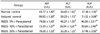
Effect of RGDS levels on liver tissues Lipid peroxide MDA, GSH, SOD, and CAT
The effects of RGDS administration with different levels on rat liver lipid peroxidation, glutathione and enzymatic antioxidants, SOD and CAT, levels of paracetamol-induced hepatotoxicity in rats are shown in Table 6. The levels of lipid peroxidation were significantly (P < 0.05) increased in rats treated with paracetamol as compared to the normal control. Administration with RGDS levels (5, 10, and 20%) caused a significant (P < 0.05) decrease in levels of lipid peroxidation and brought them near to normal level. A significant (P < 0.05) decrease in activities of GSH, SOD, and CAT was noted after administration of paracetamol. When rats were fed the basal diet containing RGDS levels for six weeks, the activities of GSH and enzymatic antioxidants were significantly (P < 0.05) reversed to near normal.
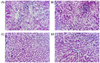
Effect of RGDS levels on Liver histopathological examination
Microscopic examination of liver of rat in the normal control group, showing the normal histological structure (Fig. 1). Microscopic examination of liver of rats of induced control showed more severe degeneration alteration, swelling of hepatocytes, and mild inflammatory reaction. In addition, microscopic examination of liver of rats fed the basal diet containing different levels of RGDS showed mild histological alteration in hepatocytes for 5% and 10% RGDS, while microscopic examination of liver for 20% RGDS showed apparent normal histological structure.
DISCUSSION
Paracetamol (acetaminophen) is a commonly and widely used analgesic and antipyretic agent. Hepatotoxic doses of acetaminophen deplete the normal levels of hepatic glutathione, when NAPQI covalently binds to cysteine groups on proteins to form 3-(cystein-S-yl) acetaminophen adducts [32]. Liver is considered to be highly sensitive to toxic agents, so that glutathione protects hepatocytes by combining with the reactive metabolite of paracetamol thus preventing their covalent binding to liver proteins [33].
In the current study, we investigated the lipid lowering and hepatoprotective effects of Vitis vinifera dried seeds (RGDS) on paracetamol-induced hepatotoxicity in rats.
In paracetamol induced rats, the rate of food consumption, body weight gain ratio and levels of serum TC, TG, LDL-C, and VLDL-C showed a significant increase, while the levels of FER and HDL-C showed a significant decrease as compared to rats on normal control. When basal diet was co-administered with 5, 10, and 20% RGDS, the elevated levels of the above changes showed a considerable decline to those of near normal control rats.
Ample evidence exists with respect to the fact that HDL cholesterol is inversely related to total body cholesterol and a reduction of plasma HDL cholesterol concentration may accelerate the development of atheroscelerosis leading to ischemic heart disease, by impairing the clearing of cholesterol from the arterial wall [34]. Flavonoids and phenolic compounds are reported to inhibit oxidation processes and act cytotoxically, resulting in development of different diseases [35], and increase in HDL-C concentration and decrease in LDL and VLDL levels in hypercholesteremic and hepatotoxic rats [36]. Flavonoids, polyphenols, and antioxidant contents found in RGDS could therefore be considered favorable in increasing HDL and decreasing TC, TG, LDL, and VLDL in RGDS treated groups.
In this study it was observed that rats treated with paracetamol showed a significant increase in serum uric acid, urea nitrogen, and creatinine concentrations. The elevated urea level in hepatotoxic rats is likely due to increased amino acid catabolism, impaired kidney function, or liver damage [37,38]. Creatinine is thought to be a more reliable indicator of kidney function as it shows how well the kidneys are filtering out toxins and is less dependent on dietary factors and hydration status. When rats consumed a diet containing different levels of RGDS, the increased levels of serum kidney parameters were significantly attenuated, which may be due to minimized paracetamol toxicity, which might be associated with disorders in intrarenal prostaglandins and abnormalities in the renal nitricoxide system induced by lipid peroxidation or its effect on renal cells based on the oxidative stress action and enhancing renal functions. On the other hand, the elevated levels of hepatic biomarkers (AST, ALT, and ALP) due to hepatic damage were caused by paracetamol induction. In rats who consumed diets containing RGDS (5, 10, and 20%) elevated levels of serum hepatic markers were significantly attenuated, suggesting that RGDS levels are able to protect the cell membrane integrity against paracetamol-induced leakage of hepatic marker enzymes into the circulation.
Administration of paracetamol resulted in significant elevation of the hepatic tissue malondialdehyde (MDA) (a biochemical marker of lipid peroxidation) concentration to approximately 2-fold of the results observed in normal control. On the other hand, GSH and the non-enzymatic antioxidants such as SOD and CAT were reduced significantly in induced control. The RGDS treated groups were shown that the above parameters significant restore to near the normal level. Oxidative stress has been reported as a major cause of paracetamol-induced liver damage, and excessive production of free radicals resulting from oxidative stress can damage macromolecules as lipids. Paracetamol injection increased liver MDA level while decreasing GSH, SOD, and CAT; these results were in agreement with results reported by Hazem [39] and Deepak et al. [40]. In conclusion, the current study showed that RGDS can play a role in prevention of risk of developing oxidative stress and hepatotoxicity which led to regulation of serum TC, TG, LDL-c, and VLDL-c with a significant decrease and elevation of HDL-c and improvement of liver (AST, ALT, and ALP) and kidney (uric acid, urea nitrogen, and creatinine) biomarkers. The marked increase in the hepatoprotective effect with restoring the antioxidant enzyme concentrations to near the normal levels, which appeared in decreasing the level of MDA and increasing the GSH, SOD, and CAT status, may be due to total antioxidant activity and total phenol contents of RGDS. In addition, the histopathological observations were supported for the reversal of all biochemical parameters in the RGDS treated groups, particularly for the 20% RGDS group.


 XML Download