

 PDF
PDF ePub
ePub Citation
 Print
Print


INTRODUCTION
Diabetes mellitus is a chronic metabolic disease that now affects 3% of the world's population. The disease is characterized by chronic hyperglycemia, disorders of carbohydrate and lipid metabolism, and microvascular pathology in the retina, renal glomeruli and peripheral nerves [1].
Recently, here has been a growing interest in hypoglycemic agents from natural products, especially those derived from plants, because compared to synthetic sources, plant sources are usually considered to be less toxic, and to have fewer side effects [2]. Many traditional remedies for diabetes mellitus involve the use of plant sources, and over 200 pure phytochemicals are currently known to have hypoglycemic properties. However, most of them have been shown to exert little or no effect on glycemic control in experimental studies [3]. Purple corn (Zea mays L.), is rich in anthocyanins and bioactive phenolics. It has been cultivated and used for centuries to prepare drinks and desserts in South America, mainly in Peru and Bolivia [4]. The anthocyanins present in the flowers, leaves, cobs, and seeds of Andean purple corn have previously been characterized, and the major anthocyanins identified were cyanidin-3-dimalonyl-glucoside, cyandin-3-glucoside, pelargonidin-3-glucoside, peonidin-3-glucoside, and their respective malonated counterparts [5]. Recently, anthocyanins have been reported to have various biological activities, such as antioxidant, anti-inflammatory, anti-mutagenic, and anticancer activities [6,7,8,9]. Furthermore, anthocyanin- rich purple corn extract (PCE) ameliorated insulin resistance and reduced diabetes-associated mesanginal fibrosis and inflammation, suggesting that it may have benefits for the prevention of diabetes and diabetes complications [10,11].
In this study, we determined the anthocyanins and non-anthocyanin component of PCE by high-performance liquid chromatography electrospray tandem mass spectrometry (HPLC-ESI-MS) and investigated its anti-diabetic activity and mechanisms using C57BL/KsJ db/db mice, a type 2 diabetes animal model.
MATERIALS AND METHODS
Materials
Purple corn kernels were provided by the Corn Research Institute in Gangwon Province, Korea. The voucher specimen (No. RIC-2329) was deposited and maintained at the center for efficacy assessment and development of functional foods and drugs (Regional Innovation Center), Hallym University, Chuncheon, Korea. Dried purple corn kernels (5 kg) were ground and mixed with 30 L of 30% ethanol-water solution in a glass chamber, which was used to perform the extraction at room temperature for 20 h. The extracts were combined and concentrated under reduced pressure by using a Model EYELA N-1000 rotary evaporator (Tokyo Rikakikai, Tokyo, Japan) and freeze-dried (yield: 410 g, 8.2%). The dried extract was stored at -20℃ until used for the following experiments.
Animals
Six-week old C57BL/KsJ db/db mice were purchased from Central Lab Animal (SLC, Japan). All animals were acclimatized to the laboratory environment for 1 week before the experiment. Mice were allowed free access to drinking water and food under constant room temperature (22 ± 2℃) and humidity (50% ± 10%) under an automatic 12 h light/12 h dark cycle. The mice were cared for and treated in accordance with the guidelines of the Committee on Care and Use of Laboratory Animal Resources, National Research Council, USA. The mice were randomly divided into 4 groups: diabetic control (DC), PCE 10 mg/kg (PCE 10), PCE 50 mg/kg (PCE 50), pinitol 10 mg/kg (Pinitol 10). Each group was treated with drugs by oral administration once per day for 8 weeks. During the experiment, body weights and blood glucose levels of the mice were measured once every week. All animal experiment procedures conducted in accordance with guidelines and approval of the Institutional Animal Care and Use Committees (IACUC) of Hallym University (Hallym-2012-37).
High performance liquid chromatography-mass spectrometry
Separation of anthocyanins and non-anthocyanins was conducted on a reverse-phase Capcell Pak C18 UG 120 S5 column (4.6×150 mm I.D., 4 µm; Shiseido Co., Ltd, Tokyo, Japan) using a Finnigan Surveyor high-performance liquid chromatography (HPLC) system (Thermo Quest, San Jose, CA, USA) at an ambient temperature. The mobile phase was a binary elution of 5% formic acid solution (A) and 100% methanol (B) under the following gradient conditions: initial, 20% B; 7 min, 20% B; 15 min, 25% B; 32 min, 50% B; 36 min, 100% B; 38 min, 100% B; 40 min, 20% B and 45 min, 20% B. The flow rate was 700 µl/min, and the injection volume was 10 µl. Eluted substances were detected at 280 nm and 570 nm by using a photodiode-array detector between 200 and 600 nm with a bandwidth of 1 nm. For the identification of major components, the column elute was split, and 0.2 ml·min-1 was directed to a Finnigan LCQ Advantage ion-trap MS (Thermo Quest, San Jose, CA, USA) equipped with an electrospray ionization (ESI) interface after passing through the flow cell of the photodiode-array detector. Analysis was carried out using positive ion monitoring at a capillary temperature of 280℃, spray voltage of 5.5 kV, capillary voltage of 10 V and tube lens offset of -5.0 V. Spectral data were recorded using He gas as a collision gas. Anthocyanins and non-anthocyanins were detected using m/z value following MS/MS. The MS/MS collision energy was set to 35%. Data were collected using dual analysis in fullscan mode from 100 to 1000 atomic mass units and MS/MS modes. Data were processed using the Xcalibur 2.0 version software program (Thermo Electron Corporation, San Jose, CA, USA).
Oral glucose tolerance test
The mice were fasted for 12 h prior to the experiment, and PCE was administered orally 30 min prior to the glucose challenge. Glucose (1.5 g/kg) was orally administered at 0 min, and blood was withdrawn from the orbital venous plexus at 0 min, 30 min, 60 min, 90 min and 120 min after glucose administration. Blood glucose levels were determined by the glucose oxidase method [12].
Blood biomarker
Blood samples were drawn from an antecubital vein. Serum was separated immediately by centrifugation (2000 × g at 4℃ for 3 min) and stored at -70℃. Serum concentrations of triglycerides (TG), total cholesterol and high-density lipoprotein (HDL) were analyzed using commercial kits (971769, 981771 and 971656, respectively, Thermo Electron Corporation, Vantaa, Finland) and Thermo Fisher Konelab 20XTi Analyzer (Thermo Electron Corporation, SeoKwang LABOTECH, Seoul, Korea). Blood glycated hemoglobin (HbA1c) was measured on an HbA1c Analyzer (HLCr-723GHb G7; Tosoh, Aarhus V, Denmark). Serum insulin, adiponectin, C-peptide, and glucagon concentrations were determined using a mouse insulin ELISA kit, C-peptide ELISA kit, and Glucagon ELISA kit, respectively (all from Shibayagi Co.,Ltd., Shibukawa, Japan).
Western blot analysis
After sacrificing the mice, adipose tissues were immediately removed, instantly placed in liquid nitrogen, and subsequently stored at -70℃. Protein extracts were prepared using a protein extraction kit (Intron Biotechnology Inc., Seoul, Korea). Lysates (30 µg) were electroblotted onto a nitrocellulose membrane following separation using 10% SDS-polyacrylamide gel electrophoresis. Blotted membranes were incubated for 1 h with blocking solution (tris-buffered saline with Tween 20. [TBST]) containing 5% skim milk (w/v) at room temperature, followed by incubation overnight at 4℃ with 1 : 1000 dilution of AMP activated protein kinase (AMPK), phosphor-AMP-activated protein kinase (p-AMPK), acetyl-coA carboxylase (ACC), phosphor-acetyl-coA carboxylase (p-ACC) primary antibody (Cellsignaling, Danvers, MA, USA). Membranes were washed 4 times with 0.1% TBST and incubated with 1 : 3000 dilution of horseradish peroxidase-conjugated goat anti-rabbit or donkey anti-rabbit IgG secondary antibody for 1 h at room temperature. Membranes were washed four times in TBST and then developed by WEST-ZOL® PLUS (Intron Biotechnology Inc., Seoul, Korea).
RNA isolation and reverse transcription-polymerase chain reaction (RT-PCR)
Total mRNA was isolated from db/db mice liver using an Easy-Blue kit (Intron Biotechnology Inc, Seoul, Korea) according to the manufacture's instructions. From each sample, total RNA (10 µg) was reverse transcribed into cDNA using the Moloney murine leukemia virus transcriptase and Oligo (dT) 15 primers (Promega, Medison, WI, USA) as primers. Sequence of primers are following: PEPCK (phosphoenolpyruvate carboxykinase) sense ATG CCT CCT CAG CTG CAT A, anti-sense TTA CAT CTG CGT GAT TCT CTG TT; G6pase (glucose 6-phosphatase) sense ACC CTG GTA GCC CTG TCT TT, anti-sense GGG CTG TGT CTT CTG TGT CG; actin sense GTC GTA CCA CTG GCA TTG TG, anti-sense GCC ATC TCC TGC TCA AAG TC; GLUT4 (glucose transpoter 4) sense CAA CGT GCC TGG GTA GGC A, anti-sense GCC ATC TCC CCC GCG CGG T; CPN (cyclophilin) sense ATG GTC AAC CCC ACC GTG, anti-sense TTA GAG TTG TCC ACA GTC GGA GA. The primers were added at a final concentration of 0.5 µM to a 25 µL reaction mixture containing 20 mM Tris-HCL (pH 8.4), 50 mM KCl, 1.5 mM MgCl2, 0.5 mM each dNTP, 5 µL of cDNA, and 2.5 units of Taq DNA polymerase (Takara Korea Biomedical Inc., Seoul, Korea). The PCR conditions were denaturation at 95℃ for 1min, annealing at 57℃ for 1 min, and extension at 72℃ for 1 min. The RT-PCR products were electrophoresed in 1% agarose gels under 100 V and stained with 0.5 µg/mL ethidium bromide.
Microarray analysis
For gene expression profiling, the synthesis of target cRNA probes and hybridization were performed using Agilent's Low RNA Input Linear Amplification Kit (Agilent Technnology, Santa Clara, CA, USA) according to the manufacturer's instructions. Fluorescent-labeled cRNA target was quantified using ND-1000 spectrophotometer (NanoDrop Technologies, Inc., Wilmington, DE, USA). The hybridization images were analyzed by Agilent DNA microarray Scanner (Agilent Technology, Santa Clara, CA, USA) and the data quantification was performed using Agilent Feature Extraction software 9.3.2.1 (Agilent Technology, Santa Clara, CA, USA). The average fluorescence intensity for each spot was calculated and local background was subtracted. All data normalization and selection of fold-changed genes were performed using GeneSpringGX 7.3.1 (Agilent Technology, Santa Clara, CA, USA).
Pancreas histology and immunohistochemistry
The pancreas was removed and fixed in 10% (v/v) neutral buffered formalin, processed routinely, and embedded in paraffin wax. Paraffin sections were cut at 4 µm thickness and deparaffinized in xylene for 5 min, and rehydrated through graded ethanol solutions. The sections were stained with hematoxylin and eosin (H&E). For immunohistochemistry, rehydrated sections were treated with 3% (v/v) H2O2 in methanol for 30 min to block endogenous peroxidase, washed with 0.01 mM phosphate buffer for 10 min, and then immunostained with the monoclonal mouse anti-insulin primary antibody. The antigen-antibody complex was visualized by an avidin-biotin peroxidase complex solution using an ABC kit (Vector Laboratories, Burlingame, CA, USA) with 3, 3-diamino benzidine (Zymed Laboratories, San Francisco, CA, USA).
Results
Identification of anthocyanins and non-anthocyanins from PCE by LC-MS
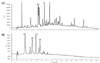
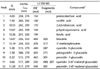
HPLC spectra at λ = 280 nm showed that 7 non-anthocyanins were identified by their HPLC retention times, elution order, spectroscopic characteristics and fragmentation pattern by comparison with previously reported literature (Fig. 1A). The 7 major non-anthocyanins were identified as protocatechuic acid, vanillic acid, 2, 4, 6-tribenzoic acid, p-hydroxycinnamic acid, ferulic acid, hirsutrin, and 3'-methoxyhirsutrin. Fig. 1B shows the chromatograms of anthocyanins identified in PCE. The 5 major anthocyanins were identified as cyanidin 3-glucoside, pelargonidin 3-glucoside, peonidin 3-glucoside, cyanidin 3-(6"-malonyl-glucoside), and peonidin 3-(6"-malonyl-glucoside) by using LC-ESI-MS (Table 1). The MS/MS spectra of the anthocyanins provided clear and characteristic fragmentation data. The aglycones of anthocyanins were cyanidin (molecular weight [MW; 287]), peonidin (MW; 301) and pelargonidin (MW; 271).
Effect of PCE on metabolic parameters
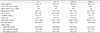
Table 2 shows the effects of PCE (10, 50) and pinitol 10 on metabolic parameters in diabetic db/db mice treated for 8 weeks. Compared to DC group, there were no significant differences in body weight between DC and PCE (10, 50) and pinitol 10 groups. PCE (10, 50) and pinitol 10 groups showed decrease in food and water intake but not significant. Plasma glucose levels were significantly decreased by 52% (P < 0.001) in PCE 10, 68% (P < 0.001) in PCE 50 and 52% (P < 0.001) in Pinitol 10 compared to DC. The serum insulin level in the PCE 10 and Pinitol 10 treated db/db mice was significantly increased by 1.8 fold (P < 0.001), 1.5 fold (P < 0.001) as compared to the control groups, respectively.
The level of serum C-peptide increased by 1.4 and 1.9 (P < 0.05) fold in the PCE 10 and PCE 50 groups, respectively. HbA1c levels in the PCE 50 mice were decreased by 20% (P < 0.05), when compared to DC group. In the PCE 10 and PCE 50 groups, adiponectin levels were enhanced by 59% (P < 0.05) and 53% (P < 0.05), respectively, compared with the DC group. In this experiment, glucagon levels in PCE 50 treated mice were decreased by 40% (P < 0.05) when compared to DC group, and these data revealed a similar trend in serum insulin levels. In the PCE 10, 50 and pinitol 10 groups, triglyceride (TG) levels were lowered by 48% (P < 0.01), 53% (P < 0.01) and 41% (P < 0.01) compared with the DC group, respectively. The total cholesterol (TC) level in the PCE treated groups showed no significant differences, but the HDL-cholesterol level in the PCE 50 group was significantly higher (by 28%) than those in the DC group.
Effect of PCE on oral glucose tolerance test
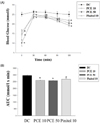
Oral glucose tolerance tests were performed to determine the effect of a single oral dose of PCE on glucose tolerance using the db/db mice (Fig. 2). Glucose challenge dramatically increased blood glucose levels in control mice, whereas PCE-treated groups had suppressed blood glucose levels 30, 60, and 90 min after glucose load (Fig. 2A). When the area under the curve (AUC) was compared between groups, the PCE 10 and PCE 50 groups showed 12% and 13% reduction, respectively, compared to the control group (Fig. 2B).
Morphology and insulin immunostaining in pancreas
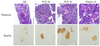
Typical H&E staining results obtained upon histological examination were shown in Fig. 3. The diabetic islets in control mice were atrophied, indicating β-cell damage. PCE treatment prevented islet destruction and resulted in significantly preserved insulin levels (brown in the cytoplasm of pancreatic tissue sections) in a concentration-dependent manner.
Liver and adipose tissue molecular profiles
To compare the gene expression profiles of PCE treated and control db/db mice, we used microarray assay in the liver and adipose tissue (Table 3). Among 25,262 genes expressed in liver and 27,730 genes expressed in adipose tissue, we found 2 genes significantly up-regulated in liver and 3 genes in adipose tissue showing significant up-or down-regulation, compared to the DC group.
AMPK, GLUT4 and gluconeogenesis gene expression
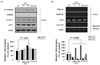
As shown in Fig. 4, PCE markedly phosphorylated AMPK and ACC compared to DC group (Fig 4A). In addition, PCE-treated groups over expressed the mRNA of GLUT4 in the skeletal muscle, indicating facilitation of glucose uptake into the insulin-dependent tissue. Interestingly, expression of PEPCK and G6Pase, a rate-limiting enzyme in gluconeogenesis pathway, was almost completely decreased compared to DC group (Fig. 4B). As a result, through AMPK activation, PCE reduced hepatic glucose production through inhibiting PEPCK and G6Pase expression and higher mRNA expression of GLUT4 in PCE-treated mice reflects an increase in glucose flux into skeletal muscle.
Discussion
In this study, we demonstrated that PCE significantly ameliorated hyperglycemia and hyperlipidemia by reducing the blood glucose levels and increasing the serum insulin, C-peptide, HbA1c, and adiponectin concentrations in type 2 diabetic C57BL/KsJ db/db mice. Diabetes mellitus is sub-divided into two main forms. Type 1 diabetes mellitus (T1DM) is mainly due to an auto-immunemediated destruction of pancreatic β-cell islets. On the other hand, type 2 diabetes mellitus (T2DM) is characterized by insufficient insulin secretion and insulin resistance [13]. Type 2 diabetes is a chronic metabolic disorder affecting approximately 3% of population worldwide. But the conventional pharmacological treatments for type 2 diabetes have a number of limitations, such as adverse effects and high rates of secondary failure [14]. Anthocyanins are a subclass of flavonoids that have been reported to improve insulin resistance and hyperlipidemia in several models of obesity and diabetes in rodents [15]. Interest in anthocyanins as natural colorants and valueadded ingredients has increased due to their color characteristics and potential health benefits. Chinese purple corn extracts were a natural source of anthocyanins and were stable over a wide range of temperatures and times [16]. This study identified 7 major non-anthocyanins and 5 major anthocyanins in puple corn extracts (Table 1, Fig. 1). Recent studies indicate that diabetic atherosclerosis is not only a disease of hyperlipidemia but also an inflammatory disorder [17]. Existing evidence indicates that obesity-related insulin resistance results in a systemic prothrombotic state and might enhance the progression of atherosclerotic lesions [18]. In our study, we found that PCE 10 and PCE 50 groups showed 52% and 68% reduction in blood glucose levels, respectively, compared to DC group, but not significantly change body weight, food and water intake (Table 2). The serum insulin level in the PCE 10 and Pinitol 10 treated db/db mice was significantly increased by 1.8 fold, 1.5 fold as compared to the control groups, respectively. Pinitol (D-3-O-methyl-chiro-inositol) has been reported to exert insulin-like effects. Pinitol extracted from Bougainvillea spectabilis reduced blood glucose in animal models of diabetes [19]. And also administration of PCE for 8 weeks resulted in significantly increased serum insulin, C-peptide, and adiponectin concentrations as compared to the DC group (Table 2). Similarly, Hong et al. [20] had reported that insulin level increased after treatment of purple corn anthocyanins in pancreatic β-cell. In the present study was also a significant increase in the levels of serum insulin and less destructed β-cells after administration of PCE to db/db mice. PCE less destructed β-cells and increased insulin secretion by decreasing blood glucose (Fig. 3).
OGTT is one of the most critical criteria for evaluating the effectiveness of hypoglycemic drugs [21]. PCE might enhance glucose utilization because they significantly reduced the blood glucose level in db/db mice. In glucose-fed mice, the elevated blood glucose levels remained higher after 120 min. PCE significantly inhibited increases in the blood glucose level during the OGTT in db/db mice (Fig. 2). PCE significantly improved glucose tolerance and this fact could be attributed to the potentiation of the insulin effect of plasma by increasing the pancreatic secretion of insulin from existing β-cells or its release from bound insulin.
GK, G6pase, and glucose-6-phosphate dehydrogenase (G6PD) are important enzymes in carbohydrate metabolism [22]. Analysis of liver enzyme activity in the present study indicated that GK activity was also increased following PCE 50 treatment, by 37% as compared to the DC group (data not shown). Acyl-Coenzyme A oxidase 1 (ACOX1) and carnitine acetyltransferase (Cpt) are important proteins involved in fatty acid β-oxidation [23,24,25,26,27] and acyl-CoA synthetase long-chain family member 5 (ACSL5) is involved in lipogenesis [28,29]. Microarray analysis identified 2 genes with increased liver expression levels and 3 genes with altered adipose expression in PCE-treated db/db mice (Table 3). These results indicated that PCE may affect expression of some genes involved in carbohydrate and lipid metabolism and promote fatty acid oxidation in adipose tissue.
AMPK belongs to the family of energy sensing enzymes that are activated by cellular stresses resulting in ATP depletion, thus acting like a 'fuel gauge' [30]. Upon activation, AMPK functions to restore cellular ATP by inhibiting ATP consumption processes as well as accelerating ATP generation processes [31]. This cascade is activated by stresses such as prolonged exercise, electrical stimulation of skeletal muscle, heart muscle ischemia, and through inhibition of the tricarboxylic acid cycle or oxidative phosphorylation [32,33]. As shown in Fig. 4A, PCE significantly phosphorylated AMPK and ACC compared to DC group. The phosphorylation of ACC decreases its activity and the concentration of malonyl CoA, the resulting product from the reaction, was decreased so that the activity of carnitine palmitoyltransferase (CPT1), which delivers fatty acid by using mitochondrial for acid oxidation was promoted [34]. In general, activation of AMPK down-regulates biosynthetic pathways such as fatty acid and cholesterol biosynthesis, yet switches on catabolic pathways that generate ATP, such as fatty acid oxidation, glucose uptake and glycolysis. In this study, we founded that PCE reduced hepatic glucose production through AMPK activation and ACC inactivation and decreased PEPCK or G6Pase gene expression (Fig. 4B). The AMPK pathway is a major mechanism enhancing glucose transport into skeletal muscle [35]. Skeletal muscle is the main site for glucose disposal in the body and there are two ways to stimulate glucose uptake into skeletal muscle: insulin dependent and insulin independent. Insulin resistance is one of the early defects detected in the muscle of diabetes patients and insulin resistance is mainly caused by insulin signaling pathway defects. Activation of AMPK by AICAR in rat or muscle cells overexpressing constitutively active AMPK increases glucose uptake and causes translocation of the glucose transporters GLUT1 and GLUT4 from microvesicles to the plasma membrane, establishing the link between AMPK activation, glucose transport and the translocation of glucose transporters [35]. As shown in Fig. 4B, PCE markedly stimulated GLUT4 gene expression.
Our results suggest that PCE significantly decreased blood glucose levels by increasing the levels of insulin, C-peptide, adiponectin and also activating AMPK, decreased PEPCK, G6pase genes in liver, and GLUT4 expressions in skeletal muscle. Since PCE, controlled hyperglycemia and hyperlipidemia in db/db mice, it may be a successive candidate for treatment of type 2 diabetes. The extensive in vivo studies and clinical evaluation of PCE have to carry out to validate the previous observations.

 XML Download