

 PDF
PDF ePub
ePub Citation
 Print
Print


INTRODUCTION
Eating-out among Korean people has become an important part of modern lifestyle due to tremendous growth of the food service industry and various social and economic changes such as more working women, higher incomes, and greater accessibility to fast food outlets and restaurants [1,2,3]. The percentage of food consumption due to eating-out increased more than 2-fold from 21.4% in 1990 to 46.6% in 2011, and more than a quarter (25.2%) of total population of Korea admits to eating-out more than once per day according to data of the 2012 Korea National Health and Nutrition Examination Survey (KNHANES) [2,4]. Koo and Park [5] studied the associations between nutrient intakes, practice of dietary guidelines, and frequencies of eating-out among Korean adults aged 30 to 64 years. Data were analyzed from the 2007-2009 Korean National Health and Nutrition Examination Survey (n = 10,223). Dietary score was calculated based on practice of dietary guidelines for Koreans. Subjects who frequently ate out tended to be younger, male, urban residents, higher educated and high income earners. Frequency of eating-out was positively associated with higher intakes of most nutrients, except carbohydrates and crude fiber. In America, the share of food spending on eating-out steadily increased from 25.9% in 1970 to 41.9% in 2006-2007 and then slightly decreased to 41.3% in 2010 [6]. The National Restaurant Association (NRA) found that approximately 30% of American consumers view eating meals away from home at places such as fast food restaurants as an indispensable part of their lifestyle [7]. Another study reported that young adults dine at fast food outlets an average of two or three times per week [8]. The results also found that eating-out among young adults aged 20 to 29 years constitutes approximately 40% of their total daily caloric intake. This increased popularity of eating-out worldwide may negatively affect nutritional diet quality [3,9,10,11,12,13,14]. The USDA (United States Department of Agriculture) collected national food consumption survey data in 1977-1978 and 2005-2008 and analyzed nutritional quality of eating-out over the past three decades. The final report found that American people ate more calories, less fat, and more calcium from 2005-2008 compared to 1977-1978 [6]. Several researchers have suggested that the increased popularity of eating-out may be associated with poor nutritional diet quality or high body mass indices [15,16,17,18]. Kwon et al. [2] reported that eating-out was associated with significantly higher levels of sodium and total daily intakes from 2007-2009 compared to 1998 based on data from 1998-2009. Other studies reported that fat constitutes a higher percentage of total energy while eating-out compared to eating at home [4,19,20]. Chung et al. [21] also examined the nutritional quality of Korean adults who ate home-prepared, commercial, and institutional lunches and found that lunches prepared from commercial places contained more calories than those from home. Dietary behaviors and physical activity are closely associated with obesity and nutritional-related diseases [22]. Several studies suggested that dietary patterns, including frequency of eating, skipping breakfast, and eating-out frequency, are associated with obesity [23,24,25,26]. Specifically, frequency of eating was found to be inversely associated with body weight, whereas skipping breakfast showed a positive association. Frequency of eating breakfast or dinner outside the home was also found to be significantly associated with obesity [22]. McCrory et al. [10] also supported this result by reporting a positive association between frequency of eating-out at restaurants and obesity among adults.
The purpose of this study was to examine meal patterns and meal sources while eating-out among Korean adults aged 19 years and older by 24-hour dietary recall method from the 1998-2012 KNHNES. We also investigated the frequency of eating-out according to general characteristics, changes in eating-out frequency more than once per day, and energy, macronutrients, and sodium intakes from eating-out from 1998 to 2012.
SUBJECTS AND METHODS
Subjects
This study used data from the 1998-2012 KNHNES by the 24-hour dietary recall method. This study included 55,718 adults aged 19 years and older.
Categorization of meal sources and serving places
To analyze eating-out frequency, meal type (N_mtype) variable was categorized based on serving location using the 24-hour recall method. Meal serving places were recoded as home meal, commercial place meal, or institutional meal based on the studies of Chung et al. [21] and Kwon et al. [2]. Commercial place meal included Korean, Western, Japanese, Chinese, fast food, flour-based meals, snack bar, packed food, instant noodle, bread/cookie, street food, and others.
Institutional meal was classified as industry, school, senior-citizen center, free, religious community, and others. To analyze variations in eating-out frequency from 1998 to 2012, eating-out variable was reclassified by combining variables of institutional and commercial meals. To analyze meal occasion, daily meal (N_meal) variable was categorized into breakfast, lunch, and dinner using the 24-hour recall method.
General characteristics
General characteristics of this study included gender, age (19-29, 30-49, 50-64, 65-74, and 75 and older), residential area (large city, middle & small city, and rural area), job status (employed, unemployed), marital status (married, unmarried), household income (high, middle high, middle low, and low), education level (middle school or less, high school or less, and college degree or more), and weight status (underweight, normal, overweight, and obesity).
Analysis of nutrient intake
To analyze trends in nutrient intake among groups showing ≥ 1 eating-out frequency per day by 24-hour recall, five nutrient variables (energy, carbohydrate, protein, fat, and sodium from total meal occasions and eating-out) were computed, and the energy percentages of carbohydrates, protein, and fat were calculated. Individuals who consumed less than 500 kcal or more than 5,000 kcal per day were excluded to minimize any bias. For the percentage of daily nutrient intakes due to eating-out, we used the formula: Nutrient intake from eating-out / Nutrient intake from daily total meals * 100.
Statistical analysis
Analyses were performed with stratified sampling weights by using SAS software (version 9.2; SAS Institute, Cary, NC, USA), as the KNHANES consisted of a multistage stratified cluster sampling design. The data results were reported as weighted %, mean values, and standard errors. Chi-square test (χ2-test) was performed to identify significant differences among categorical variables, and significant differences among continuous variables were verified by GLM (Generalized Linear Model) through proc surveyreg procedure. To analyze nutrient intake, descriptive statistics were generated for mean values and standard errors of nutrient intake using survey year as the independent variable and nutrient intake as the dependent variable. Significance testing was conducted for crude P for trends by the proc surveyreg procedure and adjusted P for trends by revising demographic variables such as gender, age, residential area, marital status, household income, and education level. For variations in eating-out frequency more than once per day, eating-out variable was recoded as 1 for "eating-out more than once per day" and 0 for "eating-out less than once per day". Based on these data, logistic regression analysis by the surveylogistic procedure, odd ratios (ORs), and 95% confidence interval (CI) were obtained.
RESULTS
General Characteristics
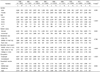
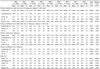
General characteristics of subjects are presented in Table 1. Among the 55,718 study samples, 49.2-49.3% were male, which means gender was approximately balanced. However, age groups showed an uneven distribution. Subjects aged 30 to 40 years constituted more than 40% of all subjects, whereas those aged 75 years and older were the fewest. The number of married individuals decreased by approximately 2% from 79.1% in 1998 to 77.1% in 2012. For residential area, more than 45% of subjects lived in a large city, 30-37% lived in middle and small cities, and 17-21% lived in rural areas. Proportion of individuals with a high school or less education decreased from 39.5% in 1998 to 31.0% in 2012, whereas proportion of those with a college degree or higher increased from 26.5% in 1998 to 43% in 2012. Proportion of employed individuals increased by around 3.8% from 1998 to 2012, whereas proportion of unemployed declined from 40.1% in 1998 to 36.7% in 2012. For household income level, the low household income group decreased by approximately 3.7%, whereas the high household income group did not show a significant difference from 1998 to 2012. Obese individuals increased in proportion from 22.6% in 1998 to 30.6% in 2012.
Eating-out tendency by meal eating patterns and occasions
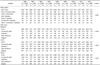
Table 2 presents the frequency of eating-out according to meal eating patterns and occasions. Frequency of eating at home declined from 45.8% in 1998 to 38.1% in 2012. Home was the most common location (more than 60%) for eating breakfast and dinner. For lunch, eating at institutional and commercial places constituted the largest proportion (more than 40%). Overall, proportions of skipping breakfast and eating breakfast away from home increased from 11.8% and 7.3% in 1998 to 22.3% and 13.7% in 2012, respectively.
Average frequencies of eating-out by meal source
The average daily frequencies of eating-out by meal source are presented in Table 3. Meal sources were grouped into three categories: home, commercial places, and institutions. Among them, the number of meals at home decreased significantly by 0.4 per day from 2.1 in 1998 to 1.7 per day in 2012 (P for trend < 0.001). The total frequency of eating-out increased significantly from 0.8 in 1998 to 0.9 per day in 2012 (P for trend < 0.001).
Average frequencies of eating-out by general characteristics
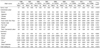
Table 4 shows the average daily frequencies of eating-out by general characteristics. Briefly, individuals who ate away from home more than once per day were male, aged 19 to 29 or 30 to 49 years, unmarried, educated for more than 12 years, employed (except 1998), and had a high income.
Changes in eating-out frequency (≥ 1/day) by 24-hour recall dietary method
Table 5 shows changes in eating-out frequency more than once per day from 1998 to 2012 by the 24-hour recall dietary method. Overall, the proportion of individuals reporting ≥ 1 eating-out per day significantly increased 1.5 times in 2012 compared to 1998. Frequency of ≥ 1 eating-out per day increased 1.4 times in 2012 compared to 1998 after adjusting variables such as gender, age, marital status, residential area, household income, and education level (P for trend < 0.001).
Comparison of daily nutrient intakes among study subjects according to eating-out frequency and survey year
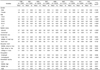
Table 6 compares daily nutrient intakes among study subjects according to ≥ 1 eating-out per day and survey year using the 24-hour recall dietary method. The daily total energy consumed by subjects who ate out more than once per day was 2,000 - 2,210 kcal in 1998 - 2012. Sodium intake increased from 5,190 mg in 1998 to 5,883 mg in 2005, after which it decreased to 5,082 mg in 2012. Regarding macronutrients, proportions of carbohydrates and protein were between 65-67% and approximately 15% from 1998 to 2012, respectively, whereas the proportion of fat significantly increased from 18.5% in 1998 to 20.3% in 2012 (Crude P trend < 0.0001, Adjusted P trend < 0.0001). Further, energy intake significantly increased from 948.3 kcal in 1998 to 1,063.2 kcal in 2012 (Crude P trend < 0.0001, Adjusted P trend < 0.0001). Intakes of protein, fat, and sodium as well as the proportion of fat in daily energy significantly increased in 2012 compared to 1998 (Crude P for trend < 0.05, Adjusted P for trend < 0.0001). Sodium intake also increased significantly from 2,370.9 mg in 1998 to 2,934.5 mg in 2012 (Crude P trend < 0.0001, Adjusted P trend < 0.0001). Percentage contributions of daily total protein, fat, and sodium intakes from eating-out increased to more than half (53-55%) in 2012 compared to 47-48% in 1998.
DISCUSSION
This study described trends in eating-out frequency and nutrient intakes among Korean adults by the 24-hour dietary recall method using data from the 1998-2012 KNHANES. Over the past decade, eating-out frequency among Korean adults has significantly risen, whereas the percentage of eating at home has decreased from 45.8% in 1998 to 38.1% in 2012. For meal sources, the proportion of meals at home has decreased from 2.1 times/day in 1998 to 1.7 times/day in 2012, whereas that of eating-out increased significantly from 0.8 times/day in 1998 to 0.9 times/day in 2012 (P for trend < 0.001). Kant and Graubard [9] also examined trends in eating-out frequency by American adults. They found that the average frequency of eating-out per week rose from 2.5 in 1987 to 1992 to 2.8 in 1999 to 2000. The percentage of individuals reporting an eating-out frequency of three or more per week increased from 36% in 1998 to 41% in 1999-2000.
In our results, popularity of eating-out for lunch was fairly higher (≥ 40%) than that for breakfast or dinner between 1998 to 2012. Mancino et al. [27] established a causal relationship between eating-out and dietary intakes using dietary recall data from the 2003-2004 NHANES and the 1994-1996 CCSFII (Continuing Survey of Food Intakes by Individuals). In their study, eating-out for lunch and dinner significantly affected total daily calorie intake, and eating-out for breakfast had a negative effect on total Health Eating Index (HEI-2005), which measures scores by adjusting diet to the 2005 Dietary Guidelines for Americans. Likewise, our results show that proportions of skipping breakfast and eating breakfast away from home increased from 11.8% and 7.3% in 1998 to 22.3% and 13.7% in 2012, respectively. Another study showed that the frequency of eating breakfast away from home gradually increased, as more than 50% of individuals aged less than 30 years showed a tendency to consume breakfast away from home more than once per week [28]. This finding suggests that the popularity of breakfast eating-out has gradually risen, as the proportion of those who eat breakfast at home was 90.5% in 1992 [29] and 75.7% in 2001 [30]. Ma et al. [22] also reported that skipping breakfast and eating breakfast away from home are closely associated with risk of obesity. They found that individuals who skipped breakfast regularly had a 4.5-fold higher risk of obesity than those who ate breakfast regularly. They also found that subjects who frequently ate breakfast away from home had a 2-fold greater risk of obesity compared to those who ate at home. A number of similar studies have suggested that skipping breakfast is related to higher overall daily energy intake [26,31,32].
Ma et al. [33] previously examined eating patterns (breakfast, lunch, dinner, snacking, number of eating episodes, temporal patterns of eating across a 24-hour day, and frequency of eating out) in a healthy U.S population. According to their results, 19% of subjects ate outside the home for breakfast, 54% for lunch, and 20% for dinner, and those who were younger, male, non-white, employed in white-collar occupations, and with higher than a university degree tended to eat out more. In our results, individuals who ate out more than once per day were male, aged 19-29 and 30-49 years, unmarried, employed (except 1998), college-educated, and had a high income. This result is supported by a previous study that examined dining-out behaviors among residents in the Chuncheon area [34]. In that study, younger subjects ate out frequently than older ones, and eating-out frequency was significantly affected by household income level, residential area, and education level. Dave et al. [7] investigated the association between attitudes toward fast food and frequency of fast food intake among American adults. They found that participants who were male, younger, and unmarried were more likely to eat fast food. In addition, individuals who were older and higher educated were adversely associated with higher perception of viewing fast food as being unhealthful. Another study on eating-out patterns among 10 European countries reported that young age, sedentary life style, and higher energy intake are positive indicators of eating-out. Moreover, participants with a higher education level more frequently ate out compared to those with a lower education level [35]. Similarly, our findings show that male, unmarried, employed, higher educated, and high income individuals were more frequently consumed meals outside the home.
Regarding meal sources while eating-out, Korean food was the most popular choice from 1998 to 2012. Kang et al. [34] studied eating-out behaviors among 739 residents in Chuncheon city, Korea and found that Korean food was most frequently selected for eating-out (55.3%), followed by noodles and snacks (14.7%), and Chinese food (12.9%).
This study also observed that food from eating-out contained higher energy, fat, and sodium levels in 2012 compared with those in 1998. Comparison of nutritional profiles of eating-out foods using national food consumption survey data in 1977-1978 and 2005-2008 showed that eating-out in America is associated with more calories and poorer nutritional quality [6]. Proportion of fat also increased from 19.2% in 1998 to 21.7% in 2012 while eating-out. A similar result was reported by Lin and Frazao [36], who found that eating-out is associated with higher fat, saturated fat, and sodium levels compared to eating at home.
Recommended sodium intake should not exceed 2,000 mg per day based on World Health Organization (WHO) guidelines [37]. However, total sodium intake while eating-out among Korean adults was over 5,000 mg per day from 1998 to 2012. Our results also show that sodium intake from eating-out increased from 2,370.9 mg in 1998 to 2,934.5 mg in 2012, and its contribution to total daily sodium intake also increased from 47.4% in 1998 to 55.9% in 2012. Food from eating-out is an important contributor to overconsumption of sodium. Lin et al. [6] found that Americans aged 2 years and older consumed an average of 3,085 mg of sodium per day in 2005 to 2008 compared to the recommended limit of 2,300 mg/day. Chung et al. [21] also found that adults aged 19 to 64 years consumed an average of 2,874 to 3,844 mg of sodium/1,000 kcal, which is 3 to 4 times higher than the recommended limit. While total sodium intake in 2012 was lower than that in 1998, it is still more than two times higher than the recommended sodium intake limit (2,000 mg).
The contribution of fat to total energy intake increased from 18.5% in 1998 to 20.3% in 2012, and the proportion of fat from eating-out also increased from 19.2% in 1998 to 21.7% in 2012. Although this result falls below the dietary reference intake level for Koreans [38], the important point is that fat consumption is increasing. Especially, contribution of fat and sodium from eating-out now constitutes more than 50% of total intake.
As eating-out increases in frequency, awareness of how eating-out affects our dietary patterns and nutrient intake should likewise increase in order to choose more healthy and nutritious foods and establish good dietary habits.
Despite many studies using data from KNHANES, our study is the first to examine trends in eating-out frequency among Korean adults from 1998 to 2012. However, the data from KNHANES only surveyed limited sociodemographic variables, which means comparative analysis with various demographic, lifestyle, and behavioral variables was not conducted. Second, as the 24-hour recall result from KNHANES was based on 1-day recall data, it is hard to extrapolate our results to all Korean adults.

 XML Download