

 PDF
PDF ePub
ePub Citation
 Print
Print


INTRODUCTION
Obesity is an established risk factor for both diabetes and cardiovascular disease (CVD) [1]. Many studies have shown that obesity-associated insulin resistance (IR) is a major contributor to CVD [2,3]. Therefore, reducing accumulation of body fat is an effective means of preventing CVD and diabetes [4,5].
In obese individuals, adipocyte tissue releases free fatty acids, hormones, adipokines, and other content convolved in IR [6]. IR is characterized by the decreasing sensitivity of target tissues to the action of insulin (hyperinsulinemia), glucose intolerance (pre-diabetes), and increased hepatic production of atherogenic lipids (dyslipidemia). Pre-diabetes is defined as impaired fasting glucose (IFG) and/or impaired glucose tolerance (IGT), which can be diagnosed with an oral glucose tolerance test [7]. Hepatic IR in IFG subjects is significantly higher than in normal glucose tolerance subjects. In addition, peripheral IR is known to be significantly higher in IGT subjects [8,9]. Therefore, pre-diabetes is characterized by higher IR and insulin secretion, normoglycemia, and impaired beta-cell function [10,11]. Prediabetics are at high risk for type 2 diabetes and increased risk of CVD [12]. Clinical trials have shown that behavior modification can lead to weight loss and drugs can reduce progression from the early stages of IR to pre-diabetes [13].
Dietary restriction and lifestyle intervention are the most effective methods for decreasing body weight [14,15]. Lifestyle intervention reduces the incidence of diabetes, and is more effective in individuals with low IR [16,18]. Several studies have examined the relationship between obesity and IR or insulin sensitivity before and after weight loss [18,19,20]. Weiss et al. [21] found that the negative energy balance induced by calorie reduction is effective in inducing fat loss and improved glucose tolerance and insulin action. Weight loss programs without exercise that reduce body weight < 6% did not change insulin sensitivity [22], but larger losses of body weight by low calorie diet increased insulin sensitivity in obese men and premenopausal women [23,24]. In another example, insulin sensitivity as measured with the minimal model technique increased similarly after 12% weight loss from caloric reduction alone or combined with aerobic exercise in obese premenopausal women [25]. Important factors predictive of the development of diabetes are obesity, dietary habits, and lack of physical activity [1,2,3]. Therefore, changes in lifestyle could have the potential to postpone or prevent the development of type 2 diabetes in high-risk subjects, such as those who are obese. Recent clinical studies have demonstrated that weight loss can improve postprandial hyperglycemia and prevent the development of diabetes from pre-diabetes. These studies reported the clinical significance of early intervention for pre-diabetes with an emphasis on the prevention of CVD [17,26]. Intervention weight loss as obesity develops may offer the best opportunity to reduce progression to pre-diabetes and type 2 diabetes.
The aim of the present study was to investigate whether weight loss through calorie restriction improved insulin sensitivity and β-cell function in middle-aged obese women.
SUBJECTS AND METHODS
Subjects
Eighty non-diabetic obese women initially participated in the study and 23 women dropped out of the program due to personal reasons, relocation, illness, and/or time constraints. Subjects were recruited via postings on a bulletin board at Kyung Hee Medical Center. A total of 57 women finished the 12-week calorie restriction program. Oral glucose tolerance tests (OGTT) were performed at the beginning and end of the program. Participants were included if they were premenopausal, had a BMI > 25 kg/m2, had a stable weight for at least six months prior to the study (< 2 kg), did not smoke, and had not participated in structured physical activities during the previous year. Participants were excluded if they had an endocrine disease or other secondary causes of obesity, were pregnant, lactating, or postmenopausal, had evidence of severe hepatic or renal diseases, or used medication that affects body weight, such as estrogen, oral hypoglycemic agents, or beta-blockers. The protocol and consent forms for the study were approved by the Ethics Review Board of the Kyung Hee Medical Center (IRB #2003-116) and each participant provided written informed consent before participation.
Anthropometric parameters
Anthropometric measurements were taken at baseline and after the 12-week study, in light clothing and without shoes. Height and weight were recorded to the nearest 0.1 cm and 0.1 kg using an automatic height-weight scale. Body mass index (BMI) was calculated by dividing weight (kg) by height squared (m2). Percent body fat and lean body mass were measured by bioimpedance analysis (Inbody 3.0; Biospace; Seoul, Korea). Waist and hip circumference were measured with a flexible measuring tape. Waist circumference was measured between the costal inferior border and the iliac crest. Hip circumference was measured at the widest point of the hip.
Blood sampling and biochemical assessment
At baseline and after the program, patients were asked to rest for 10-15 minutes and then systolic blood pressure (SBP) and diastolic blood pressure (DBP) was measured on the left arm with an automated blood pressure monitor. Blood samples were taken after a 10-h overnight fast and were centrifuged to obtain plasma, which was stored at -70℃ until analyzed. Plasma glucose was measured by a glucose oxidase method and total cholesterol (TC), high density lipoprotein cholesterol (HDL-C), and triglyceride (TG) levels were measured via enzymatic procedures using an autoanalyzer (Bayer, USA). Low density lipoprotein cholesterol (LDL-C) was calculated using the Friedewald equation [27]. Insulin levels were analyzed with a Coat-A-Count Insulin kit (DPC, Diagnostic Products Corp.), and C-peptides were measured with an LPIA-tPAI assay (Diatron, Tokyo, Japan) and a C-peptide enzyme immunoassay (EIA) kit (Eiken, Tokyo, Japan).
Caloric restriction (CR)
Participants were placed on a low calorie diet of 1,200 kcal/day. A trained registered dietician (RD) met with the subjects 6 times during the study period, including a baseline visit as well as visits during the 1st week, 2nd week, 4th week, 8th week and 12th week. The RD provided 30-45 min of dietary counseling including the components of a balanced diet, the importance of food choice, and instructions on low-fat cooking methods. All subjects were instructed to complete a three-day food record (two weekdays and one weekend day) before the program and at the end of the program. Dietary records kept during the study period were used to reinforce dietary advice and to strengthen compliance. Restriction of alcohol consumption either by reducing the frequency or amount of alcohol intake was strongly recommended to all subjects. A nutrient analysis was performed using a computer-aided nutritional analysis program (CAN pro version 4.0; Korean Nutrition Society; Seoul, Korea).
Oral glucose tolerance test (OGTT)
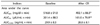
Oral glucose tolerance tests were performed at baseline and after the program. The subjects ingested a solution containing 75 g of dextrose, and venous blood samples were obtained 0, 30, 60, 90, and 120 min after ingestion for determination of plasma glucose, insulin and C-peptide levels. Blood samples were also taken after a 10-h overnight fast. An estimate of indices of β-cell function (homeostasis model assessment of β-cell (HOMA-β) [28], insulinogenic index (ISI) [29], C-peptide: glucose ratio [30] and area under the curve insulin/glucose (AUCins/glu) [31]) and insulin sensitivity (homeostasis model assessment for insulin resistance (HOMA-IR) [28], Quantitative insulin-sensitivity check index (QUICKI) [32] and Matsuda index (MI) [33]) were calculated from the OGTT according to indices (Table 1). Glucose and insulin areas under the curve were calculated using the trapezoidal rule [31].
Statistical analysis
The results are presented as mean ± SD. Anthropometric measurements, blood pressure, serum lipid levels, and nutrient and energy intake at baseline and after the caloric restriction program were compared by paired t-test. Statistical analysis were performed with SAS 9.0 for Windows (SAS institute Inc. Cary, NC). P-values < 0.05 were considered statistically significant.
RESULTS
Daily intake
Daily intake of nutrients and energy are presented in Table 2. Mean daily calorie intake at baseline and after caloric restriction was 1,869.2 ± 380.8 and 1,463.3 ± 189.1 kcal, respectively. Intake of calories, carbohydrates, protein, fat and cholesterol decreased significantly after caloric restriction (P < 0.001, P < 0.001, P < 0.05, P < 0.001 and P < 0.05, respectively). Average daily caloric intake decreased by 422.2 ± 351.7 kcal (-20.2%) while the caloric ratio of CHO:Pro:Fat did not change significantly.
Anthropometric measures, BP and lipid profiles
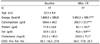
Anthropometrics, blood pressure and serum lipid parameters are presented in Table 3. Mean age of the subjects was 32.3 ± 8.8 yrs and mean BMI at baseline was 27.2 ± 2.2 kg/m2. After calorie restriction, weight (-2.7%), BMI (-2.7%), body fat % (-7.9%), body fat mass (-10.2%), waist circumference (-5.0%) and hip circumference (-1.9%) decreased significantly (all P < 0.001). Both SBP (-5.1%) and DBP (-5.3%) decreased significantly, as did blood levels of TC (-7.7%), HDL-C (-5.9%), and LDL-C (-6.4%) (all P < 0.05).
Plasma glucose, insulin, C-peptides and AUC
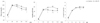
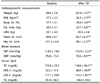
Plasma glucose, insulin, C-peptides and AUC at baseline and after caloric restriction are presented in Table 4. Changes in plasma glucose, insulin, C-peptide levels 120 minutes after OGTT are presented in Fig. 1. After calorie restriction, levels of plasma glucose, insulin, C-peptide, and glucose area under the curve (AUCglu) and insulin area under the curve (AUCins) decreased significantly (P < 0.5). Plasma glucose levels after calorie restriction were significantly lower at fasting, 60, 90 min and 120 min compared with baseline values (all P < 0.05). Plasma insulin levels after calorie restriction were significantly lower at fasting, 60, 90 min and 120 min when compared to baseline values (P < 0.05, P < 0.05, P < 0.01 and P < 0.05, respectively). Plasma C-peptide levels after calorie restriction were significantly decreased at fasting and 90 min compared to baseline values (all P < 0.05).
Indices of β-cell function and insulin sensitivity
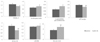
Indices of β-cell function (HOMA-β, ISI, C-peptide:glucose ratio and AUCins/glu) and insulin sensitivity (HOMA-IR, QUICKI and Matsuda index) were measured by OGTT (Fig. 2). After caloric restriction, indices of beta-cell function (HOMA-β, ISI, and C-peptide:glucose ratio) did not change, while insulin sensitivity (HOMA-IR, QUICKI and Matsuda index) changed significantly (P < 0.05).
DISCUSSION
The present study investigated whether moderate weight loss after 12 weeks of caloric restriction affects insulin sensitivity and β-cell function in middle-aged healthy obese women. Anthropometric measurements (weight, body fat percentage, waist circumference, and hip circumference), BP, and serum lipids (TC and LDL-C) decreased significantly as a result of moderate weight loss. Insulin sensitivity (HOMA-IR, QUICKI, Matsuda index) and overall-phase β-cell function (AUCins/glu) improved with moderate weight loss although early-phase β-cell function (HOMA-β, ISI, C-peptide:glucose ratio) did not change.
The American Diabetes Association [34] currently recommends that people with pre-diabetes enter a program promoting 5-10% body weight loss and at least 150 minutes/week of moderate physical activity. This study showed that using caloric restriction to achieve approximately 3% body weight loss was related to improved insulin sensitivity.
Epidemiological studies suggest that there are no threshold values for increased mortality with higher levels of fasting glucose or 2-hour postprandial glucose (2hPG) [35,36]. However, a meta-analysis concluded that non-diabetic degrees of fasting and 2-hour postprandial hyperglycemia were associated with CVD-related mortality [35]. Recently, results of the Diabetes Epidemiology: Collaborative analysis of Diagnostic criteria in Europe (DECODE) study demonstrated that abnormalities in 2hPG (impaired glucose tolerance; IGT) were better predictors of all-cause mortality and mortality due to CVD than fasting plasma glucose alone [12]. In this study, mean levels of fasting glucose were within normal range while mean levels of 2hPG were high. These results suggest that decreased 2hPG may reduce the risk of CVD as well as diabetes mellitus (DM).
Individuals with IGT exhibit greater IR than individuals with normal glucose tolerance (NGT) [37]. The index of insulin secretion (HOMA-β) can be evaluated from a fasting sample by HOMA [28,38]. Previous studies have shown improvement in HOMA-β with weight loss in obese subjects with IGT and Type 2 diabetes [8,39]. On the other hand, the present study shows that HOMA-β did not improve in subjects with moderate weight loss.
The ISI (30 minutes) and the C-peptide:glucose ratio are well-known measures of early-phase insulin secretion during OGTT [29,30,40]. According to studies based on OGTT, early-phase insulin secretion did not change in subjects with IGT compared to subjects with NGT, while late-phase insulin secretion decreased dramatically [8,41]. In this study, ISI and C-peptide:glucose ratio did not improve after weight loss, because insulin levels at 30 min were not reduced and fasting glucose levels were within normal range.
The AUCins/glu has been widely used as an index of insulin secretion [10,42]. One study reported that AUCins/glu was reduced by approximately 45% in glucose intolerant groups (IFG and IGT) after weight loss [7]. Similarly, in this study AUCins/glu was reduced by 12% after weight loss, because glucose and insulin levels decreased during OGTT.
HOMA-IR was evaluated from a fasting sample by HOMA [28,38] and is derived from the product of the fasting plasma glucose and insulin concentration. The Verona Diabetes Complication study showed that HOMA-IR was correlated with CVD prevalence [43]. Some studies have shown that IGT individuals exhibit greater IR than NGT individuals [37,44]. However, other studies have reported that there is no difference in IR between NGT and IGT individuals [45]. In this study, HOMA-IR was reduced in obese subjects after weight loss, which may explain their decreased risk of diabetes.
Insulin sensitivity can be measured with the QUICKI. N'ovoa et al. [37] reported that the QUICKI decreased significantly in subjects with IGT versus subjects with NGT. The QUICKI was also reduced after weight loss in this study.
Matsuda and DeFronzo [33] established a new index (the Matsuda index) to estimate insulin sensitivity, which has been validated by OGTT. Schäfer et al. [46] reported that a moderate amount of body weight loss (-3%) due to lifestyle intervention (restricted calories and increased physical activity) improved insulin sensitivity (Matsuda and DeFronzo) and glucose tolerance in individuals with IGT and NGT (+9%, P = 0.04 vs. +17%, P < 0.0001). This study reported found similar results. Weight loss is typically associated with improved glucose homeostasis in obese subjects [46]. After weight reduction, improved insulin sensitivity is typically followed by reduced insulin secretion, as insulin secretion is conversely related to insulin sensitivity [47,48]. However, some studies found that insulin secretion did not decrease as much as anticipated considering increased insulin sensitivity [47,48]. Similarly, in this study, insulin secretion was not reduced by as large of a degree as would be expected based on the improved insulin sensitivity. Although early-phase insulin secretion (HOMA-β, ISI and C-peptide:glucose ratio) did not improve, overall-phase insulin secretion (AUCins/glu) improved after moderate weight loss due to caloric restriction. This study provides evidence for the effectiveness of lifestyle interventions as a means of preventing diabetes in people with NGT or IGT. Moderate weight loss after caloric restriction did not improve early-phase β-cell response, but insulin sensitivity did improve.
This study has several limitations. Insulin secretion was estimated using calculations based on OGTT results, yet the glucose clamp is considered the best available method for measuring insulin sensitivity [49]. That said, insulin sensitivity calculated from OGTT results is strongly correlated with insulin sensitivity determined by the glucose clamp [10]. In addition, the subjects were all premenopausal obese women, and therefore the study results may not be applicable to the general population.
In conclusion, moderate diet-induced weight loss was associated with improved insulin sensitivity in middle-aged healthy obese Korean women. This suggests that weight loss may be the first step in preventing the development of hyperglycemia in obese women.

 XML Download