

 PDF
PDF ePub
ePub Citation
 Print
Print


INTRODUCTION
Children continue to grow and develop physically, cognitively, emotionally, and socially as they transit into adulthood [1]. Adequate nutrition status and healthy eating habit during this period are fundamental to children's growth and development, and ultimately protect them from chronic diseases (e.g. heart disease, cancer, and diabetes etc.) later in their life [2]. Furthermore, obese child had 2-6.5 folds higher risk for becoming an obese adult compared to non-obese child [3]. Therefore healthful dietary intake during this period carries an important meaning not just in childhood but also for a healthy later life.
Family is a basic unit of society that children encounter in their life, which encourages interaction between family members and inevitably gives an impact on one another [4]. Especially family is a proximal food environment and has an impact on food choices, dietary behaviors, and food intake of children through the mechanisms such as parent role modeling, social support, and social norms [5]. Thus, family is considered to be an important factor associated with dietary intake in children.
In recent decades, family structure has changed with an increase in divorce, remarriage, non-marital childbearing, and dual earner families in Korean society: there is an increase in custodial grandparent or single parent families while decrease in traditional nuclear family consisting of parents and unmarried sons and daughters [6]. A large volume of studies supported that there were association between the family structure or household type and children's eating habits and health status. Some studies indicated that children in single parent family, reconstituted families, or family without patents were more likely to have unhealthy eating habits such as irregular breakfast consumption, eating less vegetable, and drinking alcohol compared to children living with both parents [7,8,9,10]. Also, there are several studies which suggest a positive association between child health including obesity, asthma and family structure in single-mother families and custodial grandparent families [11,12,13,14,15,16,17].
While several studies have investigated an association of family structure with children's eating habit, health and well-being [7,8,9,10,11,12,13,14,15,16,17], studies that have examined the association with children's food intake are scarce. Diversity and adequacy of foods which compose meals should also be taken into account in assessment of nutritional status [18]. Therefore, this study aims to examine the association between family structure and food group intake of children aged 3-18 years in Korea.
SUBJECTS AND METHODS
Study subject
The analyses were performed using data from the Fifth Korea National Health and Nutrition Examination Survey (KNHANES V) 2010-2011, which was conducted by Korea Centers for Disease Control and Prevention (KCDC) [19]. The survey participants were recruited from a nationally representative sample of non-institutionalized Korean population aged 1 year or more. The survey consisted of Health Interview Survey, Health Examination Survey, and Nutrition Survey and a rolling survey sampling design and a complex, stratified multistage, probability-cluster sampling design were applied.
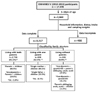
This study focused on 3,663 children aged 3-18 years (21% of a total of 17,476 KNHANES V (2010-2011) participants). The analytic data set included data from a total of 3,217(1,678 boys and 1,539 girls) children with complete data on variables for household information, dietary intake by using single 24-hour recall method and sampling weights (Fig. 1). Children's family structure was classified into three groups: 'Living with both parents', 'Living with one parent', and 'Living without parents'. The distribution of children by family structure showed that 6.6% lived without parents, 12.3% lived with one parent, and 81.1% lived with both parents.
Definition of variables
Living area was classified into three groups: 'Metropolises', 'Small and medium-sized cities', and 'Rural' areas. Because of small proportion of some household income quartile (living with both parents: Q1 7.4%, living without parents: Q3 7.5%, Q4 7.6%), quartile classification of household income in KNHANES data had coalesced into two groups: 'Below 50th percentile' and 'Over 50th percentile'.
Dietary intakes of subjects were obtained using 24-hour recall data. Consumed foods were categorized into five major food groups ('Grains', 'Meat, Fish, Eggs, and Beans', 'Vegetables', 'Fruits', and 'Milk and Dairy products') and the amount was converted into number of servings based on the Korean Food Guidance System (KFGS) [20]. Food items unrepresented in KFGS and mixed food items (e.g. hamburger, dumpling) were classified into five food groups and the amount was converted into servings based on newly-developed food group database established by Song et al. [21] In the food group database, the other foods except representatives in KFGS and mixed dishes were classified on the basis of energy, nutrient contents, and recipe. Juice and ice cream were excluded from 'Fruits' and 'Milk and Dairy products' groups respectively in this study.
To evaluate children's food group intake, individual food group score was calculated by using percent adherence to the recommended servings in the KFGS [20]. The KFGS, which is applicable to individuals aged 3 and more years, provides recommended number of servings for each food group according to age and sex. In this study, children's intake of 'Grains', 'Meat, Fish, Eggs, and Beans', 'Vegetables', 'Fruits', and 'Milk and Dairy products' was evaluated.
Individual food group score was calculated as follows:
Food group score = (number of servings consumed ÷ number of servings recommended in KFGS) × 100.
Maximum score was 100 for any food group and if intake was higher than 100% of recommended servings, a score of 100 was assigned. Scores below 100 indicates that the food group was consumed less than the KFGS recommendation, and score equal to 100 implies that the food group intake is equivalent to or more than the KFGS recommendation. 'Food group mean score' was obtained from the average of five individual scores.
Statistical analyses
Analyses were performed using SAS 9.3 software (Statistic Analysis System; version 9.3, SAS Institute, Cary, NC, USA.). Taylor series method was applied to account for multiple stage sampling. All estimates were produced to represent Korean population using the sample weight for joint analysis of nutrition survey and health interview survey. Descriptive statistics were presented as percentage frequency or mean and standard error. Children's characteristics by family structure were analyzed with Rao-Scott Chi-Square test and Analysis of Variance test (ANOVA). Multivariate analysis using Analysis of Covariance test (ANCOVA) was applied to control for age, sex, number of family members, and household income. The differences in mean values of food group scores of participants with different family structure were analyzed. To examine the association between family structure and food group scores of children, multivariate regression model was tested. In the test, five independent variables were included: family structure, age, sex, number of family members and household income. Categorical variables such as family structure, sex, and household income were included in the model as dummy variables. Statistical significance was set at α = 0.05.
RESULT
Subject characteristics
Characteristics of the children by family structure are presented in Table 1. Lower percentage of young children (3-5 yrs of age) and higher percentage of older children (12-18 yrs of age) lived with one parent (P < 0.001). Majority of children living without parents (84.9%) or living with one parent (71.0%) were distributed below the 50th percentile of household income. Number of family members was significantly different among children with different family structure.
Food group scores
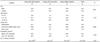
Children's food group scores and mean scores of individual food group scores were presented in Table 2. Results showed that mean scores of total subjects were less than 50 for both 'Fruits' and 'Milk and Dairy products', whereas the mean was approximately 90 for 'Grains'. After adjusting for age, sex, number of family members, and household income, children living with both parents had higher scores in 'Fruits' (P < 0.01) and 'Milk and Dairy products' (P < 0.05) compared to children living with one parent. The mean scores of individual food group scores also appeared to be higher in children living with both parents than those with one parent (P < 0.001), while 'Grains', 'Meat, Fish, Eggs, and Beans', and 'Vegetables' scores of children with different family structure were similar to each other.
Association between family structure and children's food group scores
Regression models for food group scores and mean score of individual food group scores with five independent variables that consists of children's family structure and socio-demographic factors were applied (Table 3). The selected models were statistically significant except those for 'Meat, Fish Eggs, and Beans' group score. Socio-demographic factors associated with the food intake of children were different in each food group. Family structure was associated with 'Fruits', 'Milk and Dairy products' scores and 'Food group mean score,' after adjusting for age, sex, number of family members, and household income. Household income was also strongly associated with food group scores such as 'Grains', 'Milk and Dairy' groups and 'Food group mean score'.
DISCUSSION
This study was to examine the association between family structure and food group intake of children in Korea. The study results represented that children living with both parents had higher food group scores for 'Fruits', 'Milk and Dairy products', and the mean score of individual food group scores compared to children living with one parent. Individual food group scores were associated with different socio-demographic factors of children. Food groups of which consumption was associated with family structure of children were 'Fruits', 'Milk and Dairy products' and overall intake of the five food groups.
In this study, about 12.3% of children were lived with one parent. It was similar to the results of the 2010 Population and Housing Census [6], while the proportion was lower than those of foreign countries [7,8,10,14]. Other domestic studies on elementary school children from low-income households [22,23] showed that higher proportion of children lived with one parent than current study but the results were not produced from representative samples.
In this study, children had insufficient intakes of both 'Fruits' and 'Milk and Dairy products' whatever the family structure is. This result was consistent with a report of Shim et al. [24] that had used the 2001 KNHANES data to examine the dietary intake of children aged 6-18 years by household income level. Low intake of 'Fruits' and 'Milk and Dairy products' groups is common dietary intake problem in children, which can ultimately lead to health problems related to vitamin C, calcium, and riboflavin deficiency. Sufficient intake of milk and dairy products as important souses of calcium is necessary to support growth during childhood. Furthermore, adequate calcium supply to achieve higher peak bone mass is crucial during this growth period in order to maintain high bone density in later life [25]. Therefore, more rigorous approaches are needed for nutrition education and policy that aim to promote the intake of 'Fruits' and 'Milk and Dairy products' for children.
Children living with both parents had higher scores for 'Fruits' and 'Milk and Dairy products' groups and overall food groups compared to children living with one parent. A study [26] on childcare expenses per children indicated that grocery expenses in single-headed households was 89.2% of the expenses in total household and the expenses in beneficiaries of basic livelihood assistance program was 72.1%. Healthy foods such as fresh vegetables, fruits, and milk and dairy products were more expensive on a per calorie basis than less healthy foods (e.g. fat, sugar, refined grains) and low income households tended to spend and consume less fruits than high income households [27,28]. Therefore, it can be assumed that single-headed households, who also happen to have low household income, have a tendency to choose foods that meet their energy needs at lower cost rather than to purchase foods of greater variety and adequacy at higher cost.
The lower food group scores in single-headed households are thought to be partially due to lack of care including preparation of meals composed of diverse and adequate amount of foods. A large volume of literature suggests that family meals are associated with higher fruit and vegetable intake [29,30,31,32]. A qualitative study of perspectives on healthy family meals from single-headed and dual-headed households identified several reasons for barriers to family meals [33]. Parents from dual-headed households reported that busy schedules were major barriers to having family meal. While parents from single-headed households identified cost was a major barrier to health family meal, they also reported that they felt burden of sole responsibility to carry out family meal.
Despite the fact that children living without parents had the lowest household income, intake of food groups and 'mean food group score' were not statistically different when compared with the children living with parents. An explanation for this observation is that even if children are not living with their parents, their dietary intake may not be compromised especially when they are under direct care from their grandparents or other household members. As shown in Fig. 1, household of 'children living without parents' consisted of couple of adults.
Furthermore, a study by Sung et al. [34] suggested that interpersonal relationship in children was similar or slightly better in children under custodial care from grand-parents than those living with their parents. Children with custodial grand-parents had much more positive aspects in quality of life, and criminal behaviors were 2-3 folds lower than children in single-parent family. As such, it can be understood that grandparents or other care-giving household members might give positive influence on children.
There are several limitations in this study. First, this study used data from KNHANES V (2010-2011) with one-day dietary intake. Second, this study mainly focused on the influence of family structure on food group intake of children. However factors such as siblings living in the household, availability and accessibility of food items within home, neighborhood food environments such as restaurants, food stores, and media could influence on food choice and intake in children but were not accounted for [5]. Current study classified children's family structure into three groups ('Living with both parents', 'Living with one parent', and 'Living without parents'). In reality, family structures are a lot more complicated. Thus, more detailed classification system could be required (e.g. reconstituted family such as mother-stepfather, father-stepmother; one parent family such as non-marital childbearing, married but divorce or bereavement; custodial grandparent family). Third, current study was based on secondary data and potential confounding variables could not be fully controlled (e.g. primary care giver's socio-demographic characteristics). Nevertheless, this is the first study which evaluate children's food group intake in reference to 2010 revised KFGS by family structure, and identify the relationship between children's family structure and their food group intake. This study documented socio-demographic characteristics related to food intake of children, which could be a basis for national policy, project, and interventions in regard to children's family structure aiming to solve the nutrition problems of children in Korea.


 XML Download