Abstract
BACKGROUND/OBJECTIVES
SUBJECTS/METHODS
RESULTS
Figures and Tables
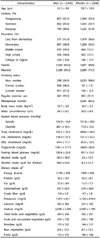
Table 1

All values were expressed as mean ± standard deviation for continuous variables or subject number and percentage in the parenthesis for categorical variables.
1)All nutrients were total energy adjusted by residual method after log transformation. LDL, low density lipoprotein; HDL, high density lipoprotein; BMI, body mass index
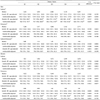
Table 2

Values are expressed as age-adjusted Mean ± SE or percentage.
Mean values within a low with different superscript letters were significantly different by Tukey's multiple comparison test (P < 0.05).
1)P-values for differences across groups and P-values for the trends were determined by GLM for continuous variables and by the Cochran-Mantel-Haenszel test for categorical variables after adjustment for age.
2)Regular exercise was defined as subjects who exercise at least 30 minutes and three or more days per week.
3)The proportion among women
4)All nutrients were total energy-adjusted values by residual method after log transformation.
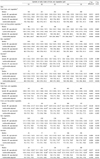
Table 3

Values are expressed as mean (95% confidence interval) and all nutrients were total energy-adjusted values by residual method after log transformation.
1)P-values for differences across groups and P-values for the trends were determined by GLM for continuous variables and by the Cochran-Mantel-Haenszel test for categorical variables after adjustment for age. Mean values with unlike superscript letters within a row were significantly different among the three groups by Tukey's multiple comparison test.
2)Multivariable model for sodium included age, farmer (yes/no), waist circumference, and dietary intake of protein and calcium among men and age, farmer (yes/no), married (yes/no), BMI, alcohol, and dietary intake of protein and calcium among women.
3)Multivariable model for potassium included age, education (≥ 9 y), farmer (yes/no), regular exercise (yes/no), and BMI among men and age, education (≥ 9 y), farmer (yes/no), married (yes/no), regular exercise (yes/no), and waist circumference among women.
4)Multivariable model for sodium/potassium included age, education (≥ 9 y), farmer (yes/no), married (yes/no), regular exercise (yes/no), alcohol, and intake of fiber and calcium among men and age, education (≥ 9 y), farmer (yes/no), married (yes/no), regular exercise (yes/no), waist circumference, and intake of fiber and calcium among women.
Table 4

Values are expressed as mean (95% confidence interval) and all nutrients were total energy-adjusted values by residual method after log transformation.
1)P-values for differences across groups and P-values for the trends were determined by GLM for continuous variables and by the Cochran-Mantel-Haenszel test for categorical variables after adjustment for age. Mean values with unlike superscript letters within a row were significantly different among the three groups by Tukey's multiple comparison test.
2)Multivariable model for total fruits and vegetables included age, education (≥ 9 y), smoking (current/former/none), regular exercise (yes/no), BMI, and intake of energy, protein, and calcium among men and age, education (≥ 9 y), married (yes/no), smoking (current/former/none), regular exercise (yes/no), BMI, alcohol, and intake of energy, protein, and calcium among women.
3)Multivariable model for total fruits and non-pickled vegetables with salt included age, education (≥ 9 y), farmer (yes/no), married (yes/no), smoking (current/former/none), regular exercise, and intake of energy, protein, fiber, and calcium among men and age, education (≥ 9 y), farmer (yes/no), married (yes/no), smoking (current/former/none), regular exercise, BMI, and intake of energy, protein, fiber, and calcium among women.
4)Multivariable model for raw vegetables included age, education (≥ 9 y), farmer (yes/no), smoking (current/former/none), regular exercise (yes/no), and intake of energy, protein, fiber, and calcium among men and age, education (≥ 9 y), farmer (yes/no), ), regular exercise (yes/no), alcohol, and intake of energy, protein, fiber and calcium among women.
5)Multivariable model for Kimchies included age, farmer (yes/no), waist circumference, and intake of energy, protein, and calcium among men and age, education (≥ 9 y), farmer (yes/no), ), married (yes/no), smoking (current/former/none), BMI, and intake of energy, protein, and calcium among women.
6)Multivariable model for fruits included age, education (≥ 9 y), smoking (current/former/none), regular exercise (yes/no), BMI, alcohol, and intake of energy, protein, fiber, and calcium among men and age, education (≥ 9 y), farmer (yes/no), smoking (current/former/none), regular exercise (yes/no), BMI, and intake of energy, protein, fiber, and calcium among women.


 PDF
PDF ePub
ePub Citation
 Print
Print


 XML Download