

 PDF
PDF ePub
ePub Citation
 Print
Print


INTRODUCTION
The prevalence of obesity and related comorbidities has shown a dramatic increase worldwide, which can mainly be attributed to changes in dietary and physical activity patterns [1]. Obesity is associated with increased risk of developing insulin resistance, type 2 diabetes mellitus (T2DM), cardiovascular disease, and premature death [2]. Treatment of obesity must involve lifestyle modification, including healthy diet and physical activity [3].
Weight management programs have traditionally focused on calorie-restricted diets, which can result in modest weight loss, but may elicit physiological adaptations that promote weight regain in the long term [4]. A calorie-restricted diet causes a reduction in body weight regardless of the portion of macronutrient content in the diet [5]. However, the metabolic benefits of weight loss vary depending on the dietary pattern.
In Brazil, an analysis of food records from 34,003 subjects aged 10 or older participating in the Brazilian National Dietary Survey (2008-2009) showed that rice and beans are the foods most consumed by the Brazilian population (84.0% and 72.8%, respectively) [6]. Therefore, the standard Brazilian food consumption pattern and the culturally accepted dishare based on the combination of rice and beans (Phaseolus vulgaris) served together at lunch and dinner. Brazilian staple foods have low energy density and contain high quality plant protein; they are a good source of fiber, iron, calcium, B-vitamins, and reduced glycemic index carbohydrate [7]. Beans are naturally low in total fat and highin fiber, vegetable protein, folate, calcium, and iron [8]. In addition, some studies have shown that consumption of beans in combination with other foods (i.e. glucose and rice) can reduce the glycemic response and provide benefits for glucose metabolism [9,10], as well as improve overall diet quality [11]. Regarding weight loss, although there are no firm conclusions regarding the beneficial effects of beans [12], inverse association of bean consumption with the risk of obesity [13] and with risk factors for metabolic syndrome [14] in the Brazilian population has been reported. Compared with milled rice (white rice), brown rice is richer in fiber, some B-vitamins, and minerals [15]. Brown rice can lower the glucose response [16], decreasing the risk of T2DM [17,18].
In this work, Brazilian-staple (BS) refers to rice and beans served together in meals. Therefore, based on the assumption that the Brazilian-staple calorie-restricted diet (BS diet) can be helpful in obesity management and metabolic control, we hypothesized that the BS diet can ameliorate metabolic markers during obesity treatment. The aim of this study was to compare the effects of the BS diet with those of a conventional-type calorie-restricted (CT) diet on glucose metabolism, lipid profile, anthropometric and body composition parameters, and food intake in overweight/obese type 1 subjects who were followed during 16 weeks of treatment.
MATERIALS AND METHODS
Subjects
The sample size was calculated following the protocol of Röhrig et al. [19] and based on the result reported by Mollard et al. [20] using glucose AUC (area under the glycemic curve) as the main variable. Assuming a statistical power (1-β) of 80% and a level of significance (α) of 5%, 13 subjects in each group were necessary for this study.
A total of 36 subjects were enrolled in this randomized clinical trial. Inclusion criteria were adults (18-50 y) of both sexes, with body mass index (BMI) between 25 and 35 kg/m2, non-smokers, not pregnant or lactating, no diagnosis of any metabolic diseases, and not under medication or therapeutic diets, except for oral contraception in women. All subjects were informed about the study and signed an informed consent form. The protocol for the study was approved by the Ethics Committee in Human Research of the Faculty of Health Sciences at the University of Brasilia, Brazil (n°035/2004).
Study design
On the screening visit, the subjects arrived at the laboratory between 0730 and 0800 hours after a 12-hour overnight fast. Height and body weight were recorded in order to verify nutritional status according to BMI classifications, and a 2-hour oral glucose tolerance test (OGTT) was administered in order to exclude the presence of type 2 diabetes mellitus (T2DM).
Subjects enrolled in the study were randomly assigned to one of the two dietary advice treatments: BS diet - Brazilian-staple calorie-restricted diet with consumption of brown rice and beans (n = 18) or CT diet - conventional-type calorie-restricted diet (n = 18). The subjects were individually instructed to follow the dietary advice for 16 consecutive weeks.
Dietary advice
The calorie-restriction of dietary treatments was set between 25 and 30% of the total energy expenditure estimated using the equations published by the Institute of Medicine [21] using the appropriate physical activity level (PAL) to set the activity factor of each subject [22]. The dietary macronutrient percentages were set according to the acceptable macronutrient distribution ranges [21]. The dietary energy was assigned to food groups according to the portions defined by the Brazilian food pyramid [23].
Food tables created in order to help the subjects adhere to the dietary treatments (BS diet or CT diet) were organized according to seven food groups: (1) Breads, cereals, roots and tubers; (2) Vegetables; (3) Fruits; (4) Meat and eggs; (5) Milk and dairy products; (6) Oils and fats; and (7) Sugar and candies. The BS diet table included a specific food group of "Legumes" (e.g. beans, peas, chickpeas, lentils, soybeans), while in the CT diet table, the legume foods were merged with the "Meat and eggs" food group. In addition, in the BS table, only natural fruit jam was allowed as sugar food (n = 5), while the CT table included sweets and candies in general (n = 15). Subjects received instructions on how to use the tables and in selection of the correct foods corresponding to the experimental group to which they were assigned. For the BS diet, consumption of brown rice and beans twice per day (lunch and dinner) was emphasized.
Subjects returned to the laboratory every four weeks for a follow-up visit in order to verify PAL, adherence to the dietary treatment and to adjust the dietary prescription. Adherence to the diet was computed for the subjects who completed 4 - 5 visits to the laboratory, did not eat more than the dietary energy advice, and consumed 4 - 6 meals per day. For subjects in the BS group, the dietary fiber intake was supposed to be 60% - 70% of the dietary reference intake established by the Dietary Reference Intakes [21].
Food intake assessment
Food intake was assessed by 24-hour recalls (R24h). Two R24h on non-consecutive days were applied at baseline and at each visit to the laboratory. A total of five R24h were obtained during the intervention period. These data provided information about baseline intake and adherence to the diets. To ensure accuracy, subjects were shown a photographed food portion guide and household items for estimation of the food portions consumed. Each dietary recall was reviewed in the presence of the subject in order to ensure its accuracy and completeness. Food portions were converted into grams, and total energy intake, and macronutrients and fiber consumption were analyzed using the Nutrition Data System for Research software (version 2011) (NDSR, University of Minnesota, Minneapolis, MN, USA), which includes typical Brazilian foods prepared using standardized recipes. The Multiple Source Method was used for estimation of the habitual or usual dietary intake adjusted by within-person variability [24]. The data provided represent the baseline and intervention habitual dietary intake.
Anthropometric variables
Height was measured using a scientific stadiometer (Altura-exata, Belo Horizonte, Brazil) with a range of 0-210 cm and precision of 0.1 cm, and body weight was assessed using an electronic platform scale (Plenna, São Paulo, Brazil) with a range of 0-150 kg and precision of 0.1 kg, and BMI was computed and classified [25]. Waist circumference was measured at a level midway between the lowest rib and the iliac crest, with precision of 0.1 cm, and was classified according to the parameters of the National Cholesterol Education Program [26]. Body composition was assessed by tetrapolar electrical bioimpedance (Quantum II - RJL Systems, Clinton Township, MI, USA) [27].
Biochemical analyses
Three milliliters of blood samples were collected after a 12-hour overnight fastat baseline and at 16 weeks. The concentrations of insulin, glucose, triacylglycerol (TAG), total cholesterol (TC), HDL-c, LDL-c, and VLDL-c were determined. The insulin and glucose concentrations were measured by electrochemiluminescence and the glucose oxidase method, respectively. The TC, HDL-c fraction, and triacylglycerol concentrations were measured using enzymatic colorimetric kits. Fractions of LDL-c and VLDL-c concentrations were calculated using the Friedewald equation. A glycated hemoglobin level was determined using a modified Trivelli formula.
After an overnight fast, a 2-hour OGTT was performed and blood samples were drawn at baseline, 30, 60, 90, and 120 minutes. The incremental area under the curve (AUC) for glucose and insulin was calculated using the trapezoidal method, excluding any value below the baseline values [28].
Parameters of glucose metabolism
For evaluation of glucose metabolism parameters, the values for the homeostasis model assessment of insulin resistance (HOMA2-IR), HOMA β-cell function (HOMA2-%β), and HOMA insulin sensitivity (HOMA2-%S) were calculated using the computer program HOMA calculator v2.2.2 (University of Oxford) [29] for determination of insulin resistance, β-cell function, and insulin sensitivity, accordingly. The Cederholm index (CI) [30] was calculated for determination of insulin sensitivity, using the follow formula:
In this expression, D is defined as the dose given (mmole), VG represents the distribution space of glucose, taken to be 0.19L/kg body weight. G(t) and I(t) are the plasma glucose (mmol/L) and insulin (pmol/L) concentrations measured between time 0 and time T. The unit of the Cederholm index is min-1 [31].
Physical activity assessment
Physical activity was assessed at the screening and at every follow-up visit for each subject using a short version of the international physical activity questionnaire [22] comprised of questions about frequency and duration of physical activities. PAL was estimated according to the values proposed by the Compendium of Physical Activities [32] and classified according to values proposed by the Institute of Medicine [21]. The subjects were asked to maintain the same physical activity habits during the intervention period.
Statistical analysis
The Kolmogorov-Smirnov test was applied in order to verify the normality of the variables, and residual data plots were examined for determination of the homogeneity of variance. At baseline, unpaired t-tests/Mann-Whitney tests were used for comparison of variables between the groups. Paired t-tests/Wilcoxon tests were applied for analysis of within-group differences (baseline vs. intervention period), and unpaired t-test/Mann-Whitney tests were used for analysis of between-group differences (delta values). Repeated ANOVA measures were used for examination of PAL values over the follow-up period. All statistical analyses were performed using the Statistical Analysis System software package, version 9.1 (SAS Institute Inc., Cary, NC, USA), with a statistical significance criterion of P ≤ 0.05, two-tailed. The results are presented as mean ± standard deviation.
RESULTS
Comparison of baseline and anthropometry
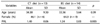
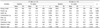
A total of 36 subjects were enrolled in this study, and 27 successfully completed the 16-week intervention: 13 in the CT group (mean age 34.38 SD 9.30 years) and 14 in the BS group (mean age 33.36 SD 5.64 years). At baseline, the CT group showed higher PAL compared with the BS group (Table 1). No significant differences were observed for glucose metabolism, lipid profile, or anthropometric and body composition parameters. PAL did not show a significant change over the follow-up period for the BS (1.34 ± 0.03 to 1.37 ± 0.05, P = 0.12) and CT groups (1.40 ± 0.06 to 1.40 ± 0.07, P = 0.32).
After the dietary intervention, both groups showed significant reductions in body weight (P ≤ 0.02), BMI (P ≤ 0.02), and waist circumference (P ≤ 0.005). In addition, the BS group achieved significant reductions in body fat (P = 0.0001) and increases in fat-free mass (P = 0.0001). However, no significant differences were observed between the CT and BS groups (P ≥ 0.14) (Table 2).
Comparison of metabolic response
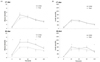
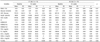
The BS group showed significant decreases in fasting plasma glucose (P = 0.008), AUC glucose (P = 0.02), AUC insulin (P = 0.01), increases in CI (P = 0.04), and HOMA2-%β index (P = 0.02). In addition, the BS group showed significant improvement in HOMA2-%β, compared to the CT group (P = 0.03). No significant differences in glucose metabolism parameters were observed within the CT group (P ≥ 0.19) (Table 3). In the 2-hour OGTT, the BS group showed a significant (P ≤ 0.05) decrease in glucose concentration at 0, 30, 60, and 90 minutes and in insulin concentration at 30 and 120 minutes (Fig. 1).
After 16 weeks, significant decreases were observed in TAG (P = 0.004), TC (P = 0.04), VLDL-c (P = 0.03), and LDL-c (P = 0.05) concentrations and in the TC/HDL-c ratio (P = 0.01) in the BS group, as compared to baseline values. Significant reductions were also observed in HDL-c concentration (P = 0.03) in the CT group, without changes in physical activity. No significant differences in lipid profilewere observed between the groups (P ≥ 0.08) (Table 3).
Habitual dietary changes
Energy intake reduction (%) based on the total energy expenditure was measured for the BS diet group (-0.29 SD 0.09) and the CT diet group (-0.36 SD 0.09), with no statistical difference between the groups (P = 0.06). In analysis of the habitual dietary intake over the study period, the BS group showed significant decreases in energy, lipids, carbohydrate, and cholesterol intake (P ≤ 0.04) and an increase in fiber intake (P ≤ 0.001), while the CT group achieved significant reductions in energy, macronutrients, PUFA, and cholesterol intake (P ≤ 0.002). In addition, the BS group showed significant decreases in glycemic index and glycemic load (GL) (P ≤ 0.001), while the CT group achieved a significant reduction in glycemic load (P ≤ 0.001). In addition, the BS group showed a significant increase infiber intake compared to fiber consumption in the CT group (P < 0.001) (Table 4).
DISCUSSION
In Brazil, in the last 30-years, consumption of traditional foods, such as rice and beans has decreased. In the same period the consumption of processed food items (cookies and soft drinks), sugar, total fat and saturated fat has increased [33]. In our study, inclusion of traditional foods (brown rice and beans) for 16 weeks was effective for improving metabolic parameters in overweight or obese type 1 subjects. In addition, this study is important in reinforcing the importance of consumption of a Brazilian staple diet and provides scientific support for development of dietary recommendations and guidelines.
In the current study, the reduction of total energy intake by 25-30% promoted a decrease in body weight, BMI, and waist circumference in both groups. However, significant improvements in body composition parameters were observed in the BS group. In addition, these results indicate that the BS group achieved improvements in most biochemical parameters related to glucose and lipid metabolism. In addition, the BS group achieved a significant decrease in carbohydrate, lipid, and cholesterol intake and in dietary GI and GL, and an increase in fiber intake. These results demonstrate the importance of dietary advice for following a BS diet, leading to improvements in several parameters linked to metabolic syndrome.
Understanding how dietary factors influence body weight regulation can be helpful in development of effective nutritional strategies for prevention and treatment of obesity [34]. During weight reduction, the negative energy balance is the greatest determinant of the amount and rate of weight loss, and the effects of diet composition are minimal [5]. However, a longterm calorie-restricted diet decreases the rate of fat oxidation and resting energy expenditure, which opposes weight loss and body weight maintenance [35]. In the search for more effective strategies, the BS diet (brown rice and beans) merits special consideration.
The BS diet group showed a significant reduction in the glycemic index during the treatment period. In this context, several studies have indicated that low-GI diets lead to an increase in fat oxidation and a reduction in body fat content. Consumption of low-GI foods results in a lower glycemic and insulinemic response, which induces an increase in fat oxidation [36]. In our study, body weight and waist circumference showed a significant decrease from baseline in both groups, but did not differ between the groups (P = 0.15 and P = 0.14, respectively). However, body composition (body fat %) was more favored during the treatment period in the BS diet group than in the CT diet group.
Low-GI diets are associated with a lower glycemic and insulinemic response, which is beneficial in glucose control [37]. In the current study, the BS group achieved a reduction of 3.9 units in GI over the 16 weeks compared to baseline habitual intake (P < 0.001) and showed significant reductions in fasting plasma glucose (P = 0.008), AUC glucose (P = 0.02), and AUC insulin (P = 0.01), and improvement in CI (P = 0.04) and HOMA2-%β (P = 0.02), representing a protective factor for impaired glucose tolerance (IGT) and T2DM. In the CT group, although no significant improvement was observed in glucose metabolism variables, the mean HOMA2-IR value was below the cutoff of 2.71 for IGT in the Brazilian population [38]. A significant decrease in intake of carbohydrates and lipids, and an increase fiber intake observed in the BS group, could have contributed to the improvement in glucose metabolism.
Studies that evaluated the effects of consuming beans with rice on glucose metabolism showed a significant reduction in postprandial glucose response and glycemic area under the curve [39] and in the GI value of the rice when consumed together [40]. It is postulated that these effects can occur due to the α-amylase inhibitory activity of beans [10,41].
The findings on lipid profile in this study were in accordance with the results of previous high legume [42] and high fiber interventions [43,44]. The BS group showed significant improvement in TAG, TC, and LDL-c concentrations and TC/HDL-c ratio, and maintenance of HDL-c concentration. It should be noted that the increased fiber consumption of the BS group (+ 8.1g, P < 0.001) may have contributed to these improvements. Increased fiber consumption and more favorable lipid profile are associated with a substantial reduction in risk of cardiovascular disease [45]. The CT diet resulted in reduction in HDL-c concentration (delta value = -10.1 mg/dL; P = 0.03). The HDL-c depends on genetic and environmental factors [46]. Body weight, smoking, consumption of alcohol, physical exercise, and eating habits are responsible for variation in HDL-c. Because the PAL of the CT diet group did not change during the treatment period, it is possible that the decrease in HDL-c is due to the composition of the diet used in the CT group. This diet provided meat, eggs, sweets, and treats. Influence of these types of foods on lipid profile and HDL-c has been demonstrated [47,48].
In conclusion, the results of this study show that dietary advice to follow a Brazilian-staple calorie-restricted diet (brown rice and beans) resulted in significant improvement in anthropometric and body composition parameters, glucose metabolism and lipid profile variables in overweight/obese type 1 subjects. However, a longer follow-up period is needed in order to determine the effectiveness of eating brown rice and beans twice per day as a nutritional strategy for treatment of obesity.

 XML Download