

 PDF
PDF ePub
ePub Citation
 Print
Print


INTRODUCTION
Increasing fruit and vegetable intake to at least five servings daily is recommended by the World Health Organization (WHO) as a part of healthy eating pattern [1]. Although there are inconsistent findings that reported fruit and vegetable intake are associated with chronic diseases, the importance of fruits and vegetables in weight maintenance and prevention of diseases, such as cardiovascular diseases and certain types of cancers should not be underestimated as fruits and vegetables are good sources of vitamins, minerals, fiber and phytochemicals. Despite the recommendations, a high proportion of the world's populations do not consume adequate amount of fruits and vegetables [2,3,4]. In Malaysia, the Non-Communicable Diseases Surveillance 1 (2005-2006) indicated that approximately 70% of Malaysian adults did not achieve the recommended intake of 5 servings of fruits and vegetables daily [5]. The recent National Health and Morbidity Survey (NHMS) 2011 reported that only 15.5% and 13.7% of Malaysian adults had met the recommended daily intake of at least three servings of vegetables and two servings of fruits, respectively [6].
It remains a great challenge to health professionals worldwide to promote healthy eating of fruits and vegetables. In the past few decades, Transtheoretical (Stages of Change) Model has been frequently used to assess individual's readiness and intention to change behavior via 5 distinct stages, namely pre-contemplation, contemplation, preparation, action and maintenance [7]. Several studies have shown that individuals in action and maintenance stages are more likely to have healthier diets than those in pre-contemplation, contemplation and preparation stages [8,9,10]. However, information on the application of Stages of Change Model in dietary behavior change in non-Western populations are very limited [10,11,12,13].
Although perceived benefits, perceived barriers and self-efficacy have been found to be important psychosocial factors that influence dietary behavior change, there is still lack of strong supporting evidence on the relationship between stages of change and these psychosocial factors in promoting healthy dietary behavior change, i.e. eating at least 5 servings of fruits and vegetables daily, reducing dietary fat intake, adequate consumption of grains and dairy products. Studies reported that individuals in pre-contemplation stage had perceived barriers that outweigh perceived benefits and low self-efficacy as compared to individuals in other stages [11,12,13,14,15,16]. Hearty et al. [17] found that individuals with high perceived benefits toward healthy eating had better dietary profile (e.g. greater consumption of whole-meal bread, breakfast cereals, vegetables, fruits, fish and yoghurts) and were more likely to comply to dietary guidelines than those with high perceived barriers. Similarly, individuals with high self-efficacy are more likely to engage in and maintain healthy eating behaviors even when they are facing difficulties [8,9,14,15,16].
In Malaysia, there is no published information on the application of Stages of Change Model for fruit and vegetable intake. The aims of this study were 1) to determine individual's intention to increase fruit and vegetable intake, 2) to determine relationship between diet-related psychosocial factors (perceived benefits, perceived barriers and self-efficacy) and intake of fruits and vegetables, 3) to determine the differences in diet-related psychosocial factors (perceived benefits, perceived barriers and self-efficacy) and intake of fruits and vegetables by stages of change. It is hypothesized that adults at different stages of change would have different levels of self-efficacy, perceived benefits and barriers which may facilitate the increase of fruit and vegetable intake.
SUBJECTS AND METHODS
Study design and subject recruitment
This cross-sectional study was carried out from April 2008 to May 2009 in Universiti Putra Malaysia (UPM), a public university located near the capital city of Kuala Lumpur, Malaysia. There are about 1,905 academic and 1,220 non-academic staff working at 16 faculties in UPM [18]. Ten out of 16 faculties were randomly selected from a list of faculty, where faculty is defined as school/division of university. Faculty members (n = 1,970) from 10 out of 16 faculties were selected randomly from the university. Subjects (n = 1,970) were screened based on selection criteria of aged 19-59 years, not physically impaired, not medically diagnosed with diet-related chronic diseases, and non-pregnant. A sample size of 304 respondents was required based on 95% confidence level, 72.8% estimated prevalence of Malaysians eating at least five servings of fruits and vegetables daily [5], and 5% error. A total of 429 staff agreed to participate and 81% of respondents completed all measurements. The research protocol was approved by the Medical Research Ethics Committee of Faculty of Medicine and Health Sciences, UPM. Signed informed consent was obtained from all respondents who agreed to take part in the study.
Measures
A Malay version of pre-tested self-administered questionnaire was used and it consisted of information on demographic and socio-economic, fruit and vegetable intake, stages of change algorithm and the diet-related psychosocial construct scale (perceived benefits, perceived barriers and self-efficacy). The self-administered questionnaire was pre-tested with 30 respondents to assess clarity, relevance and understanding of items. The content validity of the questionnaire was extensively checked and reviewed by a panel of three nutritionists and a health behavior and education expert.
Fruit and vegetable intake
Fruit and vegetable intake was assessed using 24-hour diet recall through face-to-face interview on two non-consecutive days (one week day and one weekend). Respondents were asked to describe the foods and beverages consumed, brand names, preparation methods, recipes of any mixed dishes and eating outside or at home. A set of calibrated household measurements (e.g. cups, bowls, glasses) were used to guide the respondents to estimate the quantity of food and beverages consumed. Intake data were analyzed using Nutritionist Pro™ single version 2.5 (First Data Bank, USA, 2005). The amount of fruits and vegetables, whether in raw or cooked forms and in single or mixed dish was converted into grams. One serving of fruit and vegetable was defined as: (1) one cup of raw green leafy vegetables such as spinach and salad; (2) one-half cup of other vegetables cooked or chopped raw such as tomatoes and carrots; (3) one medium size piece of fruit such as orange, banana and watermelon; (4) one-half cup of chopped or canned fruit and (5) one-half cup fresh vegetable or fruit juice. Adequate serving of fruits and vegetables was defined as at least five servings of daily fruits and/or vegetables [19].
Stages of change algorithm to increase fruit and vegetable intake
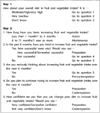
The classification of stages was determined using a two-step process [20]. In step 1, respondents were asked to self-rate their level of fruit and vegetable intake as "very low/low", "moderate/high/very high" or "don't know" In step 2, the stages were classified using staging algorithm based on self-rated of fruit and vegetable intake and individual's intention to change. Individuals with moderate, high and very high intake of fruits and vegetables were categorized into action (adopting healthy behavior for less than 6 months) or maintenance stage (maintaining healthy behavior for at least 6 months) while those who consume low to very low level of fruit and vegetable or do not know their intake were categorized into pre-contemplation (has no intention of making change within the next 6 months), contemplation (has thought of making change but no attempt made within the next 6 months) or preparation stage (planning to change over the next 30 days). The staging algorithm as used in the questionnaire is presented in Fig. 1.
Diet-related psychosocial constructs
A decisional balance questionnaire was used to measure perceived benefits (positive perception of behavior) and perceived barriers (negative thoughts or difficulties to change behavior) to increase fruit and vegetable intake [21]. The decisional balance questionnaire consisted of seven items of perceived benefits (Cronbach α = 0.92) and seven items of perceived barriers (Cronbach α = 0.904). Each item was rated on a 5-point Likert scale, from 1 "not at all important" to 5 "very important". Nine items of self-efficacy (Cronbach α = 0.928) measured confidence to increase fruit and vegetable intake in difficult situation [22]. Each item was measured on a 5-point Likert scale ranging from 1 "Not al all confident" to 5 "Very confident".
Data analysis
The SPSS version 15.0 software (SPSS Inc, Chicago IL, 2007) was used for data analysis. Descriptive statistics (mean, standard deviation and frequency) were presented for all variables. The total score of diet-related psychosocial variables were converted into standardized T-scores for further analysis with a mean of 50 and standard deviation (SD) of 10. As 10 T-scores is equaled to 1 SD change, a change of 0.5 SD and 1 SD are considered to be a medium-sized effect and strong-sized effect, respectively [23,24]. Effect size (η2 = d2/(d2 + 4); d is the difference between two means, expressed in standard deviation unit) was calculated to determine the magnitude of differences or proportion of variance in psychosocial variables that is attributable to stages group [23,24]. A 1 SD differences in diet-related psychosocial variables correspond to an effect size of 0.2 (20% of variance in diet-related psychosocial variables explained by stages of change). ANOVA examined the differences in psychosocial variables by stages of change while bivariate analyses determined the relationship between diet-related psychosocial factors and intake of fruits and vegetables. Univariate ANCOVA determined the difference in fruit and vegetable intake across stages group, adjusting for covariates (age, marital status and household income). Bonferroni test was used for post hoc analysis and a significance level was set at 0.05.
RESULTS
Demographic and socio-economic characteristics and fruit and vegetable intake
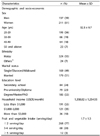
Respondents in this study were majority women (61%), Malay (93%) and married (51%) (Table 1). Majority (93%) of respondents were in the age group of 20-49 years. The average monthly household income was USD $1,358.82. Only 3% of respondents consumed at least five servings daily of fruits and vegetables. On average, respondents only consumed 1 serving of fruit and 0.7 serving of vegetables, daily.
Stage of change and psychosocial characteristics of increasing fruit and vegetable intake
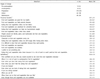
Half of the respondents were in preparation, 25% in maintenance, 18% in action, and 7% in pre-contemplation and contemplation stage (Table 2). On average, respondents had high total score of perceived benefits. Health benefits items (e.g. good for health and can help prevent diseases) were rated with the highest score of benefits by the respondents. Respondents also rated high score for benefit on social influences (family, peers and workmates) that increase their fruit and vegetable intake. A low total mean score of perceived barriers to increase fruit and vegetable intake was reported. Safety of fruits and vegetables was rated as the main barriers to eating fruits and vegetables. The total mean score of self-efficacy was rated moderately by respondents. Lowest self-efficacy was reported for eating more fruits and vegetables when they are not available.
Diet-related psychosocial factors and fruit and vegetable intake by stages of increasing fruits and vegetables
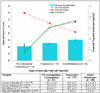
Due to small sample size in several stages, the five stages were collapsed into three groups as pre-contemplation/contemplation (n = 24), preparation (n = 176) and action/maintenance (n = 148). Fig. 1. shows the mean scores of psychosocial factors for perceived benefits (F = 5.07, P < 0.01), perceived barriers (F = 4.83, P < 0.05) and self-efficacy (F = 9.17, P < 0.001) significantly differed across stage groupings. The mean scores of perceived benefits among the respondents in preparation (49.7 ± 9.3, P < 0.05) and action/maintenance stages (51.3 ± 10.3, P < 0.01) was significantly higher than those in pre-contemplation/contemplation stages (44.5 ± 11.8). Similarly, respondents in preparation (49.7 ± 9.5, P < 0.01) and action/maintenance stages (51.5 ± 10.3, P < 0.001) had significantly higher scores of self-efficacy than those in pre-contemplation/contemplation stage (42.4 ± 7.8). The mean scores of perceived barriers among those in pre-contemplation/contemplation stage (53.9 ± 5.9, P < 0.05) was significantly higher than those in action/maintenance stage (48.3 ± 10.3). The proportion of variances in perceived benefits, perceived barriers and self-efficacy explained by stages of change were 11%, 7% and 17%, respectively. However, this study did not find any significant relationship between perceived benefits with the intake of fruit and vegetables (Table 3). The adjusted mean daily serving of fruits and vegetables significantly differed across stages groups (F = 4.52, P < 0.05). Respondents in the action/maintenance stage (1.9 ± 0.1 serving) consumed more daily serving of fruits and vegetables than did those in pre-contemplation/contemplation (1.3 ± 0.3 serving) and preparation stages (1.6 ± 0.1 serving) refers (Fig. 2). Perhaps, Fig. 2 can be inserted after 'serving'.
DISCUSSION
In this study, half of the respondents were in the preparation stage. Similar findings were reported by the National 5-a-day for Better Health community studies where 46-65% of US adults were in the preparation stage [14]. However, there are also studies that showed a high proportion of adults (48-66%) were in the action and maintenance stage [15,25,26]. While De Vet et al. [21] found that 40.6% of Dutch adults in Netherland were maintainers and 24.2% were pre-contemplators, a study among low-income African-American mothers reported an equal distribution of stages for contemplation (21.4%), preparation (19.3%), action (21.7%) and maintenance (28.3%) [9].
The stages distribution of increasing fruit and vegetables varies widely across studies [8,9,14,21]. The different socio-demographic characteristics of target populations could explain the different degree of readiness to change. Women, older and better educated individuals are significantly more likely to be in action and maintenance stages than men, younger and less educated individuals [14,25,27]. The stages distribution may also reflect the trend in promoting fruit and vegetable intake in a particular country. For instance, the 5-a-day Program launched since 1991 has increased the Americans' awareness to have at least 5 servings daily of fruits and vegetables [28], and this may explain why more Americans than Malaysian were in action and maintenance stages [8,9,15].
In most studies [11,14,27,28,29], respondents in the action and maintenance stages had a significantly higher intake of fruits and vegetables than respondents in the pre-contemplation, contemplation and preparation stages. A study among low-income African-American women found that those in the later stages had higher daily intake of fruits, fruit juices and vegetables (11 servings) than the earlier stages (3 servings) [9]. In the present study, although fruit and vegetable intake was significantly higher in action/maintenance stage than other stages, the daily intake of fruits and vegetables did not meet the recommended level. Although the respondents might perceive that they have already eaten adequate and have high intake of fruits and vegetables, they might not be aware of the exact amount of fruits and vegetables deemed adequate to be consumed [30]. The present finding showed that about 97% of respondents did not take adequate fruits and vegetables, and this was in line with National Health and Morbidity Survey 2011 that reported 92.5% of Malaysian adults did not achieve recommended daily intake of fruit and vegetables [6].
Although there was no significant relationship between self-efficacy, perceived benefits and perceived barriers with the intake of fruits and vegetables in which contradict the review findings by Shaikh et al. [29], these psychosocial factors are important drivers in promoting fruit and vegetable intake across stages [9,11,14,15]. The non-significant findings could be due to the low intake of fruits and vegetables as most of the respondents consumed less than two servings daily of fruits and vegetables, resulting in a smaller range of potential variance due to baseline effect. Yet, the pattern and magnitude (d) of relationship among these psychosocial variables across stages appear to be useful in understanding the individual's intention and action to change [31].
Similar to other studies [8,11,25,32], we showed that high perceived barriers and low perceived benefits were found in pre-contemplation and contemplation stages while low perceived barriers and high perceived benefits were found in action and maintenance stages. The perceived benefits tend to outweigh perceived barriers preceding to taking action in that individuals will take action when they rate the benefits of eating more fruits and vegetables (i.e. health benefits, social influence) as more important than the barriers (i.e. safety, satiety and storage of fruits and vegetables). Prochaska [31] proposed that a 1.0 SD increase in perceived benefits (strong principle) relative to 0.5 SD decrease in perceived barriers (weak principle) would motivate individual to progress from pre-contemplation to action stage. The present study showed that the magnitude of difference in perceived benefits (0.7 SD) between stages was greater than perceived barriers (0.56 SD) [23], but the magnitude of difference in perceived benefits were somewhat smaller than the predicted 1 SD.
Self-efficacy is an important driver to motivate individuals to practice and maintain a diet high in fruits and vegetables [8,9,14,15,16]. A 0.9 SD magnitude of differences for self-efficacy between pre-contemplation/contemplation and action/maintenance stage was observed in this study indicating a strong effect size [23,24]. However, this magnitude of difference was smaller than 1-1.5 SD [33,34]. Self-efficacy has been shown to increase across stages in a similar pattern as perceived benefits [8,9,11,15,25], and is assumed to be similar to perceived barriers in the cross-over with perceived barriers i.e. between contemplation and preparation. However, this study showed that the crossing point for self-efficacy and perceived benefits with perceived barriers occurred at a later stage that is between preparation and action/maintenance. The barriers of safety, satiety and storage of fruits and vegetables and preferences for other foods perceived by respondents seemed to delay their action to increase the intake of fruits and vegetables. As compared to Ling & Horwath [11], our respondents had higher perceived barrier at every stage of change which could explain the delayed cross over between perceived barriers with perceived benefits and self-efficacy. The barriers to adoption of healthy behaviors were also observed in recent National Health and Morbidity Survey III (2006) that reported only 60% who reported receiving health information took action [35].
There are limitations to this study. First, a self-administered questionnaire was used to identify the psychosocial variables and staging algorithm, which may not reflect the constructs measured as respondents might not express their true feelings and misclassified their actual intake of fruits and vegetables. However, each of the psychosocial variables and staging algorithm were pre-tested with 30 respondents to assess the clarity, relevance and understanding of items. Internal consistency of scales for each psychosocial construct was also determined prior to data collection. Secondly, the use of food album and household measurements in 24-hours diet recall would reduce the limitation of recall bias. Two non-consecutive days (one week day and one weekend) would also reduce the limitation of day-to-day variability. Thirdly, there was unequal sample size across stages of change due to small sample size. In addition, the intake of fruits and vegetables in present study was low (less than two servings daily). If present study was able to recruit population with large range of fruit and vegetable intake, there could have significant relationship between self-efficacy, perceived benefits and perceived barriers with the intake of fruits and vegetables. Furthermore, future studies of longitudinal design are needed to allow stronger inferences on causal relationship of psychosocial factors and dietary behavior although this cross-sectional study provides a presumed causal effect of the related psychosocial variables on stage movement. Finally, this study did not investigate other lifestyle factors (e.g. exercise, alcohol drinking and smoking) and psychosocial factors (e.g. self- and social-liberation and stimulus control) which may also be important determinants of individuals' fruit and vegetable intake. More in-depth studies should be carried out to investigate other possible association with the outcome variable.
In conclusion, the insight on the relationships between stages of change with related psychosocial factors potentially provides an understanding of individuals' intake of fruits and vegetables for designing nutrition education programs. Different strategies can be emphasized for individual with different stages of change. Cognitive strategies such as motivational information, confidence-enhancing messages or cues would be useful in raising perception of benefits and reducing the barriers among the pre-contemplators and contemplators while action-oriented strategies such as improvement in knowledge and development of practical skills through training, experience and familiarity with task and social supporting would be useful for the preparers in building confidence to practice a healthy behavior [36]. However, further intervention studies are needed to confirm the role of psychosocial factors in promoting specific dietary behavior change.

 XML Download