

 PDF
PDF ePub
ePub Citation
 Print
Print


Introduction
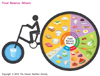
Dietary guidelines have been created to provide public education regarding healthy food choice for the promotion of healthy living and prevention of diseases. Many national governments and organizations have published dietary guidelines and often used to investigate the association between nutrient intakes with specific diseases such as cancer or chronic illnesses. The Korean Food Guidance System was introduced in 2010 by the Korean Nutrition Society (KNS). Its basic concept is planning a meal to satisfy the nutritional recommendation of major food groups, representative foods in each group and servings. Nutritional recommendations in the Food Guidance System are based on the Dietary Reference Intakes for Koreans (KDRIs) and Dietary Guidelines for Koreans. Furthermore, it includes the Food Balance Wheels (Fig. 1) developed to emphasize exercise which is excluded in a previous tower model. A backward big wheel consisted of the 6 major food groups to represent the servings of each food group and a front small wheel contains a glass of water. The six major food groups are 'Grains', 'Meat, Fish, Eggs, and Beans' (named as 'Meats'), 'Vegetables', 'Fruits', 'Milk and Dairy products' (called as 'Milks') and 'Oils, Fats, and Sugars' (called 'Oils'). This symbol outlines the importance of a balanced diet and a sufficient water intake for the improvement of an individual's health status and the prevention of obesity through adequate exercise.
The distinctive characteristics of diet, foods and nutrients make the study of nutrition epidemiology or correlation with health outcome more complex [1]. Thus, the focus of dietary assessment has moved toward investigating dietary pattern or measuring dietary quality through diet indices or scores [2-4]. The most direct way to evaluate dietary guidelines is to determine whether adherence to the guidelines predicts a better health status and for this purpose, a practical definition of adherence is needed. Many indices have been reported [5-7] and researches using these dietary indices have found the associations with adequate nutrients [8], disease biomarker [9,10], CVD [11] and several cancer type [12,13]. They are tools to comprehend the relationship between diets and health outcomes by assessing the degree of adherence to dietary guidelines [14], measures of nutrient density, conceptualized as the concentration of micronutrients consumed per unit of energy [15], and measures based on differing physiological responses to carbohydrate-containing foods [16]. However, no index is considered as a complete standard yet. The previous indices are not suitable to be applied to the Korean diet with an intact form. Other national indexes were based on the national dietary guideline and referenced the appropriate serving amount of representative foods provided from the guideline. Therefore, the revised index based on the Korean Food Balance Wheels has been needed.
Although the dietary guide was developed to promote healthful diets for the Korean people, the health benefits obtained from the adherence to this guide have not been examined. We developed KDS to assess adherence to Korean healthy diet based on the Food Balance Wheels, and evaluated whether diet based on the Food Balance Wheels are associated with various health-related factors such as clinical, physical, socioeconomic, and disease historic factors.
Subjects and Methods
Study population
The Korea National Health and Nutrition Examination Survey (KNHANES) has been conducted as a series of surveys in a cross-sectional study of nationally representative samples of the non-institutionalized civilian Korean population aged ≥ 1 yr. Detailed information about the KNHANES is described elsewhere [17]. In brief, comprehensive information on health and nutrition was collected from a stratified multistage probability sample of South Korean households representing the civilian, non-institutionalized population. This national survey was set to monitor the trends of prevalence, awareness, treatment, and control of selected chronic diseases. In addition, it was also set to monitor the trends in nutritional status and risk behaviors, and to analyze risk factors for chronic diseases. For these purposes, with standardized high quality methods, extensive data on health and nutrition were collected through health interviews, health examinations (physical examination, clinical measurements, and tests), and dietary interviews. We used the data of KNHANES 2007 and 2008 with a total of 14,338 subjects (4,594 in 2007 and 9,744 in 2008). Among them, 11,956 individuals supplied 24-hour dietary recall data and data on health behavior and health examination. Individuals less than 30 years and more than 80 years of age (4,542 subjects) and individuals exhibiting extreme total energy intake with 500 kcal/day or less and 5,000 kcal/day or more (105 subjects), individuals having diet therapy (1,517 subjects), pregnant or lactating women (85 subjects), cancer patients (210 subjects), and individuals who have no data of blood pressure were excluded from the analysis. Finally, 5,320 individuals with complete diet survey, health examination data and health interview data were included for this analysis.
Data collection
A health examination was comprehensively conducted, which included measurement of blood pressure (BP), height, weight, waist circumference, triglyceride (TG), high-density lipoprotein (HDL)-cholesterol, and fasting blood glucose. Hypertension was identified in individuals who met; SBP ≥ 140 mmHg; DBP ≥ 90 mmHg (the average values of twice measurement). Waist circumference was measured according to the WHO guideline at the end of a normal expiration, with the arms relaxed at the sides, under the midline of the participant's armpit, at the midpoint between the lower part of the last rib and the top of the hip. Trained interviewers conducted surveys in households and administered a structured questionnaire to obtain information on sociodemography, lifestyle, health characteristics and nutritional status including dietary supplement use for each respondent, smoking history, physical activity, alcohol consumption, and past medical history.
Dietary assessment
The 24-hour dietary recall questionnaire requested detailed descriptions of the type and amount of all foods consumed on the day prior to the interview, including snacks, beverages and ingredient information for all sauces and condiments. Additionally, if the time period or the place to eat each meal in question is not a typical day (e.g. birthday party), the subjects were asked to report two days prior to the interview date, or the most recent typical day. The 24-hours dietary recall began with the first meal or beverage consumed upon waking-up until midnight of the reporting day. Trained dietitians administered the 24-hours dietary recall using measuring cups, portion size booklets, and photographs and research dietitians accurately checked the records. Nutrient intake of each food item was calculated using the Diet Analysis Plus program (Cengage Learning, US) for a total of 17 nutrients (total energy, protein, fat, carbohydrate, fiber, calcium, phosphorus, iron, sodium, potassium, vitamin A, retinol, carotene, vitamin B1, vitamin B2, niacin, and vitamin C). Nutrient intake was calculated based on the 5th Edition Food Composition Table [15] and a database of processed and fast foods [16].
Definition of scores
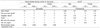
The Korean Food Balance Wheel was established in 2010 by The Korean Nutrition Society, which is based on the Dietary Guidelines for Koreans (Fig. 1). The aim of the Korean Food Balance Wheels is to provide recommended food choices and quantities for a healthful diet that can be easily adopted by the Korean public and the image of a bicycle and a cup of water are to promote physical activity. The food guide may be developed based on a common Korean meal consisting of six basic food group categories: grain dishes (including rice, bread, and noodles), fish and meat dishes (including meat, fish, eggs, and soybeans), vegetable dishes (including vegetables, mushrooms, potatoes, and seaweed), fruits (fruits and 100% fruit juice counted as half the weight), milk (milk and milk products), as well as oils and sugars. The amount of a particular type of food that counts as a serving is estimated in the food guide and is proportional to the area of each wheel. The recommended number of servings by each food group and the recommended total energy intake are specified according to gender and age (Table 1).
The Korean Diet Score (KDS) measuring adherence to this food guide were calculated from the dietary information in the 24-hours dietary recall questionnaire. Based on the intake amount for one serving of representative main foods provided from the Dietary Reference Intakes for Koreans [18], the number of servings for each of the six food groups was measured for individual scoring. Each group is scored from 0 to 10 depending on the degree of correspondence with recommendation. Although the contribution of each food group to the overall diet could be different, the same weight degree was offered to each food group due to the feature of KDS emphasizing nutritional balance. Overall balance is important to assure that each food element of an individual diet is well combined according to recommended proportions. Recommended serving points in the score equation were based on the proportions of six food groups in the Korean Food Guide Wheel and individual serving numbers referenced the amount of one serving of Korean representative foods provided in the Korean Dietary Recommendation. A person who consumed the recommended number of servings from any of the six food groups received a score of 10 for that group. For example, if a person consumed three of the recommended five servings of vegetables, the score was calculated as (10 × 3/5 = 6). We also took into account the negative implications of overconsumption, defined as exceeding the recommended intake of foods in the Korean Food Balance Wheels. Overconsumption incurs a penalty by subtracting a point proportionally to the number of servings consumed that exceeded the recommended intake for that group (e.g. exceeding the recommendation by 60% would result in a score of 4). For example, if a person consumed eight servings of fish and meat when the recommendation was five servings, the score was (10 - 10 × [8 - 5]/5 = 4). The score of a food group can be negative (i.e. for exceeding the recommendation by > 100%), due to this overconsumption penalty. In this case, the negative score was defaulted to zero. Next, the 6 component scores were summed and thus, the total Korean Diet score ranged from 0 (minimal adherence to the Korean Healthy diet) to 60 (maximal adherence).
Statistical analysis
Statistical analyses were conducted using SAS statistical software (version 9.2; SAS Institute Inc., Cary, NC, USA). The KDS was divided into approximate quintile categories for analyses. All the analyses were conducted using survey weighting to account for the complex survey design, which consisted of multistage, stratified, clustered samples. Probability sampling weights were used in conjunction with strata and primary sampling units to apply weight to the data analysis. The comparison of general characteristics between males and females was performed using the t test for continuous variables and the χ2 test for categorical variables. To detect any significant differences in the distribution of subjects across the quintiles of KDS with regard to categorical variables, the general linear model (GLM) procedure was used and p for linear trend was determined using the KDS quintile in its continuous form.
Results
Dietary characters and KDS in men and women of KNHANES IV
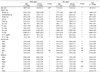
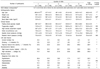
As demonstrated in Table 2, a clear gender and age difference was observed in daily energy and nutrient intakes for both younger individuals aged 19-64 and the older population over 65 years. Compared to women, men demonstrated a higher mean value in the daily intake of energy and overall nutrients and the serving size of four KDS food composites (grain, meat, vegetable and oil) in both the younger and older population. Among serving sizes of the other composites, dairy was not significantly different by gender, and fruit was significantly higher in younger men than in younger women. In all subjects, the mean KDS of total food composite was 25.3 ± 0.10 and the mean KDSs of grain, meat and vegetable were greater than 5 scores, while those of fruit, dairy and oil were less than 5 scores. The mean KDSs of younger women and older men were significantly higher than younger men and older women, respectively. In contrast to the results of daily food intakes, younger women showed the higher mean value of KDS for meat, vegetable, fruit and dairy as well as the lower mean value of KDS for grain and oil, compared to younger men. Older men showed the higher mean KDS of grain, meat and oil excluding fruit (significantly higher in older women than in older men), vegetable (ns; not significant) and dairy (ns) than older women.
Clinical, life style, socioeconomic and disease history factors associated with KDS quintile
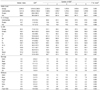
Anthropometric, clinical, life style, socioeconomic factors and disease history were analyzed by the quintile of KDS among men and women aged 19 and over in the KNHANES 2007-2008. Populations belonging to the high KDS quintile presented a significantly lower median level of Age, BMI, FBG, SBP, current smoking, and drinking time in both men and women with a significant and mild decrease (ns) of TG level, respectively. The characteristics of high house income and high education were positively correlated with the high KDS quintile group in both men and women (P < 0.05, Table 3, 4). Vigorous leisure time activity was significantly increased by the KDS quintile in women and mildly increased (ns) in men. However, there was no correlation between the KDS and the other indicated characteristics, such as HDL, WC and DBP in the two gender groups. Diagnosed disease history factors of women, such as hypertension, osteoporosis and diabetes, presented an inverse association with the KDS quintile (P < 0.01, Table 4), excluding anemia. In contrast to women, men presented no significant correlation with the indicated disease histories (Table 4) except anemia having an inverse shift (P = 0.013, Table 3) by the KDS quintile. This result demonstrates that KDS is closely associated with chronic disease-related health conditions and its correlation with disease history appears more evidently in the female population.
Trend of nutrient intake by KDS quintile
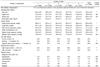
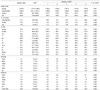
The total median KDS of men and women aged 19 and over were 24.5 (19.0-30.0) and 24.8 (19.6-30.4), respectively. The median KDSs of grain, meat and vegetable were over a score of 5, but those of fruit and dairy were to a score of 0 in both men and women. There was a significant correlation between the KDS quintile and the intake of several critical nutrients in the Korean diet (Table 5, 6). Furthermore, in the female population, the higher KDS quintile group demonstrated a more improved status in the ratio of three macronutrients, carbohydrate, protein and fat, which is featured by a decreased consumption of carbohydrate as well as an increased consumption of protein and fat (Carbohydrate: Protein: Fat = C:P:F, C:P:F = 76:12:11 in the lowest KDS quintile of women → C:P:F = 70:14:16 in the highest KDS quintile of women) (Table 6). In addition, women's KDS quintile was positively correlated with the median % DRI of calcium, potassium, vitamin A, vitamin B1, vitamin B2, niacin and vitamin C. This relationship was characterized by a shift of their % DRI more closely to 100% as the KDS quintile increases (P < 0.01, Table 6). Notably, the median % DRI of sodium, discussed seriously due to an excessive consumption in the Korean diet, was very high in all KDS quintile groups for both men and women. In contrast to women, men did not show a positive correlation with the KDS quintile in regard to the intake of various nutrients as well as the meaningful alteration in the ratio of three caloric nutrients. Taken together, the KDS is closely correlated with various desirable directions for healthful nutrition and this appearance was more descriptive in the women population.
Discussion
The results of this study imply that KDS indicating dietary quality based on the Food Balance Wheels has a beneficial influence on health-related factors among a general Korean population. With higher adherence scores among men and women, main results were observed in dietary factors, key blood biomarkers, lifestyles, socioeconomic characters and disease histories. There was an evident association among men and women between KDS and health related-factors such as fasting blood glucose, triglyceride, systolic blood pressure, hypertension, osteoporosis and diabetes and diseases. In lifestyles and socioeconomic factors, smoking and drinking were inversely associated with KDS, and the other characteristics such as leisure, house income and education had a significantly increasing trend by KDS. Furthermore, KDS showed a positive correlation with intakes of various healthful nutrients including Ca, Fe, K and vitamins, and also with a balance of the macronutrient ratio (carbohydrate: protein: fat) in women.
A few diet pattern scores have been developed including the Diet Quality Index (DQI), the Healthy Eating Index (HEI), the Alternative Healthy Eating Index (AHEI), and Mediterranean dietary pattern score, by measuring overall diet for a combination of nutrient components and/or compliance with established dietary guidance [6,19-21]. The DQI was designed to focus on diet related-chronic diseases in the United States [22], and was then revised for applying to the current dietary guidelines and emphasizing the significance of a balanced diet [23]. The HEI was created to monitor dietary intakes and nutrition improvement activities of the US. population [24] AHEI was developed to evaluate its relation in regards to the incidence of major chronic diseases [19]. The Mediterranean dietary pattern score was developed to investigate whether greater adherence to the traditional Mediterranean diet in a specific area may improve longevity or not [25]. The United States Department of Agriculture's (USDA) Center for Nutrition Policy and Promotion (CNPP) revised the HEI according to the 2005 'Dietary Guidelines for Americans' [26] including twelve individual components.
These instruments were beneficial on assessing variability within diets and overall diet quality for their individual populations and useful in evaluating nutritional improvements. KDSs were also developed as the encouragement for the 'Food Balance Wheel' of Korean Nutrition Society (KNS) for monitoring the dietary improvement of the Korean population and reflected the importance of overall nutritional balance including both over-nutrition and under-nutrition. 'Over-nutrition', defined as exceeding the recommended intake of foods, is being reflected in the score to deduct the score as much as 'under-nutrition', and it focuses on the nutritional balance in both dietary quality and quantity. In this regard, KDS is similar to the concept of DQI-International (DQI-I) created for cross-national comparison [20]. The KDS provides a national tool not only for monitoring chronic diseases but also for checking the nutritional transition of the overall population. Although several previous studies have reported dietary indices, none of the previous indices have specifically addressed the Korean dietary recommendations. This report is the first cross-sectional study assessing the adherence to a desirable dietary quality among the Korean population using the newly developed dietary score, KDS, on the basis of the national health and nutrition examination survey.
In the female population of the present study, KDS was strongly associated with fasting blood glucose, systolic blood pressure and triglyceride. Furthermore, hypertension, diabetes and osteoporosis, representative chronic diseases, also displayed a remarkably inverse correlation with KDS in women. Many studies have been introduced dietary trends using pattern scores or indexes in relation to nutritional [8] and biochemical markers [5-7] and various health outcomes [9-13]. Mostly, the healthful dietary patterns were associated with significant but modest risk reduction for mortality and coronary heart disease excluding inconsistent cancers [27]. KDS was significantly correlated with these biomarkers and might be reflected in their disease history. Interestingly, while KDS was inversely correlated with anemia in men, it was positively correlated in women. This result could be described from women's daily intake of Fe which was lower in the higher KDS group, and its median DRIs of each KDS quintile not being close to 100%. On the other hand, men contained median DRIs for Fe satisfying the recommended daily amount, in all KDS quintiles. This fact suggests that Fe intake, in the Korean women population, may even be considered as a critical nutrient for individuals complying with healthy diet guidelines. KDS was related desirably with smoking, drinking and leisure-time in lifestyle factors, and also associated strongly with house income and education in both men and women. Significantly, the KDS was influenced by education level, income level and age [24]. These trends were also robust in the HEI score and even for a homogeneous clinical sample of middle-income women [21].
The central elements of the typical Korean diet are steamed rice, several vegetables in raw, pickled, and steamed form, and food sources of protein such as fish, meat, and soybean based products. The high KDS population would closely meet recommended nutrient quantity based on KDRIs, particularly potassium, thiamin, riboflavin, niacin, and vitamin C in women. The total KDS score in this Korean population was mostly resulted from 'Grains', a main dish of the typical Korean diet. However, KDS of 'Milks' and 'Fruits' was very low, 'Milk' in older men over 65 years old was under one point as they consumed less than one serving per day (Table 2). Although the Korean diet is moving towards a western dietary pattern characterized with high consumption of animal products and fat, Koreans were still featured with an excessive intake of carbohydrate and an insufficient energy ratio acquired from protein and fat. In this point of view, the notable point is an improvement of the female population in the ratio of energies acquired from three calorie nutrients, carbohydrate, protein and fat. Another finding in the KDS evaluation was that the proportion of people with intakes less than the recommended amount was high for various nutrients particularly in women. This result is similar to a dietary tendency in even the economically developed United States [20]. Although a nutritional concern of Korean people has shifted to over-nutrition, several nutrients still did not come close to recommended amounts. To identify the suitability of KDS in assessing dietary quality, more studies should be performed with various methodologies in various populations. Future studies are needed to investigate prospectively the association between nutritional status or dietary habits and the risk of chronic diseases such as obesity, diabetes, hypertension and metabolic syndrome using KDS for an extended period of time.
In conclusion, this study examined the quality and quantity of total dietary intake and its correlation to several health outcomes or related factors by measuring adherence to the Korean 'Food Balance Wheels' using a new scoring system, the KDS. The results demonstrate that the KDS is associated with various health-related factors among the Korean population and would be beneficial in evaluating a dietary balance based on the KNS's Korean Food Guidance System in Korea. Furthermore, although more studies are needed, KDS could be informative in nutrition consultation and education to improve public health or administration of the government health system to prevent the public from chronic diseases.
 XML Download