

 PDF
PDF ePub
ePub Citation
 Print
Print


Introduction
According to the 2010 Korean National Health and Nutrition Examination Survey, the prevalence of high blood pressure in the Korean population of above the age of 30 years is 28.9%. Since 1998, the prevalence of high blood pressure has declined, and the awareness, then treatment rate, the control rate have increased [1]. However, statistics on the causes of death from the Korea National Statistical Office show that high blood pressure-related diseases rank 10th among all causes of death in Korea. This proves that these diseases remain among the main detrimental diseases [2].
Korean meals are traditionally rice-based. Kimchi, vegetables pickled in soy sauce (jangajji), soy bean pastes (jang), and other products that contain a large amount of salt are consumed with rice; this shows that salt preference is high in the Korea population, and the Korea population has one of the highest salt intakes in the world [3,4]. In addition, the sodium intake is almost 15.5% higher in rural areas as compared to the urban areas. This is because the food culture in these rural areas is yet to be modernized, unlike that in Korean cities. Rural residents still consume a large quantity of grains, kimchi, soy bean pastes, and vegetables pickled in soy sauce, which increases the risk of high blood pressure [5]. Such excessive intake of sodium not only leads to increased blood pressure, but also influences the occurrence of stroke, brain hemorrhage, chronic heart failure, and other cardiovascular diseases caused by high blood pressure [6-8]. In March 2012, the Korean Food and Drug Administration established 'the Sodium Intake Reduction Movement Headquarter'; this center is now making efforts towards improving awareness among citizens regarding the need to reduce sodium intake and change the food culture. The center is of the view that the most important task in this regard is to change societal attitudes, in general, rather than to change the private habits of individuals. Currently, 'Healthy Restaurant' by Korean Food and Drug Administration are involved in efforts to reduce the salt contents of seasoning or meat broth [9].
According to epidemiology studies, there is generally a quantitative correlation between sodium intake and blood pressure. It is reported that for populations with a lower intake of table salt, blood pressure does not increase with age; in addition, in groups with low blood pressure, salt intake is generally low [10].
The microelement zinc is a key constituent of enzymes that is required for various metabolic processes and is therefore necessary for tissue and skeleton formation, skin protection, cell-mediated immunity, DNA and RNA synthesis, and metabolism of carbohydrates, etc [11]. Zinc is found not only in the salivary glands, but also in saliva and is involved in the proper functioning of the gustatory nerve [12]. Zinc deficiency can lead to a worsening of the sense of taste [13], which can, in turn, damage the taste acuity [14]. It is known that salt taste perception and salty taste preference are influenced by the zinc nutritional status; this not only influences sodium intake, but is also related to blood pressure [15-20]. Previous research conducted outside of Korea has shown that the consumption of zinc in food and via supplements can increase taste acuity [21]. Korean research on zinc is mainly focused on the current status of zinc intake, including the zinc nutritional status [22,23]. There have also been studies on the zinc nutritional status in pregnant and breastfeeding women [24,25] and in diabetes patients [26]. However, there is a lack of Korean research on salty taste acuity and salty taste preference. Thus, the objective of this study is to investigate differences in zinc nutritional status and their relation with salty taste acuity and salty taste preference, blood pressure. And we also determined which foods majorly contributed to the sodium intake.
Subjects and Methods
Study participants
We enrolled male and female adult participants from the Kangneung and Samcheok regions of Kangwon province from November 2011 to March 2012. The total number of participants was 252, and in our analysis, we used data from 218 participants (66 men, 152 women) who completed all tests of the study; these were blood tests, a dietary intake survey, and a salty taste acuity and salty taste preference test. All subjects provided informed consent, and this study was approved by the National Academy of Agricultural science under Rural Development Administration.
Salty taste acuity and salty taste preference tests
A sensory test was conducted to assess the salty taste acuity and salty taste preference of participants. To estimate salty taste acuity, we used a salt-water solution comprising water and refined salt. This was a 2-stage experiment. First, we offered the participants 10 different salt-water solutions, starting with a solution with a low salt concentration and increasing the concentration as follows: salt concentration of 0.03, 0.06, 0.09, 0.12, 0.15, 0.18, 0.21, 0.24, 0.27, and 0.3% at room temperature. Participants had to note when they began perceiving saltiness. After this, a solution with 0.33% salinity was added to the series, and 11 forms of salt water were offered, from the highest concentration to the lowest concentration. The participants then had to note when they stopped perceiving the saltiness. The average value between the 2 results was considered the threshold saltiness concentration.
To test salty taste preference, we used bean sprout soup made only of bean sprouts and water. Salt concentrations of 0.15% and 1.0% were reached with the addition of refined salt. The participants first tried the soup with the less salty 0.15% concentration and then added the salty 1.0% soup to suit their preference. After this, salinity of the soup was measured twice with the help of a salinometer, and the average value between the 2 measurements was considered to be salty taste preference. The bean sprout soup was given at 50-60℃, and the participants rinsed their mouths with water each time after they tried the soup.
Dietary intake survey
The dietary intake of study participants was surveyed using the 24-h recall method. Information was collected using one-on-one interviews on 1 day in the middle of the week, and additional phone surveys were carried out on 1 day during the weekend. Trained interviewers with expertise in food and nutrition asked the participants about the food they had eaten the day before and recorded the ingredients and the intake amount for each meal. To increase the accuracy of the dietary intake survey, models of real food and picture materials were used [27]. With the help of CAN pro 3.0 Software (The Korean Nutrition Society, Seoul, Republic of Korea), we calculated the nutrient intake from the dietary intake data collected through our survey.
Dish frequency questionnaire for estimation of habitual sodium intake (Na index)
To estimate habitual sodium intakes, we used an amended version of the dish frequency questionnaire (DFQ 15) developed by Son et al. [28]. The survey data was recorded by trained interviewers in one-on-one interviews. The DFQ was designed to consider the contribution to intake frequency, sodium intake per one portion, and total sodium intake. Based on the sodium content per one portion of each type of food, extra points were given (more than 700 mg of sodium per one portion: 3 points; 500-699 mg: 2 points; and 300-499 mg: 1 point). The points were then multiplied by the intake frequency (every day: 5 points; more than 3 times a week: 4 points; 1-2 times a week: 3 points; 2-3 times a month: 2 points; once a month: 1 point; and almost never eat: 0 points) to yield the Na index.
Blood collection and blood pressure measurement
To analyze subjects' serum zinc concentrations, we collected 3.5 ml of venous blood gathered after subjects had fasted for 12 h. This was lightly mixed and left at room temperature for 30 min. The serum was then separated by centrifugation. The Neodin medical laboratory performed the blood analysis.
Statistical analysis
All data were analyzed using the SAS 9.2 statistical program (Cary, USA); data appears as mean and standard deviation. The participants from both regions, Kangneung and Samcheok, were further divided into 3 groups according to serum zinc level (T1: lowest; T2: intermediate; T3: highest). We adjusted the values for sex and age and compared the Na index, blood pressure, nutrient intake, and salty taste acuity and salty taste preference. We also divided the participants into 2 groups: those whose zinc intake was higher than the dietary reference intakes Koreans (2010) and the others. We calculated food intake of each food group for each of these groups. We identified the main sodium sources and calculated their rate and then analyzed the characteristics of the sodium sources for each region. All the adjusted averages were calculated using a general linear model.
Results
Smoking and health nutritional supplement use and dish frequency questionnaire
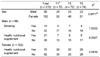
Table 1 shows the division of participants into smokers and non-smokers and users and non-users of health nutritional supplements based on their serum zinc level. Among the men, 14 were smokers and 52 were non-smokers, and 21 were taking health nutritional supplements, while 45 were not. Among the women, 2 were smokers and 150 were non-smokers, while 70 were taking health nutritional supplements and 82 were not. There was no significant difference in participants' zinc serum level on the basis of smoking or consumption of health nutritional supplements.
The Na index used for estimation of habitual sodium intake are shown in Table 2. The Na index based on the serum zinc level was 68.6 (T1), 71.4 (T2), and 63.9 (T3). This index was significantly lower in the group (T3) with the highest serum zinc level; this indicates that participants in this group consumed fewer food with high sodium content.
Serum zinc level and blood pressure
Data on the blood pressure of participants depending on their zinc serum level are presented in Table 3. This serum zinc level was significantly higher for participants from Kangneung (90.8 µg/dl) than those from Samcheok (81.2 µg/dl). Systolic blood pressure was higher in Kangneung participants (125.7 mmHg) than in Samcheok participants (121.8 mmHg), but this difference was not significant. However, for participants from Kangneung, the group with high serum zinc level had a significantly lower systolic blood pressure than the group with low serum zinc level (Table 3). The higher blood pressure in the Kangneung population, despite a high serum zinc level, than the Samcheok can be explained by other environmental factors than zinc intake status.
Nutrient intake status of participants
Data on the nutrient intake of the study participants are presented in Table 4. The energy intake of Kangneung participants (1688.1 kcal/day) was significantly higher than that of Samcheok participants (1632.4 kcal/day). The intake of carbohydrates, iron, and sodium was significantly higher for participants from Samcheok compared with those from Kangneung; conversely, the intake of fat, vitamin A, and niacin was significantly higher in Kangneung participants than in Samcheok participants. A comparison of the nutrient intake for the 2 regions based on serum zinc level shows that for Kangneung, the group with the low serum zinc level (T1) had a higher intake of energy, carbohydrates, and sodium and a lower intake of vitamin A than the group with a high serum zinc level (T3).
Salty taste acuity and salty taste preference of participants
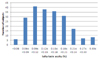
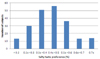
The distribution of salty taste acuity and salty taste preference of the study participants are shown in Fig. 1 and 2. The lowest threshold concentration for salt was 0.045%, and the highest threshold was 0.285%. The minimum salty taste preference level was 0.11%, while the maximum level was 0.77%. Most participants perceived saltiness at a concentration of 0.09%-0.12%, and most had a salty taste preference of 0.4%-0.5%. In a study by Ahn et al. [29] that looked at salty taste acuity and salty taste preference among adults in their twenties, most participants perceived saltiness at 0.06%-0.09% concentration and most preferred the 0.5%-0.6% salt concentration; this is a slightly lower value for acuity and slightly higher value for preference than that reported in the current study.
Values for salty taste acuity and salty taste preference by age are shown in Table 5. There were significant differences depending on age, with the saltiness threshold concentration at 0.15% for participants younger than 50 years of age, 0.13% for participants between 50 and 64 years of age, and 0.16% for participants above 65 years of age. The salty taste preference concentration was 0.42% for participants below 50 years of age, 0.41% for those between 50 and 64 years of age, and 0.43% for those above 65 years of age.
Salty taste acuity and salty taste preference and zinc nutritional status
Results for salty taste acuity and salty taste preference and their relationship with zinc nutritional status for participants from Kangneung and Samcheok are presented in Table 6. Salty taste threshold and salty taste preference concentrations were both significantly higher in Samcheok participants (0.17% and 0.45%, respectively) than in Kangneung participants (0.13% and 0.40%, respectively). Conversely, serum zinc level was 90.26 µg/dL in Kangneung participants and 81.65 µg/dL in Samcheok participants. However, comparison of salty taste acuity and salty taste preference for the groups of participants who had a zinc intake lower than the recommended nutrient intake (RI) of dietary reference intakes for Koreans and those who had a zinc intake higher that the Korean RI showed no significant differences. It should be noted, though, that in Kangneung, the salty taste threshold were higher for the group that had a zinc intake lower than the RI (threshold concentration, 0.13% [< RI] and 0.12% [≥ RI], respectively). For both groups, preferenced concentrations of salty taste was 0.40%, and there was no difference.
For Samcheok, the threshold concentration was 0.18% (< RI) and 0.16% (≥ RI) and preference was 0.46% (< RI) and 0.44% (≥ RI). There was no significant difference between the 2 groups, although the group that consumed less than the RI showed higher values; the serum zinc level was 79.4 µg/dl (< RI) and 81.5 µg/dl (≥ RI), and this was higher for the group that consumed more than the RI, but the difference was not significant.
Data on salty taste acuity and salty taste preference and their relation to serum zinc levels for Kangneung and Samcheok are presented in Table 7. For both regions, there was almost no difference in the salty taste threshold concentration based on the serum zinc level. Salty taste preference concentrations were 0.38% (T1), 0.39% (T2), 0.41% (T3) for Kangneung participants and 0.43% (T1), 0.43% (T2), 0.50% (T3) for Samcheok participants. Thus, there was a tendency for an increased salty taste preference concentration with increased serum zinc level, but there was no significant difference among the 3 groups.
Food intake status of study participants
The food intakes of the study participants and its relation with zinc intakes is presented in Table 8. For Kangneung, the groups with a zinc intake higher than RI showed a significant larger intake of grains, meat, and eggs than the group with an intake lower than RI. In Samcheok, there was a significantly higher intake of seeds and nuts, meat, fat, and oils. The grain intake was 493.1 g (< RI) and 547.3 g (≥ RI) for Kangneung participants and 526.2 g (< RI) and 598.7 g (≥ RI) for Samcheok participants; the group that hand zinc intake higher than RI had a significantly higher grian intakes in Gangneung. The results of the 2010 Korean National Health and Nutrition Examination Survey showed that the grain intake for people in small towns or townships was 321.7 g/day [1].
Meat intake was significantly higher in the groups with a zinc intake higher than RI in both regions, which confirms that meat is a good sources of zinc.
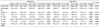
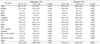
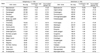
The main sodium sources are shown in Table 9. The most important product for increasing the intake of sodium in both regions was Baechukimchi. The amount of sodium consumed through Baechukimchi was 1,344.0 mg in Kangneung and 1,815.7 mg in Samcheok. In Kangneung, other sodium sources included Doenjang-jjigae, Doenjangguk, Ramyeon, Kimchi-jjigae in order of importance. In Samcheok, this order was Gajami-sikhae, (salted flatfish with grains), Doenjangguk, Dorumuk-jorim, Cheonggukjang-jjigae. There is clear difference between the 2 regions in terms of the diet. The presence of Gajami-sikhae in the list for Samcheok reflects food culture in the East Sea regions. It is the typical local dish in these regions. Apart from the foods already listed, among the top 20 foods that increase sodium intake are Ramyeon, Godeungeo-jorim, Kalguksu, etc.
Discussion
This study was conducted to explore differences in zinc nutritional status and their relation with salty taste acuity and salty taste preference, blood pressure, and nutrient and food intake for residents of Kangneung and Samcheok regions in Korea's Kangwon province.
We found that the population Kangneung has significantly lower salty taste threshold concentrations and salty taste preference concentrations than the population from Samcheok, while the serum zinc level of Kangneung population was significantly higher. In this study, we also explored salty taste acuity and salty taste preference depending on zinc intake status in both regions. In Samcheok, the group with higher zinc intake showed a lower salty taste threshold and lower salty taste preference concentrations. However, the difference groups was not significant.
In our study, the results of a comparison of sodium intake and the Na index (acquired using food frequency questionnaire for estimation of sodium intakes) showed that a higher serum zinc level indicated a lower sodium intake and Na index score. A previous study of zinc nutritional status and salty taste acuity and salty taste preference by Ahn et al. [29] showed that only participants with a serum zinc level lower than the standard had higher salty taste preference concentration as the concentration of serum zinc level lowered. Although zinc deficiency influences salty taste preference, it has been reported that differences within the normal score of zinc concentration variation do not have a large influence on salty taste preference. Conversely, Stewart-Knox et al. [31] found no correlation between serum zinc level and salty taste acuity, but they found that a higher zinc concentration in red blood cells was associated with a higher taste acuity.
Studies on zinc intake and salty taste acuity and preference also show differences based on sex. In the study by McDaid et al. [20], women with high zinc intake had better salty taste acuity, but there was no significant finding for men. Ahn et al. [29] also analyzed the connection between zinc intake and salty taste acuity and preference and found that the only significant correlation was found in women. In addition, zinc intake has been shown to be related to taste function, which shows differences between men and women in terms of the zinc intake, and salty taste acuity and preference. A previous study on the food intake of rural adults according to saline sensitivity showed that the participants less sensitive to salt had a high intake rate of salt-preserved foods such as salted fish or vegetables pickled in soy sauce, as well as poultry and meat and eggs [30]. With increased age, salty taste acuity decreases, and people tend to eat very salty food, thus increasing their salt intake. Accordingly, there is a need to raise awareness about low salt intake among older people.
Other studies have demonstrated that better zinc nutritional status leads to improve cognitive performance and the recognition threshold for salt. Tupe and Chiplonkar [21] investigated the influence of zinc supplements on taste acuity and found that a significant fall in recognition thresholds for salt was noted after both diet and zinc supplementation for 10 weeks (P < 0.01): however, it remained the same in the group that did not receive the supplements for 10 weeks.
The findings of this study, together with the results of previous studies, indicate that zinc deficiency is linked with a reduction in the senses, including eyesight, taste, and smell [32,33]. One of the symptoms of zinc deficiency is damage to the sense of taste [34,35], and this symptom can be successfully treated with zinc supplements [36,37]. However, studies have shown conflicting results in terms of the relation between zinc nutritional status (serum zinc levels or zinc plasma levels) and taste acuity as well as zinc intake and taste perception function. These results differ in terms of sex and the level of zinc deficiency. Therefore, to establish the relation between zinc nutritional status, salty taste acuity, and salty taste preference and, in turn, blood pressure, there is the need for a large scale longitudinal study that includes people from different strata of society. The higher blood pressure in the Kangneung population, despite a high serum zinc level, can be explained by other factors than zinc lntake status.
There is a need for further research on the relationship between intake of different minerals and high blood pressure. Potassium plays an important role in terms of limiting sodium consumption to reduce blood pressure; it helps in excreting sodium from the body. In addition, calcium increases sensitivity to salt, and when renin activity is low, it acts to reduce blood pressure. Calcium facilitates the excretion of sodium with urine, which causes a decrease in the amount of intracellular fluid. Subsequently, this causes a decrease in blood volume, in turn lowering the blood pressure. Thus, potassium, calcium, and magnesium influence the control of blood pressure.
In addition, salty taste acuity appears to decrease with age. Thus, there is a need to explore what factors influence this change.
Finally, future studies should focus on determining how to preserve the taste characteristics and safety of low-salt Korean traditional foods. For example, a low-salt Gajami-sikhae recipe could be developed for the residents of the Samcheok region.


 XML Download