

 PDF
PDF ePub
ePub Citation
 Print
Print


Introduction
It is anticipated that the current rapid aging of Korean society indicates that 14.3% of the population will be classified as elderly by 2018, and Korea will enter a phase of a super-aged society with 20.8% elderly by 2026 [1]. Social and economical challenges cause senior populations to experience limitations to food selection and face undernourishment, and the risk of malnutrition increases compared to the other populations [2]. It is reported that the state of seniors' nutrition caused by the limitations of daily activities from a physical and physiological malfunction [3], changes of family types [4], and economical factors [5] leads to insufficient quantity and poor quality of meals. Accordingly, the problems with meals are the main reasons for malnutrition [6]. Seniors' good nutrition is a crucial element in the quality of life, and the provision of food and nutrition that invigorates senior citizens and food-related psychological factors are also concerned with the quality of life [7]. In particular, the seniors who live alone, are economically disadvantaged, frequently underfed, and easily exposed to undernourishment, due to a sense of isolation and depression [8]. Thus, attention should be paid to the improvement of the quality of life that helps low-income homebound seniors live a healthy life without ailments and disabilities since they are not able to move about to take advantage of the feeding facilities [9]. The number of seniors who live by themselves will increase along with the growing population of seniors. Therefore, the importance of food delivery services has been widely recognized [10], but those programs have not been reasonably implemented by considering a variety of factors that affect meals for senior citizens [11]. As seniors do not want their life expectancy to be lengthened without the improvement of life quality, support at the societal level is needed in order for homebound seniors who receive food delivery service to lead a healthy, independent life. Consequently, the aim of the current study is to develop a construct model after the related factors to the quality of life of homebound seniors participating in meal delivery programs are examined and identified.
Materials and Methods
Subjects
Seniors receiving assistance from meal delivery service in Seoul participated, and a researcher who was knowledgeable about the seniors and the food service program, individually asked them if it was permissible to collect data. The data were collected from 162 senior citizens, from October to November 2010, and approximately 30 to 40 minutes was taken per person.
Questionnaire
The questionnaire was developed based on the previous studies [7,12-16], adapted and completed through professional advice. The questionnaire items consisted of demographic characteristics of the elderly registered for in the meal delivery service, daily activities, emotional security linked to food, food enjoyment, foodservice satisfaction, and quality of life. The 5-point Likert scale was utilized to evaluate the items; selecting 1 point indicates 'strongly disagree' while checking 5 points denotes 'strongly agree.'
Research hypotheses
Independent variables were daily activities, emotional security connected to food, food enjoyment, and foodservice satisfaction was introduced as a parameter; the dependent variable was the quality of life. The following hypotheses were set up based on the assumption that the variables of this model were closely related.
Hypothesis 1: The daily activities of the elderly who receive the foodservice will significantly affect the foodservice satisfaction.
Hypothesis 2: The sense of the emotional security connected to food, of the elderly who take advantage of the foodservice, will significantly affect the foodservice satisfaction.
Hypothesis 3: The food enjoyment of the elderly who get the foodservice will significantly affect the foodservice satisfaction.
Hypothesis 4: The daily activities of the elderly who get the foodservice will significantly affect the quality of life.
Hypothesis 5: The sense of the emotional security linked to food, of the elderly who get the foodservice, will significantly the affect quality of life.
Hypothesis 6: The food enjoyment of the elderly who get the foodservice will significantly affect the quality of life.
Hypothesis 7: The foodservice satisfaction of the elderly who get the foodservice will significantly affect the quality of life.
Variables
Food emotional security
Feelings of food insecurity denote a deficiency of a basic human desire. The question items are associated with the emotional stability in relation to food security, based on the previous studies [12,16]. If a high point value is awarded, the sense of emotional security involving food is established. A reverse coding was performed for negatively worded items.
Delivered foodservice satisfaction
Food can greatly affect the maintenance of a perceived quality of life, and also, the satisfaction produced by the delivered food can considerably influence the quality of life. The selection of a higher number means greater satisfaction. The items involving foodservice satisfaction were determined by referring to previous studies [14,15].
Quality of life
Quality of life is evaluated based upon how seniors think of their life and activities in the past and present, and how much they expect for their future life and activities [17]. Based on previous studies [7,13], the selection of a higher number represents more improved quality of life. A reverse coding was performed for negatively worded items.
Statistical analysis
The data were analyzed by SAS 9.2 (SAS Institute Cary, NC, USA) and SEM, which was created by AMOS 5.0 packages. Firstly, the reliability was deduced by an exploratory factor analysis and a Cronbach's alpha coefficient, and then, the validity was established by a confirmatory factor analysis. Secondly, a correlation analysis was performed for SAS 9.2. Thirdly, SEM was utilized to identify a path coefficient of the current study model on the basis of the reliability and validity results.
Results
Subjects
According to the demographic analysis of the seniors and the status of delivered meals in Table 1, 96.30% of the participants who benefitted from foodservice programs were aged 65 or older, 62.35% were elderly living alone, and 16.05% were elderly living with their spouse. Most of them depended on government subsidies and donations for living. In terms of the period of receiving food delivery service, the highest percentage (26.54%) belonged to 3-4 years, and the meals were delivered before noon (91.36%).
Exploratory factor analysis of questionnaire items
Daily activities
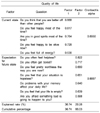
The results of the daily activities items, as determined by the exploratory factor analysis, are presented in Table 2. The items include 'Are you able to go out without receiving help from others?', 'Are you able to perform daily living activities (dressing, washing, etc.) without receiving help from others?', 'Are you able to purchase the items you need without receiving help from others?', 'Are you able to manage your own bank accounts without receiving help from others?', 'Are you able to do housework (cleaning, dishwashing, etc.) without receiving help from others?', 'Do you have urinal and fecal incontinence?', 'Are you able to take medicine without receiving help from others?', and 'Are you able to eat food without receiving help from others?'. Therefore, the factor is named 'Daily activities.' The reliability and validity were established by 0.9513 of the Cronbach's alpha and 74.66% of the explained rate for the factor of daily activities.
Food emotional security
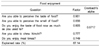
Table 3 shows the results of the emotional security items in relation to food by the exploratory factor analysis. The items are comprised of, 'Do you feel anxious because you cannot afford to buy food?', 'Do you feel anxious because you are not able to go to the markets to purchase the ingredients for a meal?', 'Do you feel anxious because you are not able to afford more food?', 'Do you feel anxious because you have to eat the same menus for several days in a row?', 'Do you feel anxious because you are frequently hungry and you do not have enough food?', 'Do you feel unhappy because the menus are mostly similar?', 'Do you feel unhappy because cooking problems keep you from enjoying the foods you would like to eat?', 'Do you feel unhappy because you eat most meals alone?', 'Are you not able to eat what you want for economic reasons?', and 'Are you able to speak your dissatisfaction with the menu freely?'. Accordingly, the name of the factor is 'emotional security linked to food.' The reliability was achieved by 0.9030 of the Cronbach's alpha, and the validity was established at 55.35% of the explained rate for the factor of food related emotional security.
Food enjoyment
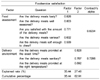
Table 4 displays the results of the food enjoyment items, as indicated by the exploratory factor analysis. The items consist of, 'Are you able to perceive the taste of food?', 'Are you able to perceive the smell of food?', 'Do you enjoy the taste of food now as much as you used to?', 'Are you able to chew 'kimchi'?', and 'Do you enjoy meal times?'. Thus, the name of the factor is 'Food enjoyment.' The factor of food enjoyment was reliable and valid, since the Cronbach's alpha was 0.8717, and the explained rate was 67.14%.
Delivery foodservice satisfaction
The results of the exploratory factor analysis, concerning foodservice satisfaction with the food delivery programs for senior citizens, are shown in Table 5. Three factors in total were identified as a result of the first factor analysis, but the low Cronbach's alpha coefficient was found from the factor, including items such as, 'Is the delivery person (the voluntary worker) friendly?', and 'Is a special food provided on special occasions like holidays?'. Therefore, the second factor analysis was conducted after the items were excluded. As a result, two factors were identified, and revealed 62.91% of the explained rate, and the respective Cronbach's alpha reliability coefficients for the factors 1 and 2 were reported as 0.8234 and 0.7286. Factor 1 comprises questions like 'Are the delivery meals tasty?', 'Are the delivery meals well seasoned?', 'Are you satisfied with the amount of the delivery meals?', 'Are the delivery meals various?', and 'Are the delivery meals soft enough to chew?'. Accordingly, Factor 1 is named 'Food assessment.' Factor 2 is composed of, 'Are the delivery meals provided at the exact time?', 'Are the delivery meals sanitary?', and 'Are the delivery meals provided at the right temperature (not hot or cold)?'. Accordingly, Factor 2 is titled as 'Delivery environment.'
Quality of life
Table 6 shows results concerning the quality of life items by the factor analysis. Three factors in total were identified as a result of the first factor analysis, but one item was excluded since the question item only comprises one factor. Then, the second factor analysis was performed. Three factors in total were identified as a result of the second factor analysis, but low Cronbach's alpha coefficient was found from the factor, including items such as, 'Do you get up easily in the morning?' and 'Do you frequently enjoy hobbies and other activities?'. Therefore, the third factor analysis was conducted after excluding the items. As a result, two factors were identified and displayed 66.03% of the explained rate, and the respective Cronbach's alpha reliability coefficients for the factors 1 and 2 were reported as 0.8950 and 0.8857, respectively. Factor 1 consists of, 'Do you think that you are better off than other people?', 'Do you feel happy most of the time?', 'Are you in good spirits most of the time?', 'Do you feel happy to be alive now?', and 'Do you feel full of energy?'. Then, the name, 'Current state' was chosen for Factor 1. Factor 2 is titled as 'Expectation for future state', according to the items, such as 'Do you often feel helpless?', 'Do you often get bored?', 'Do you feel pretty worthless the way you are now?', 'Do you feel that your situation is hopeless?', 'Do problems with your memory affect your daily life?', 'Do you feel that your life is empty?', and 'Are you afraid something bad is going to happen to you?'.
Correlation analysis for the variables
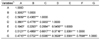
The results, as shown in Table 7, indicate that multicollinearity was not a problem among all variables since the highest correlation coefficient was 0.7698. There were significant correlations between all the variables. The most correlated variables were expectation for the future state and current state (r = 0.7698), and food enjoyment and daily activities were the next (r = 0.5939), which were followed by the expectation for future state and food related emotional security (r = 0.5702), and by the delivery environment and food assessment (r = 0.5450). The least correlated variables were delivery environment and daily activities (r = 0.1943).
Confirmatory factor analysis of the measurement model
As shown in Table 8, by the confirmatory factor analysis of the measurement model, Construct Reliability (CR) and Average Variance Extracted (AVE) are 0.7 or more and 0.5 or more, respectively, which sufficiently supports the reliability of latent variables and construct validity. The model was also confirmed as appropriate since the results of the goodness of fit indices revealed the value of χ2 = 25.72, GFI = 0.96, CFI = 0.96, IFI = 0.96, NFI = 0.95, AGFI = 0.84, SRMR = 0.04, and RMSEA = 0.13, which satisfied the recommended standards, and then proved the model appropriate.
Model fit test of the measurement model
Estimation test of the measurement model
Table 9 presents the results of the estimation of the measurement model by the path analysis. The Critical Ratio (C.R.) values of the foodservice satisfaction and quality of life were 4.453 (P < 0.01) and 13.425 (P < 0.01), respectively, which produced a significant result. In other words, food assessment and delivery environment are appropriate for the observed variable of foodservice satisfaction, which was a latent variable. It was also confirmed that the current state and expectation for future state were appropriate to evaluate the quality of life.
Latent model path analysis for assessing estimates
The results of the latent model path analysis for assessing estimates, as reported in Table 10, reveal that the daily activities (P < 0.05) and food related emotional security (P < 0.01) had significant effects on the foodservice satisfaction, but did not significantly affect food enjoyment. Daily activities (P < 0.05), emotional security produced by food (P < 0.01), and food enjoyment (P < 0.01) produced significant effects on the quality of life. However, delivery foodservice satisfaction did not significantly affect the quality of life at the 0.05 level of significance, as shown in Table 10.
Predictor effect coefficient in accordance with the structural path analysis
According to the results of the predictor effect coefficient, in accordance with the structural path analysis presented in Table 11, the respective total effects of daily activities and food related emotional security were 0.095 (P < 0.01) and 0.272 (P < 0.05), respectively, concerning the satisfaction with the meal delivery service, which means that daily activities and a sense of emotional security related to food played significant roles in the foodservice satisfaction. Then, in terms of the quality of life, the total effect of daily activities was 0.132 (P < 0.05), that of emotional security presented by food was 0.322 (P < 0.05), and that of food enjoyment was 0.447 (P < 0.05). This shows that daily activities, food related emotional security, and food enjoyment had significant effects on the quality of life. On the other hand, food enjoyment produced a direct effect on foodservice satisfaction, which also showed a direct effect to the quality of life, which did not reach the significance level.
Test of model fit indices
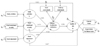
Table 12 reports the results of hypothetical model fit indices, as the value of χ2 = 5.72, GFI = 0.96, CFI = 0.96, IFI = 0.96, NFI = 0.95, AGFI = 0.84, SRMR = 0.04, and RMSEA= 0.13. Although the χ2 and RMSEA values were revealed to be inappropriate, the current research model in Fig. 1 was confirmed to be appropriate since the other indices like GFI, CFI, IFI, NFI, and SRMR proved to be appropriate; CMIN/DF and AGFI satisfied the recommended standard.
Discussion
This study was conducted to develop a construct model regarding the homebound seniors' quality of life under the assumption that daily activities, the emotional security maintained by food, and enjoyment of food of the homebound seniors in food delivery programs would have an effect on the foodservice satisfaction. Daily activities, the sense of emotional security linked to food, enjoyment of food, and foodservice satisfaction were assumed to affect quality of life of foodservice recipients. As a result of the exploratory factor analysis, Cronbach's alpha was 0.7 or more for all factors, which established the reliability. The results of the correlations revealed that multicollinearity was not a problem among all the variables since the highest correlation coefficient was 0.7698, and that significant positive correlations between the variables emerged. After factors were identified by the exploratory factor analysis, the confirmatory factor analysis of the measurement model was performed with AMOS to establish the validity. As a result, the χ2 and RMSEA values were revealed to be inappropriate, but the other indices, except for these two values, proved to be appropriate enough to satisfy the recommended level. SEM demonstrated that the daily activities (P < 0.01) and emotional security created by food (P < 0.05) had significant effects on the satisfaction of the foodservice, while the daily activities (P < 0.05), emotional security produced by food (P < 0.05), and food enjoyment (P < 0.05) also presented significant influences on the quality of life. Although food enjoyment over foodservice satisfaction and foodservice satisfaction over quality of life did not produce significance, direct causal influences were exerted. Thus, it was demonstrated that foodservice satisfaction increased as food enjoyment rose, and the quality of life of the elderly was more enhanced when foodservice satisfaction became greater. The current study results by hypothesis testing of the SEM (Structural Equation Model) analysis reported that the elderly had physical limitations by hypofunction, which lead to the reduction of food intake and foodservice satisfaction, and corresponded with those of the previous studies [16,18]. Hypothesis 1 was supported as the daily activities in the current study had a significant effect on foodservice satisfaction (P < 0.01). Although the elderly participated in the meal delivery programs, they ran the risk of undernourishment [19] since there was a possible lack of food at home. Thus, the secure provision of food via food delivery services could satisfy the elderly regarding the services. Therefore, hypothesis 2 was confirmed. Food selection and preferences affected the changes of palate senses that were also concerned with the lack of appetite in the elderly [18]. As the food intake of the elderly was influenced by whether they were able to eat, wanted to eat, or had nutritious food, they became undernourished if the food delivery services were unsatisfactory [20], but the enjoyment of quality food was non-significant. Although hypothesis 3 was not significantly supported, food enjoyment produced a direct effect on foodservice satisfaction. It was reported that daily activities of the elderly were the influential factor to the quality of life, which could be improved by the subjective state of health [21]. In addition, the chronic diseases and physical malfunction played a negative effect on the satisfaction of life of the elderly [22]. These results corresponded to hypothesis 4, where the daily activities significantly affected the quality of life (P < 0.05), which confirmed hypothesis 4. In terms of the food delivery programs, the quality of life had a significant correlation with food enjoyment, which was attained when the elderly had meals and when food was securely provided. On the other hand, the quality of life had a negative correlation with food insecurity, such as hunger and anxiety, which was caused by the lack of food for physical and economical reasons [7]. Hypothesis 5 was supported since the emotional security connected to food of the current study reached significance (P < 0.05). A strong association between the quality of life and degrees of food enjoyment, and having food preference, was reported [9], and the enjoyment of food and balanced nutrition reportedly improved the state of health and the quality of life [12]. Accordingly, hypothesis 6 was validated because food enjoyment significantly affected the quality of life. Foodservice satisfaction that is provided from Long-Term Care can influence the food intake of the elderly and their quality of life [12]. In particular, the elderly living alone wanted to increase the number of food delivery services, and the foodservice programs were needed as the provision of food reduced depression and improved the quality of life of the elderly [23]. Thus, foodservice programs should be part of the process to improve the quality of life of the elderly as one of the welfare projects [24]. Although hypothesis 7 did not reach significance, but produced a direct causal effect, the quality of life could be enhanced as foodservice satisfaction became greater. Previous research in case of the elderly women living alone, it reported that the satisfaction of life decreases remarkably as condition of poor economy [25], in order to improve the quality of their life, it should be necessary to provide the effort in part of both economic and health condition [26]. Further, their behavior performance in daily life could be more effective than the presence of disease [27], it is the most important to boost their healthcare related subjective well-being for the elderly's high quality of life, it reported [28]. The health of the elderly is a crucial factor for the determination of their quality of life, and it also contributes to the enhancement of the quality of life. However, it was revealed that the foodservice satisfaction did not significantly affect the quality of life of the elderly, and therefore, current foodservice programs might pose several problems in terms of operation. Considering the current Korean situations in which the elderly participating in food delivery programs have experienced physical, economical, and psychological difficulties, food delivery programs should become reliable sources for the provision of nutritional and stable meals. Thus, continuous support and concerns from the government and society are required, while taking several potential problems of meal delivery organizations into consideration.


 XML Download