

 PDF
PDF ePub
ePub Citation
 Print
Print


Introduction
Diabetes mellitus is a metabolic disease characterized by chronic hyperglycemia and is caused by increased hepatic glucose production or abnormal glucose use by skeletal muscle [1,2]. Adipocytokines, a variety of polypeptides secreted from adipocytes such as tumor necrosis factor-α (TNF-α) and adiponectin, play an important role in normal metabolic homeostasis and in the development of type 2 diabetes and dyslipidemia [3-5]. Activation of peroxisome proliferator-activated receptor-γ (PPAR-γ) by thiazolidinedione agonists used to manage type 2 diabetes induces adiponectin gene expression and helps improve endogenous insulin sensitivity [6-8]. In contrast, TNF-α is markedly elevated in obese subjects or patients with diabetic mellitus [9] and directly contributes to reduce adiponectin in adipocytes [6].
There has been a demand to identify new compounds for treating type 2 diabetes, and plants have been suggested as a rich and yet unexplored potentially useful source. Sorghum bicolor L. Monech is the fifth most important cereal crop worldwide, both in terms of planted area and metric tons harvested [10]. Sorghum flour is rich in phytochemical components, including tannins, phenolic acids, anthocyanins, phytosterols, and policosanols, with a potential to benefit human health [11]. These phytochemicals have gained increased interest due to their antioxidant activities [12], cholesterol-lowering properties [13-15], and anticarcinogenic [16] and antidiabetic effects [17]. Chung et al. [17,18] demonstrated that a sorghum extract (SE) reduces serum fasting cholesterol and glucose levels, but no previous reports have investigated the effects of sorghum or a SE on changes in adipocytokine levels or on the glucose-lowering pathway. Thus, this study investigated the hypothesis that a SE has antidiabetic effects through a mechanism that improves insulin sensitivity via PPAR-γ in adipose tissue of mice. The purpose of this study was to examine the effects of orally administered 0.5% and 1% SE for 6 weeks on glucose metabolism in mice fed a high-fat (HF) diet.
Materials and Methods
Animals and diets
This study protocol was approved by the Institutional Animal Care and Use Committee of Hanyang University and was used for all animal experiments (HY-IACUC-10-021). Six-week-old male C57BL/6 mice (Jung Ang Lab. Animal Inc., Seoul, Korea) were housed in individual ventilated cages in an air-conditioned room maintained at 22 ± 2℃ with a 12-h light-dark cycle. Mice were provided food pellets and fresh tap water ad libitum.
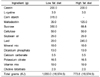
After a 1-week acclimatization, seven mice were fed an American Institute of Nutrition (AIN)-93M diet with 10% of total energy from fat for 14 weeks (low fat, LF), and 21 mice were fed a HF AIN diet with 60% of the total energy from fat. After 8 weeks of the HF diet, the mice were randomly divided into three groups (n = 7 each) that received either 0.1 mL of orally administered saline, 0.5% of dietary intake as SE, or 1% of dietary intake as SE for 6 weeks. The SE was dissolved in saline. The experimental diet compositions are given in Table 1.
Hwanggeumchal sorghum was grown at the Department of Functional Crops, National Institute of Crop Science, Rural Development Administration, Milyang, Korea during the 2009 growing season. Voucher herbarium specimens were deposited with the reference number (KNICS-579) in the Herbarium of the Department of Functional Crops. Identification was made by one of the authors, Dr. Ill-Min Chung of Kon Kuk University [17]. The samples were finely ground with a pin-type mill (DK-201, Sejung Tech, Daegu, Korea) and were extracted in 80% methanol in a shaker (WiseCube WIS-RL010, Daihan Scientific Co., Ltd., Seoul, Korea) at room temperature for 24 h. Subsequently, the extracts were centrifuged at 5,000 rpm for 30 min, and the supernatants were filtered through Advantec 2 filter paper (Advantec Toyo Kaisha Ltd., Tokyo, Japan). The combined filtrate was evaporated using a rotary evaporator (Eyela N-1000, Tokyo Rikakikai Co., Tokyo, Japan) at 40℃ and then freeze-dried in a vacuum (FDT-8612, Operon, Kimpo, Korea).
Food intake was measured daily, and body weight was measured weekly. At the end of the experiment, the mice were fasted overnight and euthanized the next day via exsanguination under anesthesia with an intraperitoneal injection of tiletamine (25 mg/kg), zolazepam (25 mg/kg), and xylazine (10 mg/kg). Blood was collected in SST tubes via heart puncture and centrifuged at 3,000 rpm for 15 min (HA 1000-3, Hanil Sciences Industrial Co. Ltd., Incheon, Korea) to obtain serum. Organs were harvested, rinsed with physiological saline, and weighed. Blood and tissue samples were stored at -80℃ until further analysis.
Oral glucose tolerance test
After 6 weeks of SE or distilled water administration, the mice were fasted overnight and then orally administered glucose at 2 g/kg body weight. Blood was obtained from the tail vein at 0, 30, 60, 90, and 120 min after administering the glucose, and glucose concentration was determined using a glucocard (Arkray Global Business Inc., Kyoto, Japan). Values of the area under the glucose-time curve (AUC) were calculated.
Glucose and insulin levels
Serum glucose concentration was measured using a commercial kit (Asan Pharm., Hwaseong, Korea) at a wavelength of 500 nm using a spectrophotometer (DU 600, Beckman Coulter, Inc., Fullerton, CA, USA). Serum glucose concentration was calculated from the corrected absorbance, according to the manufacturer's recommendations. Serum insulin levels were also measured using a commercial kit (Millipore Corp., Billerica, MA, USA) via an enzyme immunoassay at 450 nm with a microplate reader (ELx 800 UV, BIO-TEK Instruments Inc., Winooski, VT, USA).
Lipid profile and liver function
Serum levels of triglycerides, total cholesterol, and high density lipoprotein (HDL)-cholesterol were measured spectrophotometrically (Asan Pharm). Serum concentrations of triglycerides and total cholesterol were calculated from the corrected absorbance, according to the manufacturer's recommendation. Precipitates were prepared for HDL cholesterol, and the clear supernatant (100 µl) was collected according to the manufacturer's manual. Low density lipoprotein (LDL)-cholesterol was calculated using the Friedwald formula [19]. Glutamic oxaloacetic transaminase (GOT) and glutamic pyruvic transaminase (GPT) activities were measured spectrophotometrically using a commercial kit (Asan Pharm).
Western blotting
Adipose tissue was homogenized in a buffer containing 10 mM 2-amino-2-hydroxymethyl-propane-1, 3 diol-HCl (pH 7.4), 0.1 M EDTA, 10 mM NaCl, 0.5% Triton X-100, and a protease inhibitor cocktail tablet at 4℃. The homogenates were then centrifuged (14,000 rpm, 10 min, 4℃), and protein concentrations were determined (BioRad, Hercules, CA, USA). Duplicates of equal amounts of protein (50 µg) were separated on 10% polyacrylamide gels, transferred to polyvinylidine fluoride membranes, and blocked for 1 h at room temperature with 5% skim milk in Tris-buffered saline with Tween 20 (TBST). The membranes were then incubated with an antimouse PPAR-γ (1:700, Santa Cruz Biotechnology, Santa Cruz, CA, USA), antirabbit TNF-α (1:1,000, Cell Signaling Technology, Inc., Beverly, MA, USA), or antirabbit adiponectin (1:1,000, Cell Signaling Technology) with 5% skim milk in TBST overnight at 4℃. After several washes with TBST, the membranes were incubated with antirabbit IgG horseradish peroxidase-conjugated secondary antibody (1:2,000, Cell Signaling Technology) for 1 h at room temperature. Immunoreactive bands were visualized by enhanced chemiluminescence and captured on X-ray film. The images were converted to TIFF files and quantified using NIH imaging software (ImageJ version 1.37, National Institutes of Health, Bethesda, MD, USA). The relative and normalized protein expression was calculated as a density of β-actin (1:1,000 BD Transduction Laboratory, Franklin Lakes, NJ, USA).
Statistical analysis
Data were analyzed using the SPSS-PC+ statistical software package for Windows, version 17.0 (SPSS Inc., Chicago, IL, USA). All data are expressed as mean ± standard error of the mean. Differences among groups were analyzed using one-way analysis of variance, followed by Duncan's multiple-range test. Differences with P < 0.05 were considered significant.
Results
Effect on body composition and food intake
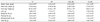
Dietary intake data, initial body weight, final body weight, and weights of the liver, epididymal, perirenal, retroperitoneal, and total fat are presented in Table 2. Dietary intake decreased significantly in a dose-dependent manner in mice fed 0.5% SE and 1% SE compared to that in the mice fed the LF and HF diets. Final body weight and epididymal, retroperitoneal, and total fat weights were significantly lower in mice fed LF than those in mice fed the HF diet and in those with and without SE. Perirenal fat weight was significantly lower in mice fed the LF diet, 0.5% SE, and 1% SE than that in mice fed the HF diet, suggesting that SE may significantly reduce the accumulation of perirenal fat; however, initial body and liver weights did not significantly differ among the groups.
Effect on hyperglycemia and dyslipidemia
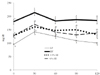
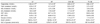
Table 3 shows serum lipid profiles, liver function, levels of glucose and insulin, and the AUC for the glucose tolerance test in each group. Total cholesterol levels were significantly lower in mice given 0.5% SE and 1% SE than those in HF diet fed mice and was lower in mice given 1% SE than those in mice fed the LF diet. LDL-cholesterol level was significantly (P < 0.001) lower in mice given 0.5% SE and 1% SE than that in the HF and low fat diet fed mice. Serum levels of glucose and triglycerides were significantly lower in mice given 0.5% SE and 1% SE than those in the HF mice but was not significantly lower than those in the LF diet fed mice. The mice fed the HF diet had a significant elevation in blood glucose level throughout the oral glucose tolerance test compared with those in the LF, 0.5% SE, and 1% SE groups (Fig. 1). The AUC for glucose decreased by 23% and 25% in mice given 0.5% SE or 1% SE, respectively, compared to that of the HF mice (Fig. 1 and Table 3). Serum insulin levels were significantly lower in mice fed 1% SE or the LF diet than in mice in the HF and 0.5% SE groups. No significant differences in levels of serum HDL-cholesterol, GOT, and GPT were observed among the groups.
Effect on antidiabetic protein expression
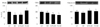
PPAR-γ expression was significantly higher in mice given 1% SE than in the HF and 0.5% SE groups but was similar to that in the LF diet fed mice (Fig. 2). TNF-α expression was significantly lower in mice given 1% SE than in the HF and LF diet fed mice and was significantly lower in mice given 0.5% SE than in the LF diet fed mice. Adiponectin expression was significantly higher in mice given 0.5% and 1% SE than that in the HF diet fed mice.
Discussion
As hypothesized, the SE appeared to have induced antidiabetic effects in mice fed a HF diet through a mechanism that increased adiponectin and decreased TNF-α via overexpression of PPAR-γ, leading to improved insulin sensitivity. Administration of both 0.5% and 1% SE significantly reduced serum glucose levels, but only the 1% SE treatment significantly lowered serum insulin level, suggesting that the 1% concentration increased antidiabetic effects, although our findings were not dose-dependent.
These findings are consistent with a recent study that showed that SE at doses of 250 and 500 mg/kg of body weight significantly decrease serum glucose levels in streptozotocin-induced diabetic rats [17]. Kim et al. [20] showed that SE is rich in polyphenols, which strongly inhibit in vitro α-glucosidase and α-amylase activities, and are targets for the development of diabetic drugs. Studies have also reported that polyphenols from cocoa extract [21] and Salacia reticulate extract [22] reduce serum glucose levels in type 1 diabetic rats. However, Lakshmi et al. [23] observed that consumption of whole sorghum significantly lowers fasting level and the glucose AUC in type 2 diabetic subjects, suggesting that these results could be due to fiber. Dietary fiber lowers blood glucose level by delaying gastric emptying, intestinal transit time, and carbohydrate absorption [24]; however, we previously reported that consuming sorghum grain has no effect on serum glucose or insulin levels compared with those in hyperlipidemic rats fed white rice [25]. These inconsistent results may be due to the type of sorghum consumed, sorghum grain vs. extract, or the animal model used.
PPAR-γ is involved in glucose uptake and lipid storage in adipocytes [26,27]. Activation of PPAR-γ to improve the sensitivity of insulin receptors is the predominant mechanism for the antidiabetic efficacy of PPAR-γ agonists [28]. Thiazolidinedione, a synthetic PPAR-γ ligand, significantly increases insulin sensitivity in patients with diabetes, interferes with TNF-α activity, and increases adiponectin levels [29]. Adipocytokines, primarily adiponectin and TNF-α released from adipocytes, appear to be associated with glucose metabolism [30]. Therefore, the hypoglycemic effect of sorghum in this study could be explained by increased PPAR-γ expression in adipose tissue, which consequently increased adiponectin expression and decreased TNF-α expression.
A significant decrease in total cholesterol, LDL-cholesterol, and triglyceride levels was observed in the SE-treated groups. Carr et al. [14] also reported that a sorghum lipid extract from whole kernels exerts a cholesterol-lowering effect by reducing cholesterol absorption with a concomitant increase in fecal sterol excretion. Polyphenols from green tea reduce plasma LDL-cholesterol concentrations by inhibiting cholesterol synthesis [31-33]. Because the cholesterol-lowering effects can be explained by decreased cholesterol synthesis and/or increased cholesterol excretion, the effect of SE on plasma cholesterol concentration in this study may have been due to either increased cholesterol excretion in the feces or decreased cholesterol synthesis in the liver. Chung et al. [18] also reported that a SE reduces plasma triglyceride concentrations in rats with diet-induced obesity, but the hyperlipidemic mechanism is unknown.
A few limitations of this study should be mentioned. No active control group was used (e.g., mice taking antidiabetic medication), dose dependency was not clearly detected due to the doses selected, and the hypocholesterolemic metabolism was not determined. We are currently conducting an animal study to examine the cholesterol-lowering action mechanism of sorghum. In conclusion, our results demonstrate that a SE appeared to have an antidiabetic effect and may have exerted its therapeutic effects through PPAR-γ overexpression in mice fed a HF diet. This is the first study to characterize the antidiabetic mechanisms of sorghum. However, future studies should examine the hypoglycemic effect of sorghum on protein expression during hepatic glucose production and glucose uptake by skeletal muscle.
 XML Download