Journal List > Nutr Res Pract > v.6(3) > 1051219

Lee, Cho, and Kim: The effect of salt usage behavior on sodium intake and excretion among Korean women

Abstract

This study was done to explore the effect of Korean women's salt usage behavior on their sodium intake and excretion according to aging. Dietary sodium intake and salt usage behavior were analyzed to compare the difference between young and middle-aged women. One hundred fifty six young women and 77 middle-aged women without hypertension or any current medication were recruited. Body mass index, waist hip ratio, blood pressure were measured from each subject. Salt usage behaviors were surveyed with questionnaire, sodium intake with 24-hr recall method, and sodium excretion with spot urine. Middle-aged women were more obese than young women according to body mass index and waist hip ratio. Blood pressure was significantly higher for the middle-aged. Young women consumed more fats and middle-aged women more carbohydrates. Middle-aged women consumed more sodium and potassium, and excreted more sodium. Among questionnaire items, kimchi, soup or pot stew, or salted vegetables were found to be related with high sodium diet. Salted vegetables and salted nuts and potato chips were significantly correlated with young women's high sodium diet, while soy sauce on fried food, kimchi, salted vegetables accounted for middle-aged women's high sodium diet. With these results, we concluded that middle-aged women consumed more carbohydrates, less fat, and more sodium and potassium than young women. Middle-aged women frequently choose kimchi, soup or pot stew, or salted vegetables, and they contribute to high sodium intake. We recommend to choose low-salt kimchi, less soup or pot stew, and more fresh vegetables for lower sodium diet.

Introduction

Sodium is rarely depleted in body pool but excess sodium intake could raise blood pressure for those who is salt-sensitive [1,2]. Though the combination of environmental factors and genetic factors accounts for the pathology of hypertension [3], salt intake has been reported as the most important environmental factor of blood pressure [4]. Excessive salt intake and accumulation in the kidney can increase plasma volume and lead to high blood pressure. Recent intervention studies reported that lower dietary sodium intake decreased cardiovascular problems [5].
The 2007 Korean National Health and Nutrition Examination Survey (KNHANES) reported that average sodium consumption was 4.4 grams a day, that is, more than twice of the dietary upper limits of sodium; and such excessive sodium intake is one of the magnitude dietary problems of Koreans [6].
Sodium is consumed in various ways, such as cooking, processing and seasoning, which are not measured easily. To make matters worse, Koreans consume greater amount of discretionary sodium that is added during cooking and eating. The accurate measurement of discretionary sodium is quite difficult [7].
Around age 50 women reach their menopause and get more body weight with increased body mass index (BMI). After menopause, women have larger waist circumference as well as higher systolic blood pressure, pulse pressure, total cholesterol, LDL cholesterol and triglycerides compared to those of pre-menopausal period. In addition, the prevalence of cardiovascular diseases also increases after menopause [8]. Intensive management of blood pressure, blood glucose and serum lipids for obese women in their 50s, is emphasized. Body weight and body fat begin to increase after menopause, and reduced estrogen redistributes body fat to the abdomen [9]. Recent westernized diet and lifestyle could be the reason of higher sodium consumption of the younger than the older [10]. Although the mortality of hypertension increases with aging, the risk factors on hypertension need to be discovered at an earlier age to promote health. Using salt usage behavior, they can predict dietary risk on hypertension.
This study was designed to discover the effect of Korean women's salt usage behavior on their sodium intake and excretion according to aging. Additionally the relationship between salt usage behavior and blood pressure was also verified.

Subjects and Methods

Data collection

Data collection was carried out from Oct. 14 to Nov. 25, 2008. Body weight, height, waist-hip ratio, and blood pressure were measured as the vital signs. The BMI was calculated by measured weight and height; the WHR was calculated by measuring the waist and hip circumference. The systolic blood pressure (SBP) and diastolic blood pressure (DBP) were measured twice by an automatic blood pressure measuring device (Digital Blood Pressure Monitor, HD-505, Jawon Medical Co., Seoul, Korea), and the average values were recorded.
Salt usage behaviors were surveyed by salt preference questionnaire developed by Kim et al. [11]. The questionnaire has 15 items, with 6 items about salt intake habits and 9 items on high-salt food consumption. Higher score implicates more salt consumption. Three to five responses were given for each question, and the questions were scored with even intervals from zero to 12 points to make the scores natural numbers. 24 hour recall method and urinary sodium excretion were executed to account for sodium intake. Dietary salt intake was surveyed with 24-hr recall method by trained interviewers. They were trained to review details on salt and high-salty food intake, through following cooking processes. Spot urine was collected from each subject on site, and was analyzed to estimate urinary sodium excretion.

Subjects

Study subjects were divided into two groups of young and middle aged women. The sample size required for the t-test (medium effect size 0.50, power of test 0.80 basis, two-sided test) was over 64, and for the correlation analysis (α = 0.05, average effect size correlation coefficient 0.30, power of test 0.08, two-sided test) was over 84. 165 female college students and 85 middle-aged women were recruited as a convenience sample of volunteers. All the volunteers were interviewed and only those with no previous diagnosis of hypertension and without current medication were included in the study. Study purpose and procedures were explained to the eligible subjects before they enrolled in the study. Informed consent was obtained from each participant. The study protocol was reviewed and approved by the Science Research Center Institutional Life Ethics Review Board of Eulji University (EU 08-22) on November 19, 2008.

Statistical analysis

Among the 250 enrolled subjects, 233 subjects with complete data of questionnaire, 24-hr recall and urine sample were remained. Chronbach's α of the questionnaire was 0.659. Twenty four-hr recall data were converted into actual sodium intake amount using Can Pro Professional 6.0 (The Korean Nutrition Society, Seoul, Korea). Urine samples were collected and stored under refrigeration before analysis. Urinary sodium and potassium concentration was analyzed by the Ion Selective Electrode [12] method and urinary creatinine was assayed by Jaffe's method without deproteinization [13] using Beckman Coulter LX-20 autoanalyzer. Sodium concentration in spot urine was compensated with creatinine, which is excreted constantly. 156 young women and 77 middle-aged women were compared with t-test. Correlations between continuous values and ordinary values were analyzed by Spearman's correlation coefficients, and Pearson's correlation analysis was used for continuous values. We used SPSS ver. 14.0 (SPSS Inc., Chicago, IL., USA) for data analysis.

Results

Descriptive data of the subjects

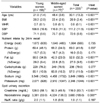
Young women were aged 21 years, and middle-aged women were aged 48 years in average. BMI for young women was 20.2 and middle-aged women 22.4. Middle-aged women were more obese than young women (χ2 = 35.0, P < 0.001). WHR is 0.7 for young women and 0.8 for middle-aged women. Middle-aged women were more obese in abdominal area (t = -7.67, P < 0.001). 12.8% of young women had abdominal obesity with WHR exceeding 0.8; while 61.0% of middle-aged women did, with significant difference (χ2 = 58.5, P < 0.001). Blood pressure was significantly higher for middle-aged women (t = -4.66 and P < 0.001 for SBP, t = -3.79 and P < 0.001 for DBP). Though we excluded hypertension from subjects, 37.2% of young women and 58.5% of middle-aged women fell into pre-hypertension.
The daily energy intake surveyed by the 24-hr recall was 1,664 kcal and no difference was shown between young women and middle-aged women. But for energy composition (% energy), young women consumed energy mainly in fats (P < 0.001) and middle-aged women consumed energy mainly in carbohydrates (P < 0.001). Young women consumed 58.0g of fats daily and middle-aged women 42.3 g. The carbohydrate and protein intakes did not show statistically significant differences. Middle-aged women consumed more sodium (P < 0.001) and potassium (P < 0.001). Middle-aged women excrete more sodium of 4,324 mg/g (Na/creatinine), that is significantly greater (P = 0.005) than young women of 3,381 mg/g, indicating that they consumed more sodium than younger women. The results from the 24-hr recall method also showed greater sodium intake for the middle-aged women, indicating the same tendency. For potassium excretion, the middle-aged women likewise showed significantly greater amount compared to young women (P < 0.001), indicating greater potassium intake by the older women. There was no significant difference in the Na/K ratio between the two groups. In summary, the sodium intake examined through the 24-hr recall method and spot urine analysis verified that the middle-aged women consumed more salt than young women (Table 1).

Correlations between healthy factors, sodium intake and excretion, and salt usage behaviors

Age, BMI, WHR, SBP and DBP were correlated mutually, and with urinary sodium excretion and dietary sodium intake. Urinary sodium excretion was correlated with age (r = 0.205, P = 0.002). Dietary sodium intake was correlated with age (r = 0.272, P < 0.001) and WHR (r = -0.185, P = 0.005). Na/K ratio of dietary intake was negatively correlated with age (r = -0.176, P = 0.007). Because age was significantly correlated with other factors, we analyzed Pearson's correlation coefficients among other factors adjusted for age. Salt Usage Questionnaire scores were also negatively correlated with age (r = -0.248, P < 0.001). But the scores were negatively correlated with BMI (r = -0.090, P < 0.001), and positively correlated with dietary sodium intake (r = 0.174, P = 0.008) and Na/K ratio (r = 0.200, P = 0.002) after elimination of age effect (Table 2).

Salt usage behavior of the subjects

Higher the score of the salt usage behavior questionnaire, it indicated preference for salty taste or frequent use of high-salt foods. When the total scores are compared, young women scored 84.8 points, showing a significantly higher salt usage compared to middle-age women with 74.7 points (P < 0.001). Young women responded presenting significantly higher preference for salty taste on questionnaire items 1 (P = 0.001), 4 (P < 0.001), and 6 (P = 0.027). On item 3 (P = 0.025), middle-aged women responded that they add salt more often. On items 11 (P < 0.001), 12 (P < 0.001), 13 (P < 0.001), 14 (P = 0.035), and 15 (P < 0.001), young women responded they consume high-salt foods more frequently; whereas the responses on items 7 (P = 0.002) and 9 (P < 0.001), showed middle-aged women consume these foods more frequently. Middle-aged women were shown to prefer traditional foods as their source of salt, while young women preferred dine-out or purchased meals and processed salty snacks instead.
Among the 15 items, the frequent consumption of kimchi, soup or pot stew, or salted vegetables is related to high sodium intake. Young women responded that they consume more salt [4,6] or soy sauce [5,6] and red pepper paste [6], and they prefer instant food [12], salted food [13], noodles with black bean sauce [14], and animal food [15] but these did not actually correlate with high salt intake.
Frequent consumption of salted vegetables (r = 0.186, P = 0.020) and salted nuts and potato chips (r = 0.242, P = 0.002) was significantly correlated with young women's high sodium intake. For middle-aged women, soy sauce on fried food (r = 0.440, P < 0.000), kimchi (r = 0.229, P = 0.045), salted vegetables (r = 0.226, P = 0.048) account for high sodium intake (Table 3).

Discussion

Obesity prevalence of subjects was lower than reported data of same age bracket of 2007 KNHANES [6], which was 12.6%. BMI of the middle-aged women was 22.4 and 16.9% of the group was obese. It was lower than BMI of 23.5 for middle-aged women (30s-50s) in the study by Kim and Chaung [14], and obesity prevalence of 22.3% for the middle-aged women (40s-50s) in the study by Kim and Oh [15]. WHR that reflects abdominal obesity of middle-aged women, which is 61.0%, is lower than that of Kim and Chaung [14], which is 79.7%. This difference can be explained by the study inclusion criteria, that we excluded hypertensive. Given equal BMI values, abdominal obesity, compared to lower body obesity, is seen to have a greater risk of leading to metabolic syndrome that includes hypertension. As stipulated in the study by Moon and Kim [16] on the causes of cardiovascular-related risk factors that attention should be paid to BMI for middle-aged men (40-64 years) and WHR for middle-aged women, Kim and Chaung [14] also reports that there are correlations between abdominal obesity and hypertension and dyslipidemia and that as such there is a need to take interest in abdominal obesity of middle-aged women. In Table 2, WHR showed a positive correlation with SBP. Because women begin menopause on average 50 years and their BMI increases in the menopausal period, so we need to emphasize the need for obese women in their 50s to focus on maintaining normal blood pressure, blood sugar and serum lipids. It is also reported that during the menopausal transition, weight and body fat begin to increase while the reduction of estrogen concentration increases the distribution of fat to body fat and the abdomen [9].
Young women' energy intake was 1,673kcal, which is greater than average energy intake of 1,560kcal for women in their 20s reported in the 2007 KNHANES [17]. Carbohydrate intake was 229 g that is similar with 2007 KNAHANES result of 245 g, and protein and fat intakes were 69.4 g and 57.9 g, greater that those of 2007 KNHANES results of 58.0 g and 40.2 g, respectively. Young women group intake energy mainly from protein and fat, and their caloric intake was higher than the national average. They consume high calories mainly from processed and fast foods. 2007 KNHANES divided age bracket into 30-49 years and 50-64 years, but middle-aged groups cover 46-52 years that no proper comparison can be shown. Middle-aged women consumed significantly more dietary sodium (P < 0.001), and excreted significantly more urinary sodium (Na/creatinine 1 g, P = 0.005). Consequently middle-aged women consumed more sodium than young women. 24-hr urinary creatinine excretions decline in advancing age due to loss of muscle, that could influence the urinary sodium concentration (Na/creatinine). But we collected spot urine, which doesn't represent daily excreted amount but account for the strength of urine. Though it is not supposed that 24-hr urinary creatinine excretions were equal between two groups, we couldn't control that factor in study design by economical issue. As for potassium, the older women consumed more, too. In the 2001 KNHANES data, average potassium intake was 2,602 mg for women with hypertension, which was significantly lower than normotensive women with 2,976 mg. That goes through with the idea of potassium as a factor of hypertension prevention [18]. However the potassium intake of middle aged women was higher than that of young women and the blood pressure of the former was also higher than that of the latter. In Table 2, significant negative correlations are shown between the urinary and dietary Na/K ratios and blood pressure, which is contrary to the existing results. In the cross-sectional study, the higher-risk groups usually choose more positive behavior concerning health. This indicates the need for a more in-depth study on the impact of potassium and sodium consumption on blood pressure.
Some questions in Salt Usage Questionnaire were correlated with dietary sodium intake (Table 3). Kim et al. [19] and Ahn et al. [20] showed no relationship between sodium intake and preference for salty taste, unlike this study. Sodium intake of Koreans exceeds the dietary recommendation, because the extensive food items and multiple cooking processes influence sodium intake. We trained the interviewers to review details on using salt and high-salt food that leads this result. Urinary Na/creatinine ratio and sodium intake were significantly higher in older group. Kim et al. [11] observed the effect of age and BMI on urinary sodium excretion and Oh et al. [21] reported that the urinary Na/creatinine ratio was high in postmenopausal women. When compared with present study results, age was verified as a factor related to urinary sodium excretion. The Na/K ratio that indicates balanced mineral intake showed negative correlation with DBP. Since this study is cross-sectional, it is difficult to conclude that blood pressure is lowered by high Na/K ratio, and it is also hard to rule out the possibility of risk group's healthier dietary choice. As people get older, they tend to get interested in health and to follow recommended dietary guidelines. Moreover, present results presents on opportunity to highlight the importance of salt intake and blood pressure for aging people. Kim et al. [11] using same questionnaire, showed that three items were significantly correlated with 24-hour's urinary sodium excretion, those were 'I usually eat salty,' 'I add salt or soy sauce on cooked dishes,' 'I add salt on food before tasting.' We couldn't see the same result in this study. Only 'I usually eat salty,' was correlated in the significance level of 0.092. Kim et al. [11]'s study population was both men and women but our subjects were women only. Moreover we used spot urine instead of 24-hr urine collection.
Analyzing 2001 KNHANES data, the top five among major sources of sodium were kimchi (baechu-kimchi and bakkimchi), radish kimchi (kkakdugi, seokbakji, dongchimi, chonggak kimchi), sea food pot stew (maeuntang), soy bean soup, and meat-based soup [22]. This five food items accounted for 52% of the individual difference of salt intake. Kimchi and radish kimchi explained 27% of the sodium intake and 35% of the individual differences of salt intake. In the present study, kimchi, soup or pot stew, and salted vegetables were significantly correlated with sodium intake and excretion (Na/creatinine). Son et al. [23] developed frequency questionnaire to measure sodium intake. It composed of four kimchi and the kind of foods, seven soups or pot stews, and two salted vegetable. Excluding ssam (meat or fish wrapped in vegetable leaf), broiled fish, and myeolchi-bokkeum (dried anchovy sautéed in seasoning), its items coincided with the items related with sodium intake in the present study. The DFQ 15 developed by Son et al. [24] in the Preliminary Survey for National Low-Salt Intake Nutrition Project, also composed of four kimchi and the kind of foods, five soups or pot stews, and one salted vegetable, and they coincided with the items chosen in this study. Ramyeon (instant noodles), broiled fish, myeolchi-bokkeum, janchi-guksu (thin noodles in soup), kal-guksu (hand-cut noodles in soup), ssam didn't show same tendency among these studies. In the present questionnaire, ramyeon expressed as 'instant food', myeolchi-bokkeum as 'food that's stir-fried, hard-broiled or pickled with soy sauce, soy bean paste or red pepper paste', and ssam and ssam sauce as 'broiled meat or fish with salt, soy sauce or red pepper sauce' and such expressions might not be adequately understood. If the more specific names, such as 'pickled cucumber' instead of 'food that's stir-fried, hard-broiled or pickled with soy sauce, soy bean paste or red pepper paste', different results might be gained. So revising the questionnaire items is recommended in the future research. Park et al. [25] reported that the questionnaire item, 'I eat soup or pot stew and noodle dishes completely without leaving any leftover liquid', significantly correlated with sodium intake. This expression is more specific than 'I eat soup or pot stew frequently'. A very specific, and deemed to be a good questionnaire item was found from Yim's study [26], practiced in the health center nutrition education for elderly women with hypertension, and that is 'I have two or more bowls of soup every day'. Ryu [27] compared the eating habits between different age groups in Gyeonggi province comprehensive medical examination nutrition counselors. Snack consumption was found to be more frequent for the younger group, while dining out was found to be significantly less frequent for the older group. Our present study also found that these items were more frequent for young women. Snacks and dine-out foods contain more salt generally, and as a result, we recommend to choose this kind of foods as less as possible.
In conclusion, middle-aged women consumed more carbohydrates and less fat than young women, while their energy intakes were not different. Sodium and potassium intake and sodium excretion were higher in middle-aged women, and their blood pressure were also higher. Middle-aged women frequently choose kimchi, soup or pot stew, or salted vegetables, and they contribute to high sodium intake. As a result, we recommend eating low-salt kimchi, less soup or pot stew, and more fresh vegetables to reduce sodium intake for healthier blood pressure. This recommendation is more important for aging women.

Figures and Tables

Table 1
Characteristics of the subjects, and their nutrition intake and spot urinary excretion
nrp-6-232-i001

BMI, Body mass index; WHR, Waist-hip ratio; SBP, Systolic blood pressure; DBP, Diastolic blood pressure

1)Average values of the subjects and standard deviation in round bracket

Table 2
Pearson's correlation coefficients between age, BMI, WHR, blood pressure, sodium intake and excretion, and Salt Usage Questionnaire Responses
nrp-6-232-i002

N = 233, r (P-value)

BMI, Body Mass Index; WHR, Waist-hip ratio; SBP, Systolic blood pressure; DBP, Diastolic blood pressure

1)Pearson's partial correlation coefficients, adjusted for age.

2)Sum of the responses for Salt Usage Questionnaire with 15 items related to salt usage behavior

Table 3
Subjects' responses for the Salt Usage Questionnaire, and its Spearman's correlation coefficient with sodium intake and excretion
nrp-6-232-i003

1)Average values of the subjects in mean ± standard deviation, and significance of difference between groups in t-test

2)Each response's Spearman's correlation coefficient with sodium intake estimated by 24hr recall method in r (P-value)

3)Each response's Spearman's correlation coefficient with sodium concentration in spot urine collection (Na/creatinine in mEq/g) in r (P-value)

aVery salty = 12, A little salty = 9, Modestly = 6, Little salty = 3, Not salty = 0

bAlways = 12, Frequently = 8, Seldom = 4, Never = 0

cMore than a tsp = 12, As much as a tsp = 9, Half a tsp = 6, Little salt = 3, No salt = 0

dAlways = 12, Sometimes = 6, Never = 0

eMore than 3 a day = 12, 1~2 a day = 9, 3~6 a week = 6, 2~8 a month = 3, Less than 1 a month = 0

fMore than 1 a day = 12, 3~6 a week = 9, 1~2 a week = 6, 2~3 a month = 3, Less than 1 a month = 0

gAnimal food = 12, Vegetable food = 0, No preference = 6

References

1. He FJ, MacGregor GA. Reducing population salt intake worldwide: from evidence to implementation. Prog Cardiovasc Dis. 2010. 52:363–382.
crossref
2. Luft FC, Weinberger MH. Heterogeneous responses to changes in dietary salt intake: the salt-sensitivity paradigm. Am J Clin Nutr. 1997. 65:612S–617S.
crossref
3. Gong M, Hübner N. Brigelius-Flohe R, Joost HG, editors. Gene variants, nutritional parameters and hypertension. Nutritional Genomics: Impact on Health and Disease. 2006. Weinheim: Wiley-VCH Verlag GmbH & Co. KGaA;327–354.
crossref
4. Polonia J, Martins L. A comprehensive review on salt and health and current experience of worldwide salt reduction programmes. J Hum Hypertens. 2009. 23:771–772.
crossref
5. Mohan S, Campbell NR. Salt and high blood pressure. Clin Sci (Lond). 2009. 117:1–11.
crossref
6. Korea Centers for Disease Control and Prevention. National Health Statistics. Report for the Fourth Korean National Health and Nutrition Examination Survey (KNHANES IV). 2008. Cheongwon: Korea Centers for Disease Control and Prevention.
7. Kim KS, Paik HY. A comparative study on optimum gustation of salt and sodium intake in young and middle-aged Korean women. Korean J Nutr. 1992. 25:32–41.
8. Kim HM, Park J, Ryu SY, Kim J. The effect of menopause on the metabolic syndrome among Korean women: the Korean National Health and Nutrition Examination Survey, 2001. Diabetes Care. 2007. 30:701–706.
9. Lee SW, Cho HH, Kim MR, Kwon DJ, Kim EJ, You YO, Kim JH. The relationship between serum leptin level and metabolic syndrome in postmenopausal women. Korean J Obstet Gynecol. 2010. 53:254–263.
crossref
10. Lee JY. A study of salt consumption and related factors among adult females. Korean J Food Nutr. 2001. 14:430–440.
11. Kim HJ, Paik HY, Lee SY, Shim JE, Kim YS. Salt usage behaviors are related to urinary sodium excretion in normotensive Korean adults. Asia Pac J Clin Nutr. 2007. 16:122–128.
12. Murphy SP, Kaiser LL, Townsend MS, Allen LH. Evaluation of validity of items for a food behavior checklist. J Am Diet Assoc. 2001. 101:751–761.
crossref
13. Howitz W. Official Methods of Analysis of AOAC INTERNATIONAL. Chapter 4. 2000. Gaithersburg: AOAC international.
14. Kim JA, Chaung SK. Weight control and cardiovascular risk in middle-aged women. Korean J Rehabil Nurs. 2004. 7:33–47.
15. Kim HS, Oh JA. Comparison of the metabolic syndrome risk factor prevalence forty and fifty something women. J Korean Acad Nurs. 2007. 37:453–458.
crossref
16. Moon HK, Kim EG. Comparing validity of using body mass index, waist to hip ratio, and waist circumference to cardiovascular risk factors of middle aged Koreans. J Korean Diet Assoc. 2005. 11:365–374.
17. Shim YJ, Paik HY. Reanalysis of 2007 Korean National Health and Nutrition Examination Survey (2007 KNHANES) results by CAN-Pro 3.0 nutrient database. Korean J Nutr. 2009. 42:577–595.
crossref
18. Moon HK, Park JH. Comparative analysis and evaluation of dietary intake between with and without hypertension using 2001 Korea National Health and Nutrition Examination Survey (KNHANES). Korean J Nutr. 2007. 40:347–361.
19. Kim JY, Kang YR, Lee MY, Paik HY. Sodium intake and preference for salty taste in elementary school children residing in rural and urban areas of Korea. Korean J Nutr. 1990. 23:248–256.
20. Ahn EJ, Noh HY, Chung J, Paik HY. The effect of zinc status on salty taste acuity, salty taste preference, sodium intake and blood pressure in Korean young adults. Korean J Nutr. 2010. 43:132–140.
crossref
21. Oh KW, Yun EJ, Oh ES, Im JA, Lee WY, Baek KH, Kang MI, Park CY, Choi MK, Yoo HJ, Park SW. The relationship between urinary sodium excretion and bone mineral metabolism of climacteric women in Korea. Korean J Med. 2003. 65:436–442.
22. Kim MK, Yun YM, Kim Y. Developing dish-based food frequency questionnaire for the epidemiology study of hypertension among Korean. Korean J Community Nutr. 2008. 13:701–712.
23. Son SM, Huh GY, Lee HS. Development and evaluation of validity of dish frequency questionnaire (DFQ) and Short DFQ using Na index for estimation of habitual sodium intake. Korean J Community Nutr. 2005. 10:677–692.
24. Son SM, Park YS, Lim WJ, Kim SB, Jeong YS. Development and evaluation of validity of short dish frequency questionnaire (DFQ) for estimation of habitual sodium intake for Korean adults. Korean J Community Nutr. 2007. 12:838–853.
25. Park YS, Son SM, Lim WJ, Kim SB, Chung YS. Comparison of dietary behaviors related to sodium intake by gender and age. Korean J Community Nutr. 2008. 13:1–12.
26. Yim KS. The effects of a nutrition education program for hypertensive female elderly at the public health center. Korean J Community Nutr. 2008. 13:640–652.
27. Ryu HS. A study on the dietary habits of people in Gyeonggi area by age groups - based on the nutrition counseling data of medical health examination -. Korean J Food Nutr. 2006. 19:410–415.
TOOLS
Similar articles