

 PDF
PDF ePub
ePub Citation
 Print
Print


Introduction
Obesity is a state of excess accumulation of fat tissues and occurs through an increase in the number or size of adipocytes [1]. The primary causes of obesity include overconsumption of high-fat food, lack of exercise, and excess stress [2]. As obesity poses as a risk factor for other diseases such as hypertension, diabetes, and hyperlipidemia, interests in preventing obesity have arisen. Current studies have included functional properties of plant substances and food ingredients for preventing obesity, and calorie restriction or calorie modification for weight loss [3-5].
α-Lipoic acid (α-LA), usually found in small amounts in meats and vegetables, has potent antioxidant capacity [6,7]. Previous studies have shown that α-lipoic acid and its reduced form dihydrolipoic acid have an amphiphilic property that allows them to easily cross the blood brain barrier and cell membranes and helps to activate other antioxidants such as vitamin C, vitamin E, coenzyme Q10, and ubiquinone [8]. The antioxidant activity of α-LA has been demonstrated to treat diabetic neuropathy [9], arthrosclerosis [10], liver-related pathologies [11], and hypertriglyceridemia [12] as well as having anti-aging activity [13].
Lipoic acid supplementation has the potential in improving dyslipidemia and hypeglycemia in diabetes, which is probably through the hypoglycemic and hypolipidemic effects and its antioxidant properties [10,12]. α-Lipoic acid also increased whole-body energy expenditure by suppressing hypothalamic AMP-activated protein kinase. Lee et al. [14] reported that ingestion of α-LA improves insulin resistance in muscle cells. α-LA decreases hypothalamic adenosine5'-monophosphate activated protein (AMPK) activity and suppression of AMPK activity is necessary for weight loss [15]. However, studies on the effects of α-LA on weight and lipid profile in obese states are limited. Therefore, in this study, rats were fed with high fat diet for 4 weeks and α-LA was supplemented for an additional 4 weeks, and then the effects of weight and lipid profiles in rats were determined.
Materials and Methods
Animals and diet
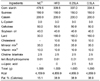
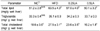
Four-week-old male Sprague-Dawley (Daehan Biolink, Korea) rats were fed with a pelleted diet (Samyang, Korea) for 3 days and divided into two groups by randomized block design according to body weight. Ten rats were on normal control diet (NC) and 30 rats received a high-fat diet (HFD). All rats were provided with food and water ad libitum and maintained on each diet for 4 weeks. The control group received the AIN-93G diet [16], and the HFD group received the HFD containing 20% fat and 1% cholesterol (Table 1). After 4 weeks, rats on the HFD were divided into three groups of 10 by randomized block design. Ten received the HFD, 10 received the HFD with 0.25% α-LA (0.25LA), and the remaining 10 received the HFD with 0.5% α-LA (0.5LA). Each diet was replaced every 2 weeks to prevent rancidity.
Rats were maintained individually in stainless steel cages in conditioned rooms (24 ± 1℃, 12 hour light/dark cycle). The amount of food eaten and weight were measured twice weekly. The amount of food eaten was measured on a consistent time frame to calculate the food efficiency ratio. All animal studies were treated in accordance with the Dankook University ethics committee's guidelines for the care and use of laboratory animals.
Plasma collection and organ preparation
After 4 weeks of diet treatments, the rats were fasted for 12 hours. The rats were then anesthetized with ethyl ether and dissected. After blood was collected from the heart with a 10 mL syringe, whole blood was centrifuged (Beckman J2-21, Fullerton, CA, USA) at 3,000 rpm (4℃) for 15 minutes to collect the plasma, which was stored at -70℃ for analysis. After scarification of the rats, the liver, epididymal fat pad, intestinal fat pad, kidney, thymus, and spleen were removed and rinsed with 0.9% NaCl solution. The organs were then dried with filter paper, and dry weights were measured. Liver and fat tissues were stored at -70℃ for analysis.
Plasma lipid concentrations
Total lipids and free fatty acids
Total lipid concentration was determined through a sulfophospho vanillin reaction based method as described by Frings et al. [17]. Absorbance was measured at 540 nm with a spectrophotometer after supplementing the vanillin and phosphoric acid with heated lipid and sulfuric acid. Free fatty acid concentration was measured with a free fatty acid quantification kit (Wako Pure Chemical Industries, Osaka, Japan).
Total cholesterol (TC) and triglycerides
TC concentration was measured with an enzyme cholesterol assay kit (Bioassay Systems, Hayward, CA, USA). Cholesterol hydrolase was used to separate cholesterol and fatty acid from the samples. Absorbance was measured at 340 nm with a spectrophotometer [18]. Blood triglycerides were measured with a triglyceride assay kit (Wako Pure Chemical Industries, Osaka, Japan).
High density lipoprotein (HDL) cholesterol, low-density lipoprotein (LDL) cholesterol, THR, and AI index
Plasma HDL cholesterol level was measured with an Enzychrom HDL assay kit (BioAssay System, Hayward, CA, USA). LDL cholesterol levels were calculated with Friedewald's equation (LDL cholesterol = total cholesterol - HDL cholesterol - (triglycerides/5) [19]. The HDL cholesterol/total cholesterol ratio (HTR) was obtained as a ratio of total cholesterol levels to HDL-cholesterol levels. The atherogenic index (AI) was calculated with Haglund's method: AI = (total cholesterol - HDL-cholesterol)/HDL-cholesterol [20].
Liver lipid concentration
Total lipids in the liver were extracted using the method described by Folch et al. [21] and total lipids, total cholesterol, and triglycerides in liver were measured with the same methods used for blood lipid determination.
Statistical analysis
The statistical analysis was performed using the Statistical Analysis System (SAS, Institute, Cary, NC, USA). Data are expressed as mean with standard error and differences between groups were evaluated with Duncan's multiple range test at α = 0.05 after an analysis of variance.
Results
Change in weight, food intake, and food efficiency ratio
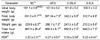
Changes in weight and food intake after supplementation with 0.25LA and 0.5LA are shown in Table 2. In the initial stages of the experiment, rats in the HFD (101.2 ± 0.2 g) and NC groups (101.1 ± 0.6 g) showed no differences in weight. Significant differences in weight gain were observed between the HFD group and the NC group (P < 0.05) after 4 weeks of the HFD. During the period of α-lipoic acid administration, weight gain in the HFD group was the greatest (266.7 ± 7.5 g) and this increase was a 116% rise compared to that in the NC group (229.9 ± 6.3 g). Weight gains in rats that received 0.25LA and 0.5LA decreased significantly by 10% and 21%, respectively, compared to that in the HFD group (P < 0.05).
The HFD group (966.5 ± 9.1 g) consumed significantly less foods than that in the NC group (997.0 ± 26.4 g) (P < 0.05). Food intakes in the 0.25LA group (952.8 ± 9.1 g) and 0.5 LA group (949.0 ± 7.3 g) were significantly less compared to those in NC group by 4.8% and 5%, respectively (P < 0.05). The HFD group (0.27 ± 0.01) scored the highest food efficiency ratio followed by the 0.25LA group (0.27 ± 0.04), the NC group (0.23 ± 0.01), and the 0.5LA group (0.22 ± 0.01) (P < 0.05).
Organ and adipose tissue weights
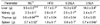
Liver weight was significantly heavier in the HFD group (17.1 ± 0.7 g) followed by the 0.25LA group (15.3 ± 0.6 g) and the 0.5LA group (14.0 ± 0.4 g), which decreased by 11% and 19% respectively (P < 0.05) (Table 3). Kidney weight was significantly heavier in the HFD group (2.8 ± 0.1 g) compared to that in the NC group (2.3 ± 0.1 g) (P < 0.05) and decreased significantly in order of the 0.25LA group (2.6 ± 0.1 g) followed by the 0.5LA group (2.4 ± 0.1 g) (P < 0.05).
No significant difference in kidney weight was observed between the NC group and the 0.5LA group. Thymus weight was not significantly different among the HFD group. Spleen weight increased significantly in the HFD group (1.0 ± 0.1 g) compared to that in the NC group (0.7 ± 0.02 g) (P < 0.05), whereas it decreased significantly in the 0.25LA group (0.9 ± 0.1 g) and 0.5LA group (0.7 ± 0.04 g) (P < 0.05).
Weights of epididyimal and intestinal fat are shown in Table 4. Epididymal fat weight was significantly heavier in the HFD group (3.5 ± 0.1 g) than that in the NC group (3.0 ± 0.1 g) (P < 0.05). Epididymal fat weight decreased significantly by 9% and 18% in the 0.25LA group (3.2 ± 0.1 g) and 0.5LA group (2.9 ± 0.1g) respectively. The Intestinal fat weight was also the heaviest in the HFD group. Compared to the weight in the HFD group, intestinal fat weights in the NC, 0.25LA, and 0.5LA groups decreased significantly (P < 0.05).
Plasma lipid concentration
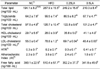
Plasma lipid composition is shown in Table 5. Total lipids in the HFD group (267.9 ± 15.5 mg/100 mL) increased significantly by 40% compared to those in the control group (194.1 ± 8.2 mg/100 mL) (P < 0.05). Although total lipids in the 0.25LA group (249.2 ± 15.8 mg/100 mL) decreased compared to those in the HFD group, it was not significant. However, total lipids in the 0.5LA group (210.3 ± 8.4 mg/100 mL) decreased significantly compared to those in the HFD group (P < 0.05).
Triglyceride content in the HDF group (99.5 ± 7.4 mg/100 mL) increased by 36% compared to that in the NC group (64.2 ± 7.8 mg/100 mL), whereas it decreased significantly in both the 0.25L group (86.5 ± 8.2 mg/100 mL) (P < 0.05) and 0.5LA group (67.7 ± 4.7 mg/100 mL) (P < 0.05).
Total plasma cholesterol levels increased significant in the HFD group (126.7 ± 10.4 mg/100 mL) compared to those in the NC group (97.5 ± 4.9 mg/100 mL) (P < 0.05). Levels in the 0.25LA group were not significantly different from those in the HFD group, whereas the 0.5 LA group (101.0 ± 4.8 mg/100 mL) showed a significant decrease in total cholesterol levels compared to those in the HFD group (122.8 ± 9.6 mg/100 mL) (P < 0.05). Significant differences were observed for HDL cholesterol levels among the control (29.7 mg/100 mL) and 0.5 LA group (41.1 mg/100 mL) (P < 0.05).
LDL cholesterol levels were highest in the HFD group, whereas the α-LA supplemented groups showed a significant decrease in LDL cholesterol levels in a dose-dependent manner (P < 0.05). LDL cholesterol levels in the 0.5LA group (46.4 mg/100 mL) were significantly lower than those in the NC group (55.0 mg/100 mL) (P < 0.05).
The HTR increased significantly in the 0.25LA and 0.5LA groups compared to that in the HFD group (P < 0.05). The AI was highest in the HFD group and decreased significantly in the 0.25LA and 0.5 LA groups (P < 0.05). The AI in the 0.5 LA group was significantly lower by 35% compared to that in the NC group. The free fatty acid concentration in the HFD group was 31% higher compared to that in the NC group. Free fatty acid concentrations in the 0.25LA and 0.5LA groups were decreased significantly by 69% and 67%, respectively, compared to those in the HFD group (P < 0.05).
Liver lipid composition
Liver lipid compositions are shown in Table 6. Total lipids in the HFD group (63.5 ± 4.3 mg/g wet liver) were significantly higher than those in the NC group (51.8 ± 2.8 mg/g wet liver) (P < 0.05). Total lipids in the 0.25LA (57.0 ± 4.0 mg/g wet liver) and 0.5LA groups (50.1 ± 3.2 mg/g wet liver) were decreased significantly compared to those in the HFD group (P < 0.05). The increased level of α-LA in the diet resulted in a decrease in triglyceride levels in the 0.25LA (34.2 ± 0.3 mg/g wet liver) and 0.5LA groups (33.7 ± 0.3 mg/g wet liver). However, the decrease was not significant.
Liver cholesterol levels in the HFD group (27.5 ± 3.1 mg/g wet liver) were significantly higher than those in the NC group (18.6 ± 3.6 mg/g wet liver). Cholesterol levels also decreased significantly in the 0.25LA (23.7 ± 3.5 mg/g wet liver) and 0.5LA groups (16.2 ± 1.8 mg/g wet liver) compared to those in the HFD group. The 0.5LA group also had significantly lower cholesterol levels than those in the NC group (P < 0.05).
Discussion
This research aimed to determine the effects of α-LA on weight and lipid profiles in obese rats. The results demonstrated that rats on the α-LA diets had significantly decreased weight gain compared to rats fed the HFD. Zhang et al. [22] reported that α-LA inhibits weight gain after feeding with 0.2% LA and either a 15% HFD or a 4% fat diet. Shen et al. [23] reported that mice fed with 1.0% lipoic acid diet had a significant weight loss of 3.3 g while control group (no lipoic acid supplemented) gained weight about 3.6 g which suggesting weight loss was related to decreased food consumption. Lee et al. [14] also demonstrated that α-LA inhibits hypothalamic AMPK activity and causes a significant decrease in weight by stimulating fatty acid oxidation, inhibiting the accumulation of adipocytes, and activating AMPK activity in muscle tissues to increase the influx of glucose and fatty acid β-oxidation into muscle cells.
Weights of the epididymal fat pad and intestinal adipose tissue in the 0.5LA group were decreased significantly compared to those in the HFD group (P < 0.05). According to Cheng et al. [24], gonadal fat weights in mice were decreased significantly in a dose-dependent manner after supplementation with 0%, 0.5%, or 1% of α-LA in the diet for 3 weeks. These studies and our results support that ingestion of α-LA is highly effective for reducing adipose tissue weights. Kim et al.'s study [15] reported that weight loss effect of α-LA was not due to systemic toxicity or to an illness due to α-LA intake which were proved by conditioned taste aversion (CTA) test and plasma corticosterone concentrations, an indicator of stress.
Another finding of this study is that α-LA improved lipid profiles in both blood and liver. Teachey et al. [25] also reported that blood triglyceride levels and free fatty acid levels are reduced in Zucker rats fed α-LA. Yang et al. [26] indicated that plasma total cholesterol, triglycerides, and LDL-cholesterol levels in an experimental group decreased significantly compared to those in a control group after feeding a 21.5% fat HFD with 0.1% LA to C57BL/6 mice for 6 weeks. Furthermore, Yang et al. [26] stated that α-LA intake inhibits liver cholesterol synthesis and reduces liver lipid accumulation by stimulating β-oxidation. Kumar et al. [27] demonstrated that EPA-LA combines hypocholesterolemic property of EPA with Lipoic acid , which can efficiently reduce the increased concentration of lipids to control levels. The authors have been suggested that lipoic acid is a powerful antioxidant and thus protecting the vascular system by reducing plasma lipids and oxidative damage of reactive oxygen species [27,28].
In conclusion, these studies demonstrate that intake of α-LA inhibits weight gain and improves blood and liver lipid profiles in diet-induced obese rats. Furthermore, these findings are predicted to reduce the risks of diseases caused by abnormalities in lipid profile.

 XML Download