

 PDF
PDF ePub
ePub Citation
 Print
Print


Introduction
The adolescent period is characterized by the onset of puberty and a fast progression from childhood to adulthood, accompanied by anthropometric, psychological, physiological, and social changes. Growth during this period is rapid and results in up to a 45% increase in skeletal growth, 15-25% in height [1] and 37% in total bone mass [2]. Therefore, the nutrient requirements during this period are higher than at any other time throughout life, and dietary factors also play an important role in physical growth, including body mass index (BMI) and bone mass [3].
Various studies have been conducted on the effects of nutrition on physical growth during adolescence. Adolescent obesity has become a serious problem in recent years; thus, there has been an increase in the number of studies on the association between diet and body weight or fat mass. Energy-dense foods, such as sugar-sweetened beverages [4-6] and fast foods [7-9], are a risk factor for weight gain by increasing energy intake. In contrast, intake of dietary calcium and vitamin D [10], milk and dairy products [11,12], and fruits and vegetables [13] have a positive effect on bone mass in adolescents. Given that bone mineral accretion during childhood is associated with increased risk for fracture later in life [14] and the prevalence of osteoporosis in Korean women > 50 years is more than 38.7% [15], identifying dietary determinants of change in bone mineral content (BMC) during this age period is of particular importance.
However, most studies on adolescent growth only measured a single nutrient, food, or food group and were conducted as cross-sectional studies. Although the traditional approach of using only a single nutrient or food is meaningful, it has brought several limitations because of the complexity of the diet and the high inter-correlation of each nutrient.
To overcome these limitations, the dietary pattern approach has been used in nutritional epidemiological studies [16,17]. Tucker et al. [18] examined the association between dietary pattern and bone mineral density (BMD) in the Framingham Osteoporosis Study. Newby et al. [19,20] also investigate the effect of dietary pattern on body mass index (BMI) and waist circumference in adults. Recently, Johnson et al. [21] reported that an energy-dense, low-fiber, high-fat dietary pattern is associated with fat mass in childhood, and Song et al. [22] reported that a western dietary pattern is linked to an increased risk of being overweight (85-95 percentile of BMI) among Korean boys. However, to date, only a few studies have been conducted on the association between dietary pattern and physical growth among adolescents over time.
In 2004, Hoffmann et al. [23] introduced a new approach to analyze dietary patterns termed the reduced rank regression (RRR) method. The RRR method requires a set of continuous response variables; thus, it extracts dietary patterns that maximally explain the variation in response variables. It is a combined method that uses both existing knowledge and exploratory techniques when compared to existing dietary pattern techniques, such as factor and cluster analysis. Several studies have been reported using the RRR technique for the association between dietary patterns and body composition, including body weight, fat mass or bone mass [21,24,25] or chronic diseases, such as obesity [24,26], diabetes [27,28], and cardiovascular disease [23,29,30].
In this study, we set the physical growth variables including BMI, body fat, BMD, and BMC as response variables for 2 years to identify dietary patterns using the RRR dietary pattern approach, and explored the characteristics of patterns identified that affect physical growth among Korean girls.
Materials and Methods
Study design and subjects
Our participants were school girls aged 9-11 years. We contacted an elementary school in Seoul, Korea in May 2003. A baseline survey was conducted with an anthropometric assessment including bone measurements and dietary assessments. Two follow-up surveys were conducted at almost 1-year intervals in April 2004 and February 2005. Height, weight, body fat, and bone mass were measured at baseline and at final surveys and a 3-day dietary intake was collected for each year for the dietary assessment. At baseline, 302 girls aged 9-11 years were recruited. Subjects who had not completed ≥ 8-days dietary data due to transfer to another school and others were excluded (n = 82). An additional 22 subjects were excluded because they did not participate in the baseline or final anthropometric measurements. Therefore, the subjects who had anthropometric measurements at the baseline and final time-points as well as at least 8-days of dietary intake were included. The final sample consisted of 198 girls.
The present study was conducted according to the guidelines laid down in the Declaration of Helsinki, and all procedures involving human subjects were approved by Institutional Review Board of the Graduate School of Public Health, Seoul National University which reviewed the protocol and the consent forms. Written informed consent was obtained from all participants and their parents.
Anthropometric assessment
Anthropometric characteristics such as height, weight, body fat mass, lean body mass, mineral mass, and bone mass were measured at the baseline and final surveys by trained staff. Height was measured using an anthropometer and body weight, lean mass, fat mass, and mineral mass were measured using bioelectrical impedance analysis by Inbody 3.0 (Biospace Co. Ltd, Seoul, Korea). BMD and BMC were measured at the left calcaneus using a dual-energy X-ray absorptiometry and a peripheral instantaneous X-ray imager (Lunar Radiation Corp, Madison, WI, USA). The change in BMI, percentage body fat, BMD, and BMC were calculated by subtracting the baseline values from the final values, and these values were then used for analyses.
Dietary assessment
Dietary data were obtained as a combined method with one 24-hour recall and a 2-day dietary record. At the first visit, all subjects were asked about what they ate the previous day using the 24-hour recall method and were taught how to record their dietary intake during a face-to face interview. The subjects recorded the amount of all food, beverages, and supplements they consumed and were instructed to keep one weekday and one weekend record. Thus, a 3-day intake record including two weekdays and one weekend day were collected for each survey year.
To help improve the accuracy of quantifying the amount of food consumed, 90% scaled pictures of a cup and rice and soup bowl were provided for the subjects. The picture scale was re-calculated after the data were collected. The dietary records were checked by trained staff for completeness of information. The school lunch menu and recipes were collected ahead of time and provided for subjects so that they could record only the amount of each food item eaten. Dietary data were calculated as an intake of energy and nutrients using the database of the Korean Nutrition Society by DS24 program [31].
Because we conducted multiple 3-day records, a different number of days per subject was obtained. The dietary data from the different days could affect actual dietary intake. Thus, 8-days out of all days were randomly selected through the SURVEYSELECT procedure using SAS 9.1 (SAS Institute, Cary, NC, USA). Prior to the dietary pattern analysis, 906 food items were classified into 22 food groups using Korean food composition tables with some modifications based on a previous study [32]. The grain and products group was divided into four subgroups: rice, eastern grains, western grains, and cookies and cakes, because the intake of this group is high in the Korea population. The intake of kimchi (a traditional fermented cabbage dish) is also high, so the kimchi group was separated from the vegetable group. The fruit group was divided into a fruit and fruit juice group, because fruit juice contains added sugar.
Sexual maturation
Pubertal development is accompanied by physical growth in girls. Sexual maturation was measured using Tanner staging [33] based on secondary sexual characteristics including the development of breasts and pubic hair at baseline. Additionally, age at menarche and the date of menarche were asked every year. Menstruation was used to measure sexual maturation. Only 4.2% of participants had begun menstruation at baseline and almost 50% of participants had begun to menstruate at the end of the study. The menstrual period was calculated as time (month) from the date of menarche to the end point of this study. There were 15 missing data for Tanner stage at baseline and 29 missing data for menarche data so a sub-analysis was conducted and sexual maturation was used as a covariate.
Statistical analysis
All data analyses were conducted using SAS 9.1 (SAS Institute). The difference in body and bone mass measurements between the baseline and the final surveys was tested using the paired t-test.
Dietary patterns were derived using the RRR technique [23], which was conducted through the partial least squares procedure. Unlike factor analysis or cluster analysis that explains only the variation in food intake, RRR analysis identifies dietary patterns that explain not only the variation in food group intake, but also variations in health outcomes such as anthropometric measures [25].
Changes in BMI, percent body fat, BMD, and BMC were set as response variables and the intakes of 22 food groups were used as the predictors to determine the patterns affecting adolescent physical growth. Based on the association between diet and physical growth during adolescence [4-13], it was assumed that RRR would extract dietary patterns related to changes in adolescent physical status including body and bone mass.
The number of extractable dietary patterns identified through the RRR analysis was determined by the number of response variables, so four dietary patterns could be extracted in this analysis. However, the first two dietary patterns explained more variation (14.4%) than the following two patterns, so these two patterns were kept for further analysis. Food or food groups with an absolute factor loading > 0.10 were presented as being characteristic of dietary patterns. A dietary pattern score of each subject was calculated for each pattern extracted by RRR. Each subject's dietary pattern scores for each pattern were entered in the subsequent analysis.
An analysis of variance and generalized linear model were used to describe mean differences by dietary pattern score quartiles in the baseline anthropometric characteristics and nutrient intakes. We examined the associations between two dietary patterns identified by the RRR procedure and the change in body and bone growth (ΔBMI, Δbody fat, ΔBMC, ΔBMD). Confounding variables were age, bone and body measurement (BMI, body fat, BMC, and BMD) at baseline, sexual maturation, and energy intake during the study period. Body and bone measurements at baseline were included in all models, so we could evaluate the influence of physical growth during the study period separately from absolute body and bone mass. Tanner stage at baseline or menstrual period was used for the sexual maturation, sub-analysis of each model, as they had missing data. Energy intake was included in the models as it is related to total food intake. However, it did not affect the results, so energy intake was not included in the final models.
Results
General characteristics and dietary patterns
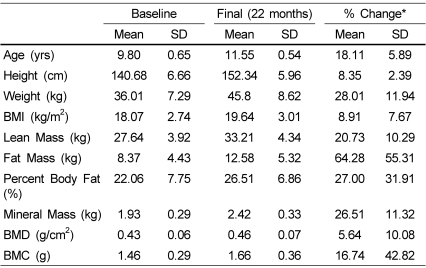
Changes in anthropometric values during the study period are presented in Table 1. All anthropometric values increased significantly during the 22 months (P < 0.001). Fat mass had the highest increase at 64.3%. Body fat and weight also increased more than that of the other measures.
Two distinctive dietary patterns were extracted (Table 2). Dietary pattern 1 explained 8.9% of the variation in responses. Both of the dietary patterns showed the largest percentage of change in BMC. Patterns 1 and 2 explained 24.3% and 30.5%, respectively, of variation in the change in BMC.
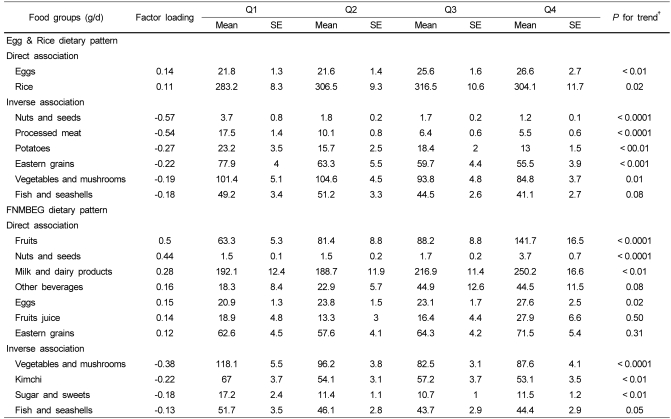
Factor loadings and intake of key foods according to quartiles of dietary pattern scores are presented in Table 3. Dietary pattern 1 was characterized by high intakes of eggs and rice, but low intakes of nuts and seeds, processed meats, potatoes, and eastern grains. Therefore, dietary pattern 1 was named the "Egg and Rice" dietary pattern. In contrast, dietary pattern 2 was characterized by high intakes of fruits, nuts, milk and dairy products, beverages, eggs, and grains, and low intakes of vegetables, mushrooms, and kimchi, so it was named the "Fruit, Nut, Milk, Beverage, Egg, Grain" (FNMBEG) dietary pattern.
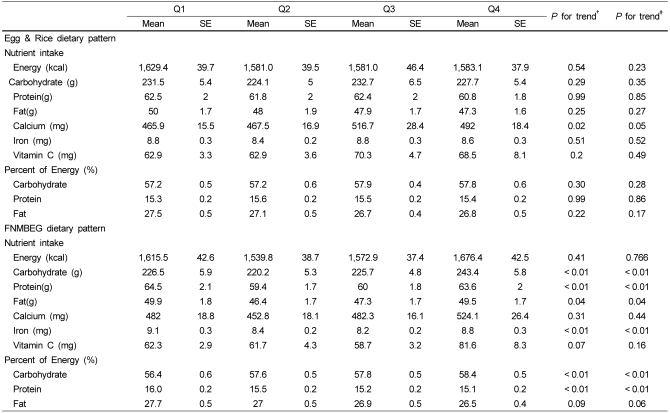
Mean daily intake over the study period is presented in Table 4, and all of the nutrient values were adjusted for age, BMI, body fat, BMC, and BMD at baseline and for energy intake. In "Egg and Rice" dietary pattern, energy intake and percentage of energy from carbohydrate, protein, and fat did not differ by quartiles, whereas, energy intake and percentage of energy from carbohydrate, protein, and fat significantly differed by quartiles in the FNMBEG dietary pattern.
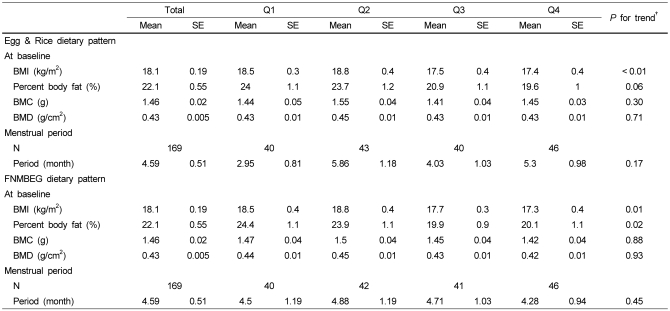
Baseline characteristics across quartiles of dietary pattern scores are shown in Table 5. The age at baseline did not differ by quartiles of dietary pattern score, but BMI and body fat at baseline differed. BMI and body fat at baseline of the highest quartile were significantly lower than those of the lowest quartile for both dietary patterns. No significant difference was observed in menstrual period over the quartiles of dietary pattern scores (Table 5) after adjusting for age, body, and bone mass at baseline. Furthermore, only 4.2% of participants had begun menstruation at baseline, whereas almost 50% had begun to menstruate at the end of the study (data not shown).
Dietary patterns and change in bone and body mass
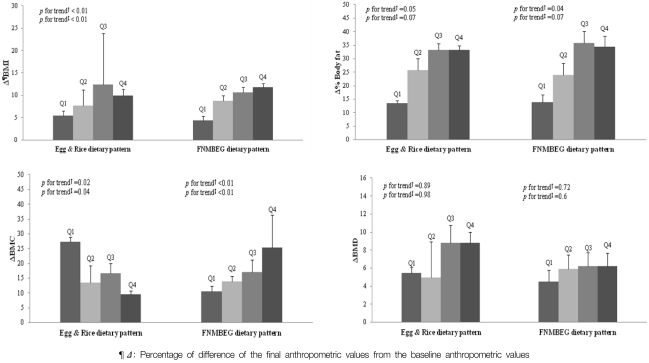
Changes in bone and body mass over the 22 months across quartiles of dietary patterns are presented in Fig. 1. All models were adjusted for age, BMI, percent body fat, BMC, and BMC at baseline. In additional sub-analyses (n = 184), the models were run for all confounding factors including Tanner stage at baseline. These two dietary patterns showed a similar positive change in BMI and percentage of body fat, so the higher each dietary pattern score was, the bigger the change in BMI and the percentage of body fat were. However, the change in BMC had a different trend for the two dietary patterns. Subjects who had the higher score on the "Egg and Rice" dietary pattern had less of an increase in BMC (P for trend = 0.04), whereas subjects who had the higher score on the FMBEG dietary pattern had a greater increase in BMC (P for trend < 0.01) over the 22 months after adjusting for age, body and bone mass, and Tanner stage at baseline.
Discussion
We found that a well-balanced diet contributes to positive change in BMC among Korean school girls aged 9-11 years. Korean meals are composed of rice, soup, and a number of side dishes. Girls who had a high score on the "Egg and Rice" pattern tended to have low preference for side dishes, which contains a wide variety of foods, and consumed only a few food items, mainly rice and eggs. Although these girls developed body fat during the study period and had higher BMIs than those at the baseline, the change in BMC was lower compared to those with a low score on the "Egg and Rice" pattern. However, the FNMBEG pattern, characterized by a high intakes of fruits, nuts, and seeds, milk and dairy products, beverages, eggs, and grains, was associated with positive change in BMC as well as body fat and BMI. In summary, our results suggest that patterns related to physical growth contribute to increase BMI and body fat, but that a well-balanced diet is important for bone mineral accretion during childhood.
Bone mineral accretion during preadolescence and adolescence is critical to physical growth and development. Achievement of peak bone mass in early life prevents late-life fragility fractures [34]. Several epidemiological studies suggest that bone mineral accretion or overall growth in childhood may be crucial for bone density and structural strength of bone in adults [35,36] and associated with a fracture risk later in life [14]. Several studies have reported the association between BMD and dietary pattern although most studies focused on adults. For example, Tucker et al. [18] found that a fruit, vegetable, and cereal pattern was associated with greater BMD in an older male group in the Framingham Osteoporosis Study; Okubo et al. [37] found that a "healthy" pattern is positively associated with BMD, but that a "western" pattern is inversely associated with BMD in premenopausal Japanese women; and Kontogianni et al. [38] found that the Mediterranean dietary pattern has a significantly positive association with lumbar spine BMD and total body BMC in Greek middle aged women. Furthermore, Lin et al. [39] reported that the DASH diet is associated with bone turnover and attributed it to improving bone mineral status. These studies suggest that a dietary pattern with high intake of fruits, vegetables, fish, and nuts and seeds is favorable for bone mass. We also found that fruits, nuts, and seeds were favorable for body mass as well as BMC. However, vegetables and fish were negatively associated with the two patterns, which could be explained by the difference in the age groups. Our subjects were school girls ranging from 9-11 years old, and their preference for vegetables and fish was quite a low. The mean intake of vegetables, fish and seafood in our subjects was 96.2 g and 46.5 g per day, respectively, whereas the mean intake of these food groups in the Korean population is 291.4 g and 50.4 g, respectively [15].
Few studies have been conducted about dietary patterns in children and adolescents. For example, Johnson et al. [21] reported that a "energy-dense, low-fiber, high fat" dietary pattern is associated with obesity in childhood; Song et al. [22] reported that the "western" pattern is associated with risk of overweight in boys; and McNaughton et al. [40] reported that a "fruit, salad, cereal, fish" pattern is inversely associated with diastolic blood pressure. However, this study is the first to investigate the association between dietary patterns and the change in physical growth among young girls.
Although little information is available on the effect of dietary patterns on bone mass or physical growth among children and adolescents, several dietary factors or single nutrients have been reported to have a positive association with bone mass, such as milk and dairy products [12,41]. Fruits and vegetables also have a beneficial effect on bone health among young girls aged 8-13 years [13,42], and vitamin C intake is positively associated with BMD among children and adolescents aged 8-17 years [43], both of which agree with our study.
We found that BMI and body fat at baseline in the highest quartile of the dietary pattern score were lower than those in the lowest quartile among both dietary patterns. In other words, girls who had a lower BMI and body fat percentage at baseline showed a greater change in BMI and body fat percentage during the study period. We also found an increase in BMC over the study period, but did not find an increase in BMD. According to Schonau et al. [44], biological changes during growth periods lead to an increase in bone mass rather than in bone density. This explains our result that BMC increased more than BMD.
Energy intake ranged from 1,580 to 1,680 kcal and the percentage of energy from carbohydrate, protein, and fat were 56-58%, 15-16%, 26-28%, respectively. Although energy intake was slightly higher than 1,499.5 kcal in girls aged 6-11 from the fourth Korean National Health and Nutrition Examination Survey [15], the percentage of energy from fat was slightly higher than 20.6%, and other nutrients, such as calcium, iron, and vitamin C were also similar or slightly lower, so these values were comparable. Additionally, energy intake and percent of energy in this study were quite narrow, which was probably due to usual intake from multiple days of recall or subject homogeneity. Although the percent of energy from carbohydrate, protein, and fat were significantly different by quartiles of dietary pattern scores for the FNMBEG dietary pattern, food characteristics in the FNMBEG dietary pattern were more favorable for physical growth.
The issue of pubertal development is important during adolescent physical growth. During sexual maturation, dramatic hormonal changes and rapid body growth occur, bringing about marked changes in body composition [45]. In particular, estrogens have been reported to play a major role in bone strength [46]. Several studies about the association between sexual maturation and body growth or dietary pattern have been reported [47]. Thus, our study also examined whether sexual maturation affected the change in body composition using a questionnaire about age at menarche and menstrual period at the end of the study. van Lenthe et al. [48] reported a positive association between BMI or body fat percentage and age at menarche among girls. However, in this study, the menstrual period was not affected by the dietary pattern scores for either dietary pattern. Because most subjects had not begun menstruation at baseline and only half of the subjects had started menstruating by the end of the survey, we assumed that sexual maturation did not play a role in physical growth.
This study had several strengths. First, we examined the change in body mass and bone mass over almost a 2-year time period to predict physical growth among young girls. In this age group, individual variation was observed on the physical growth charts so that changes could provide accurate information. Second, we used 8-days of dietary data over 2 years to represent actual energy intake, whereas many other studies used short-term dietary intake data or a food-frequency questionnaire. Individual dietary patterns are formed over a prolonged period of time; thus. our dietary data reflected usual dietary patterns. Third, our study used the RRR method to identify dietary patterns, instead of using previous dietary pattern approaches, factor analysis, or cluster analysis. This new method allowed us to derive the dietary patterns that maximally explained the change in physical growth.
However, this study also had several limitations. First, we measured BMC and BMD at the left calcaneus, which is a limited reflection of bone mass of the whole body. However, some studies have determined that calcaneus BMC and BMD are meaningful. Szucs et al. [49] reported a high correlation between calcaneus bone mineral content and ashed bone mass in cadaver measurements. Yamada et al. [50] reported that calcaneus BMD is highly positively correlated with lumbar spine BMD and suggested that calcaneus BMD could be useful as a site for BMD measurements. Although we could not measure total BMD or BMC, calcaneus BMC could be meaningful to understand bone growth among young girls. Second, we did not measure the level of physical activity. According to Rautava et al. [51], physical activity is associated with an increase in BMC and BMD in adolescent girls ranging from 9-15 years-old in a 7-year follow up study, and Foo et al. [52] also found that continuous physical activity during adolescence may optimize bone growth of adolescent Chinese girls aged 15 years. Thus, further studies on the association between dietary patterns and physical growth are required, including the effect of physical activity. Third, we used convenient sampling by contacting only one elementary school, which means that generalizing the results must be made with caution. Further studies are necessary to confirm whether the same results are obtained in other populations.
In conclusion, our results suggest that a well-balanced diet, characterized by the high intake of fruits, nuts, milk, beverages, and eastern grains might benefit bone and body growth among school children. Additionally, we found that subjects showed greater changes in bones and body over the 2 years if they had lower body and bone mass at baseline. Our study provides an important public health message that emphasizing that a wellbalanced diet is important to foster development of both fat mass and lean body mass. By understanding the food consumption patterns of school children that influence physical growth, dietetic practitioners and health professionals can be encouraged to provide well-targeted guidelines to parents and caregivers.

 XML Download