

 PDF
PDF ePub
ePub Citation
 Print
Print


Introduction
As the elderly population increases, public awareness about health and nutrition in the elderly is gradually increasing as well. Older people are generally more likely to have chronic diseases such as hypertension, diabetes, osteoporosis, and so on, many of which require continuous diet therapy for both prevention and treatment. Because of this, the interest in the nutritional values of food items and the desire to understand related information rise, particularly as related to the elderly population.
An effective way to obtain credible information about the nutritional values of food items is by using a food composition table. In Korea, food composition tables have been published and updated since 1970 by the Rural Development Administration (RDA), and their most recent food composition table is in its 7th edition [1]. This table can supply credible data about the various nutritional values of over 2,505 food items, but using this resource may not be easy for the general population: as the nutrient contents in food items are expressed per 100 g of an edible portion of each food item, it is necessary to convert the contents per 100 g into those per the actual intake quantity [2].
However, in the United States (US) and Japan, there have been food composition tables created based on the portion sizes of an individual's single intake which can be easily used by the general population [3,4]. Recently, the KRDA has also begun to develop consumer-friendly food composition tables, and as a result of these efforts, they have published consumer friendly food composition tables for adults [5,6], children aged 6-11 [7] and those aged 65 or over [8]. The portion size in these tables refers to the amount of food that an individual decides to take at any one time. Energy and nutrient requirements, as well as physical status, vary according to gender, age and so on, with age being the most important factor. Portion sizes are also changing over time. It has been reported in the US that the rise in obesity over the last 30 years has been in proportion to increases in portion size [9]. Particularly, the increase in the portion sizes of high energy density foods as provided by restaurants, has contributed to the rise in obesity [10,11]. Therefore, portion size should be set separately for different life stages and be updated continuously.
This research was carried out in order to establish the portion sizes of frequently consumed food items, so as to develop a food composition table for the elderly using the Forth Korea National Health and Nutrition Examination Survey (KNHANES IV-2) 2008. Therefore, the purpose of this study was (1) to find which food items are typically consumed by Koreans aged 65 or over; (2) to establish the portion sizes of these food items so as to develop a consumer-friendly food composition table for the Korean elderly, and finally, (3) to address these findings in dietary planning and nutritional education for the elderly, and in assessing the diet intake status of the elderly.
Subjects and Methods
Subjects
We used data from 1,458 persons (16.9%) aged 65 or over, taken from the original 8,631 people who participated in the KNHANES IV-2, a nationwide dietary intake survey.
Selecting regularly consumed food items
We selected food items with an intake frequency of 30 or more among all the consumed food items dealt with by the survey. Frequently consumed food items were classified into 16 categories, based on the food groups in the Korean food composition table [1].
Analyzing portion size of food items and dishes of regular use
Estimation of portion sizes was carried out based on portion size analysis data and methods used to calculate reference values for nutrition labeling from the US [12,13]. The portion size of food items was set on the basis of the median (50th percentile) portion size of an individual's single intake. The median value was used rather than the mean value as a measurement of central position because the original data from KNHANES IV was not of normal distribution; diverse and extreme values cannot be eliminated and average of values measured in the units of 5 and 10 may even be subject to validity issues. Thus portion sizes were based on the median and were rounded off to units of 5 and 10 g considering the mean value and mode. For items with quantities of less than 10 g, the portion size was set in units of 1 g. For items in liquid form, portion size was set using mL. For seasonal food items, portion size was set based on the quantities used when the item is in season. For food items that include bones, skin of shell, the portion size was set based on the edible part.
Results
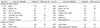
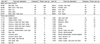
A total of 160 different regularly used food items were selected. The portion size of each item in the cereals, potatoes and starches is shown in Table 1. The portion sizes for cereals ranged from a minimum of 3 g for sorghum to the maximum of 125 g for Garaetteok (rice cake). The most frequently consumed item among the cereals was well-polished rice, which had a portion size of 75 g. The portion sizes of both potato and sweet potato were 120 g.
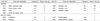
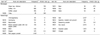
Legumes, nuts and seeds is shown in Table 2. The most frequently consumed legumes was dried black soybean, with a portion size of 9 g. Tofu was the next most commonly used items, and its portion size was 50 g. Among the nuts and seeds, roasted white sesame was the most consumed, with a portion size of 1 g.
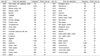
Table 3 shows the portion sizes of vegetables. This group had the largest number of items among 16 food groups. The most frequently used item in this category was garlic, with a portion size of 5 g. The portion size for welsh onion, the second most frequently used vegetable, was 2 g. Baechukimchi was the third most frequently used vegetable and its portion size was 30 g.
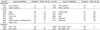
The portion sizes for mushrooms ranged from 5 g for oak mushrooms to 15 g for oyster mushrooms (Table 4). For raw fruits, portion sizes ranged from 105 g for bananas to 255 g for pears. Among the seaweeds, the most frequently consumed item was dried sea mustard, with a portion size of 5 g.
As shown in Table 5, the Korean elderly were more likely to eat fish and shellfish than meats. Among the meats, 10 varieties were included in this study; whereas 25 fish and shellfish were included the most frequently consumed food list. The most frequently consumed meat was pork loin and its portion size was 30 g. Among the fish and shellfish, boiled and dried large anchovy was the most frequently used item, with a portion size of 2 g.
The portion sizes for milk and eggs were 200 g and 50 g, respectively (Table 6). The portion size for oils was 5 g and the most frequently used variant was sesame oil. Among the sugars, the most frequently used item was white sugar, with a portion size of 1 g (Table 7).
In the beverage category, the most frequently used non-alcoholic item was coffee mix with a portion size of 120 ml, and the most frequently used alcoholic item was Soju with a portion size of 45 ml (Table 8). Among the seasonings, the most frequently used items were soy sauce, salt, red pepper powder, in that order. The portion sizes for these were 5 g, 1 g and 1 g, respectively.
Discussion
In order to assist people in meeting their daily nutrient requirements, dietary intake can be interpreted by either serving size or portion size. The serving size of a food refers to the recommended amount of food to be taken according to public guidelines on dietary intake, such as those found in the Food Pyramid. However, portion size refers to the amount of food an individual consumer eats at any one time [14]. This may be smaller or larger than the serving size. Accordingly, the portion size represents the actual intake amount of foods; therefore, expressing nutritional information per portion size may be more useful than expressing it per 100 g, particularly for consumers who need information about nutritional intake and menu planning.
As mentioned in the introduction section of this work, the portion sizes of frequently consumed foods for Korean adults [2] and children aged 6-11 [15] have been established through previous studies using KNHANES data. According to these studies, children's portion sizes for every food group were different to those for adults. The portion sizes of foods were thus different relative to age group, and a difference was also shown in the most frequently consumed food items. Therefore, portion sizes should be established for each different age group.
In this study, we selected 158 varieties of food items based on their usage frequency in Koreans of 65 and over, and established the portion sizes of these items. This study is very significant because it sets portion sizes for the Korean elderly for the first time on the basis of nationwide data about food intake quantities. These included foods comprise 13 varieties of cereals and cereal products, 4 of potatoes and starches, 3 of sugars and sugar products, 7 of legumes, 4 of nuts and seeds, 45 of vegetables, 4 of mushrooms, 11 of fruits, 10 of meats and meat products, 1 of eggs, 25 of fish and shellfish and related products, 4 of seaweeds, 3 of milk and milk products, 5 of oils and fats, 7 of beverages (alcoholic and non-alcoholic), and 13 of seasonings.
Among these items, the most frequently consumed food was well-polished rice, with a portion size of 75 g. Rice is the most representative traditional Korean staple dish, which can be proposed as the reason for which rice was the food item most frequently consumed by the Korean elderly. When we compared rice portion sizes for the elderly with those for adults (80 g) using previously reported data [2], the portion size for elderly was 5 g lower than that for adults. The Korean Nutrition Society has set the serving size white rice as 90 g [16].
Among the potatoes and starches category, the portion sizes of both potato and sweet potato were 120 g, which were 85% and 71% higher, respectively, than those for adults. The Korean Nutrition Society has set the serving size for potato and sweet potato as being 130 g and 90 g [16], respectively. The vegetable category contained the most varied food items among the 16 food groups. With the exceptions of garlic and welsh onion, which are commonly used as basic spices in Korean cooking, the most frequently consumed vegetable was Baechukimchi, and its portion size was 30 g, which is 10 g lower than that for adults. The Korean Nutrition Society has set the serving size for Baechukimchi at 40 g [16].
Items in the food groups which contain sources of protein, i.e. legumes, meats, fish and shellfish and eggs, had smaller portion sizes and less variety in the elderly group data than in that for adults. This suggests that the Korean elderly have a predominantly plant-based diet and a higher risk of protein deficiency. Insufficient protein intake in the Korean elderly has, in fact, been reported by previous studies [17,18].
Among the meats and meat product items, just 10 were included as frequently consumed by the Korean elderly, and three of these were soups made from beef bone or meat. However, 25 types of fish and shellfish were included. The Korean elderly thus appear more likely to eat fish and shellfish than meats and meat products. According to the several studies, fish consumption has positive effects on the prevention of chronic diseases, particularly cardiovascular diseases and cancer [19-21]. Virtanen et al. [22] assessed lifestyle and other risk factors every two years and diet every four years in US male health professionals aged 40-75 during an 18 year period. They reported that modest fish consumption (1 serving/week and 2-4 servings/week) was associated with a lower risk of total cardiovascular disease, consistent with mortality benefits. However, concern has been raised about the fact that consumption of some fish can lead to an increased risk of organochlorine or mercury contaminants in diet [23,24]. Therefore, further studies are needed to establish the recommended serving sizes and intake frequency of fish for the elderly.
Milk and milk products are good calcium source, but just two items (cow's milk and liquid yoghurt) were found to be frequently consumed foods. Given the insufficient calcium intake and high prevalence of osteoporosis in the Korean elderly [25], efforts are urgently needed to increase milk and milk product consumption in this group and to find further calcium sources.
To assess the portion sizes of regularly consumed food items actual-size photographs and nutritional values of food items per portion size have been added to this study's findings, thus enhancing the usefulness of the data. With this pictorial information, a food composition table for the elderly was published in 2010 [8]. Older people are more likely to suffer from chronic diseases, which may require on-going diet therapy for prevention and treatment. To counter this, these data and the results of this study can be conveniently and effectively used by the elderly themselves or their dietary planners when making food selections for a nutritionally balanced diet. In addition, these data can be used for setting single intake quantities in nutrition labeling of processed food items and the appropriate quantities for a single meal outside the home, e.g. in restaurants and nursing facilities. These established portion sizes can also be used in national nutritional education guidelines.


 XML Download