

 PDF
PDF ePub
ePub Citation
 Print
Print


Introduction
Obesity results from an excess energy intake and low energy expenditure, and is associated with lifestyle related diseases such as hypertension, arteriosclerosis, diabetes, osteoarthritis, and some cancers [1]. It is characterized at the fat cell biological level by an increase in the number and/or size of adipocytes, differentiated from preadipocytes, in adipose tissue [2]. Adipose tissue is an active endocrine and paracrine organ that releases a large number of cytokines and bioactive peptides, including leptin, adiponectin, Plasminogen activator inhibitor-1 (PAI-1), angiotensinogen, adiponectin, IL-6, and TNF-α [3]. Fat accumulation is determined by the balance between fat synthesis and fat breakdown. Lipogenesis encompasses the processes of fatty acid synthesis and the subsequent triglyceride synthesis, and takes place in both liver and adipose tissue [4]. Synthesis occurs in the cytoplasm, in contrast to degradation which occurs in the mitochondria. Many of the enzymes involved in fatty acid synthesis are organized into a multi-enzyme complex called fatty acid synthase, which includes the following enzymes: sterol regulatory element binding protein-1c (SREBP-1c), malonyl CoA decarboxylase (MCD), acetyl CoA carboxylase-1 (ACC-1), and fatty acid synthase (FAS) [5].
Lipolysis is the breakdown of fat stored in fat cells. During this process, free fatty acids are released into the bloodstream and circulate throughout the body. Triglycerides undergo lipolysis (hydrolysis by lipases) and are broken down into fatty acids. The following enzymes induce lipolysis: carnitine palmitoyl transferase-1 (CPT-1), acyl CoA oxidase-1 (ACO-1), and uncoupling proteins (UCPS) [6].
Lipid homeostasis is thus maintained by the fine-tuning of lipogenesis and lipolysis, which are regulated by cooperative action of various enzymes in the metabolic organs, particularly adipose tissues, the liver, and muscle [7]. To prevent or control patients' overweight status, there are many different approaches, including dietary control, exercise, and anti-obesity medication. However, anti-obesity drugs have been reported to have adverse effects, including headache, stomach-ache, vomiting, and heart attack [8]. More recent drug trials have focused on screening herbal medicines that have been reported to have anti-obesity activity. These medicines generally have a natural origin, cost effectiveness, and minimal side effects [9-11]. Herbal supplements and ingredients could avert obesity and possibly lead to the prevention of lifestyle-related diseases, if they can be shown to be effective in reducing body weight [12]. For these reasons, many anti-obesity studies have been conducted to find a suitable low-toxicity candidate with an anti-obesity effect. Lethariella cladonioides, (LC), is widely used to make teas and is locally referred to as luxinxuecha and hongxuecha. It belongs to the lichen family and is mainly distributed in the western part of China and Tibet.
LC is mainly characterized by yellow and dark pink pigments, which have been identified as canarion, rubrocashmeriquinone, 7-chlororubrocashmeriquinone, 7-chlorocanarione, and atranorin [13]. LC has long been used as a Chinese traditional medicine to treat swollen and sore throats as well as dizziness and fatigue [14].
According to modern medical research, LC contains many microelements that are necessary for health promotion, and may have anti-oxidant and anti-inflammatory activity. It may also lower cholesterol, hypertension and coronary heart disease and improve mental concentration [15,16].
However, there has been no study related to its potential anti-obesity effect. This study was therefore undertaken to investigate the anti-adipogenic effects of LC. The anti-obesity possibility of LC was determined through adipocyte differentiation, and by measuring fat accumulation, glycerol release, adipogenic enzymes expression in adipocytes and lipid profiles in diet-induced obese mice.
Materials and Methods
Preparation of herbal extract
LC was extracted three times by sonication for 3 hr in distilled water, followed by filtration through filter paper. After filtration, the LC extract was concentrated and freeze-dried. The extracts were stored at -20℃ until use. The LC extract showed yields in the ranges of 4.2-4.8%.
Cell culture and stimulation
3T3-L1 mouse embryo fibroblasts were obtained from the American Type Culture Collection (ATCC; Rockville, MD, USA). Cells were cultured in DMEM with 10% (v/v) BCS, 1% (v/v) penicillin-streptomycin until confluent. Two days after confluency, the cells were stimulated to differentiate with DMEM containing 10% FBS, 3-isobutyl-1-methylxanthine (IBMX, 0.5 mM), dexamethasone (1 µM), and insulin (10 µg/mL) for two days. Cells were then maintained in a 10% FBS/DMEM medium with insulin (10 µg/mL) for another two days, followed by culturing with a 10% FBS/DMEM medium for an additional four days, at which time > 90% of cells were differentiated 3T3-L1 adipocytes with accumulated lipid droplets. Differentiated 3T3-L1 cells were then treated with various concentrations of LC extract and 1 ng/mL TNF-α. The cells were maintained at 37℃ with 5% CO2 throughout the experiments.
Cell viability assay
The 3T3-L1 preadipocytes were seeded at a density of 1 × 10⁴ cells/well in 96 well plates. The cells were then treated with varying doses (5-500 µg/mL) of LC and were observed after 24, 48, and 72 hr. After completion of the treatment, the cells were incubated with an MTT solution for 3 hr at 37℃. The supernatants were aspirated, DMSO were added to each well, and the plates were agitated to dissolve the crystal product. Absorbance was measured at 570 nm using a multi-well plate reader (Molecular Devices Corp., VERSAmax, Sunnyvale, CA, USA).
Annexin V/PI double staining analysis
Annexin V-FITC/PI double staining of the cells was determined using the Annexin V-FITC kit (Roche Molecular Diagnostics, Mannheim, Germany). To detect normal, early apoptotic, late apoptotic, and necrotic cells induced by LC, differentiation of 3T3-L1 cells was induced, as described above.
Differentiated 3T3-L1 cells were treated with various concentrations of LC. Differentiated 3T3-L1 cells were then stained for 10 min with FITC-conjugated Annexin V-FITC and PI in a Ca2+-enriched binding buffer and analyzed in the FL1 and FL2 channels of a FACScan flow cytometer (BD Biosciences, San Jose, CA, USA), using emission filters of 525 and 575 nm, respectively. The Annexin V-FITC-/PI- cell population was regarded as normal, while Annexin V-FITC+/PI-cells were taken as a measure of early apoptosis, Annexin V-FITC+/PI+ as late apoptosis, and Annexin V-FITC-/PI+ as necrosis. The distribution of normal, early apoptotic, late apoptotic, and necrotic cells was calculated using CELL Quest software (BD Biosciences, San Jose, CA, USA).
Oil red O staining
Intracellular lipid accumulation was measured using Oil red O [17]. Differentiated 3T3-L1 cells were treated with various concentrations of LC. Cells were washed twice with PBS and then fixed with 10% formalin for 20 min. After the 10% formalin was removed, propylene glycol was added to each well for 3 min and washed exhaustively with PBS. Cells were then incubated with the Oil red O working solution for 3 hr. The staining of lipid droplets in 3T3-L1 adipocytes were rinsed three times with distilled water. The staining dye of cells was extracted with isopropanol and measured spectrophotometrically at 510 nm using a multi-well plate.
Glycerol release
Differentiated 3T3-L1 cells were treated with various concentrations of LC. Glycerol in the medium was measured using a free glycerol determination kit (Sigma-Aldrich Co., St. Louis, MO, USA) and glycerol standards were used for calibration. Briefly, a free glycerol reagent solution was reconstituted with distilled water. The free glycerol reagent solution was then reacted with distilled water (blank), glycerol standard (standard), and samples for 5 min. The mixture was transferred to a 96 well plate and absorbance was determined at 540 nm using a multi-well plate reader.
Western blot analysis
As in the glycerol assay, differentiated 3T3-L1 cells were treated with various concentrations of LC. After 72 hr, cells were collected, washed in PBS and lysed in an RIPA buffer (20 mM Tris, pH 8, 150 mM NaCl, 10 mM sodium phosphate, 100 µM sodium vanadate, 100 µM ammonium molybdate, 10% glycerol, 0.1% nonidet P-40, 0.1% SDS, and 1 × protease and phosphatase inhibitors) for 15 min on ice followed by centrifugation at 12,000 rpm for 20 min. The proteins were resolved by 12% SDS-PAGE and were then transferred to a nitrocellulose membrane. Blots were blocked in 5% skim milk dilute in the PBS-T buffer (PBS containing 0.5% Tween 20) for 1 hr and then incubated overnight at 4℃ with polyclonal antibodies against C/EBPα, PPARγ, and β-actin (Cell signaling Tec., Beverly, Ma, USA). To detect the antigen bound antibodies, the blots were treated with a secondary antibody conjugated with horseradish peroxidase coupled anti-IgG. Immunoreactive proteins were visualized using an enhanced chemiluminescence detection system, and band intensity was quantified using densitometry.
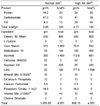
Animal model and diets
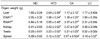
Five-week-old male C57BL/6 mice (n = 40) were purchased from Japan SLC, Inc. (Shizuoka, Japan). Mice were randomly divided into two groups: normal diet (ND group) and high fat diet (HFD), then the mice were fed diets (Research Diets, New Brunswick, USA) containing 10% and 45% of their calories as fat with energy densities of 3.8 and 4.7 kcal/g, respectively (Table 1). After 10 weeks of dietary manipulation, obesity was obtained in the high fat diet fed group, and the HFD-fed mice were then randomly divided into three HFD groups. These three HFD groups included a group fed only with a high fat diet (HFD group), a group fed with a high fat diet + 0.05% caffeine (CA group), and a group fed with a high fat diet + 100 mg/kg/day LC (LC group). Mice were orally administered either 200 µl of distilled water (ND and HFD group), or 200 µl of the experimental agents dissolved in distilled water by oral gavages for 10 weeks. Caffeine was used as a positive control. Caffeine has been successfully used as an agent that cause lipolysis and a safe thermogenic agent for weight control. Animals were housed in a temperature-controlled environment with a 12 hr light/dark cycle. The mice were given water ad libitum during the experimental period. The feed intakes and body weights of the mice were monitored daily and weekly, respectively. The experimental protocol was approved by the Animal Care and Use Committee (IACUC) of Kyung Hee University.
Collection of serum and tissue samples
Feed was removed 12 hr before sacrificing. Blood samples were collected from each mouse by orbital venipuncture and were incubated on ice for 1hr. Serum was separated from whole blood by centrifugation at 3,000 rpm for 20 min at 4℃ and kept at -80℃ until it could be analyzed. The liver, kidneys, spleen, testes, and adipose tissue were removed, rinsed with PBS, wiped with a paper towel, weighed quickly, frozen in liquid nitrogen, and stored at -80℃ until needed for assayed.
Analysis of serum and liver lipid profiles
Serum triglyceride (TG), total cholesterol (TC), HDL-cholesterol (HDL-C), and glucose were measured through an enzymatic method using a commercial kit (Asan Pharm Co., Seoul, Korea). Total lipids were extracted from the livers using Folch's method [18]. The extracted samples were dried under nitrogen gas, resolved in isopropanol containing 10% Triton X-100, and analyzed for lipid components. Hepatic TG and TC concentrations were determined using the same enzyme assay kit used for serum analysis.
Statistical analysis
Each experiment was performed in triplication. The results are expressed as the mean ± SD. Statistical analysis was performed using SPSS 15.0 for Windows. Analysis of variance was performed using ANOVA procedures. Significant differences (P < 0.05) between the means were determined by Duncan's multiple range tests.
Results
The effects of L. cladonioides on cell viability in cultured 3T3-L1 adipocytes
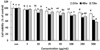
To evaluate the effects of LC on the growth of 3T3-L1 adipocytes, the cells were treated with escalating concentration (5-500 µg/mL) for 24, 48, and 72 hr (Fig. 1). Treatment of LC with 5 µg/mL (11.7% at 24 hr), 10 µg/mL (14.8% at 48 hr and 7.3% at 72 hr) significantly reduced the cell viability of 3T3-L1 adipocytes. LC treatment inhibited cell viability in a dose dependent manner. However, the extent of inhibition did not exceed IC50. The results of our data demonstrate that LC dosage did not have toxicity in LC treated (5-500 µg/mL) 3T3-L1 adipocytes.
The Effects of L. cladonioides on apoptosis in differentiated 3T3-L1 adipocytes
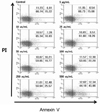
To quantify the modes of cell death (apoptosis or/and necrosis) induced by LC, differentiated 3T3-L1 adipocytes were treated with LC for 72 hr, stained with Annexin V-FITC and PI, and analyzed by flow cytometry. As shown in Fig. 2, flow cytometric analysis demonstrated that treatment of cells with LC did not affect the number of normal cells and apoptosis cells (early and late apoptotic cells) regardless of the treatment dosage.
The inhibitory effect of L. cladonioides on lipid accumulation in differentiated 3T3-L1 adipocytes
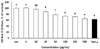
The inhibitory effect of LC on lipid accumulation was evaluated according to the duration of treatment after we induced adipogenesis by adding adipogenic hormone mixture containing various concentrations of LC for 72 hr (Fig. 3).
As a positive control, TNF-α (1 ng/mL) was used. Obesity leads to infiltration of the expanded adipose tissue by macrophages and increased levels of proinflammatory cytokines. The first indication of increased cytokine release in obesity was provided by the identification of increased expression of TNF-α, a proinflammatory cytokine in the adipose tissue of the obese mice. TNF-α is expressed in and secreted by adipose tissue, its levels correlating with the degree of adiposity and the associated level of insulin resistance. Targeting TNF-α and/or its receptors has been suggested as a promising treatment for insulin resistance and type 2 diabetes [19]. In this study, treatment with LC 50 µg/mL significantly reduced lipid accumulation (13.7% reduction, P < 0.05) in differentiated 3T3-L1 adipocytes in a dose dependent manner.
These results suggest that LC controls lipid accumulation in differentiated 3T3-L1 adipocytes.
The effects of L. cladonioides on lipolysis in differentiated 3T3-L1 adipocytes
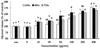
Generally, triglyceride hydrolysis proportionally release glycerol and free fatty acid from adipocytes, and this glycerol release is a marker of cellular lipolysis [20]. Therefore, we examined whether LC could increase glycerol release in differentiated 3T3-L1 adipocytes. Differentiation of 3T3-L1 adipocytes was clearly induced, as mentioned above. After serum starvation, differentiated 3T3-L1 adipocytes were treated with LC. Cell supernatants were collected after 24, 48, and 72 hr, and free glycerol release was then assayed. Treatment of LC at 50 µg/mL (55% at 24 hr), 50 µg/mL (29% at 48 hr), and 10 µg/mL (17% at 72 hr) all significantly increased the glycerol release (P < 0.05) of differentiated 3T3-L1 adipocytes (Fig. 4). These results thus demonstrate that the lipolytic effect observed in response to LC treatment was partially associated with the release of glycerol.
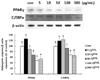
The effects of L. cladonioides on expression of adipogenic enzymes in differentiated 3T3-L1 adipocytes
PPARγ is known as a key station protein that is expressed early in the adipocyte differentiation of 3T3-L1 cells and prior to C/EBPα. The effects of LC on the protein expression of PPAR γ and C/EBPα in differentiated 3T3-L1 adipocytes are shown in Fig. 5. The protein expression of the adipogenic transcription factors, PPARγ and C/EBPα, were decreased in differentiated 3T3-L1 adipocytes treated with LC 10 µg/mL (15.2%, P < 0.05) and 50 µg/mL (6.9%, P < 0.05), respectively. Thus, LC mediated differentiation of 3T3-L1 adipocytes by inhibiting both adipogenic transcription factors PPAR-γ and C/EBP-α expression.
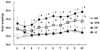
The effects of L. cladonioides on food intake and body and organ weight in obese mice
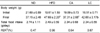
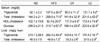
The experimental mice in the LC group appeared healthy, showing no pathological signs or abnormalities during the experimental period. Table 2 shows the body and organ weights and serum and hepatic lipid profiles of mice fed with the experimental supplements for 10 weeks. Total food intake among the HFD-fed groups was not significantly different. As expected, the body weight change was higher in the high-fat diet fed groups than the normal (ND) group. Supplementing CA and LC to the high-fat diet group significantly suppressed body weight gain at the end of the experiment: compared with that of the high fat diet (HFD) group the caffeine (CA) and Lethariella cladonioides (LC) group showed a weight reduction of 35.1%, and 14.2%, respectively (Fig. 6). The CA group showed significantly lower weights of liver, epididymal and retroperitoneal adipose tissues, kidney, testis, and spleen, in comparison with those of the HFD group. Moreover, compared with the HFD mice, significant decreases were observed in the liver (31.0%), epididymal (18.0%) and retroperitoneal adipose tissues (19.3%), kidney (6.7%), testis (6.0%), and spleen (17.1%) weights in the LC group (Table 3). Thus, LC may induce body and organ weight loss, without influencing food intake.
The effects of L. cladonioides on the serum and hepatic levels of lipid profiles
The fasting TG level of the LC group (11.6%) was significantly decreased compared to that of the HFD group, and that of the HSF group was significantly greater than that of the CA group. TC and glucose levels were significantly decreased by 22.6% and 35.0%, respectively, in the LC group compared with those of the HFD group (Table 4). On the other hand, HDL cholesterol level was significantly increased in the LC group (26.1%) compared to that in the HFD group and was not significantly different than that of the CA group. Similar to the serum level, hepatic TG and TC levels were significantly decreased in the LC group compared to those of the HFD group, by 30.9% and 19.1%, respectively. These results suggest that LC positively improved circulating and hepatic lipid levels.
Discussion
A variety of naturally occurring herbal extracts have been found to have beneficial effects on health, and these compounds have drawn attention because of their relative safeness and accumulating evidence in support of their beneficial physiological properties in vitro and in vivo.
LC has been found to be a useful natural substance that contains many microelements. It has been reported to assist in alleviating hypertension, hyperlipemia, swollen throat, and fatigue [15,16,21].
However, the anti-obesity effects of LC extract in vitro and in vivo have not yet been properly investigated. In this study, the anti-obesity effects of LC were investigated through the differentiation of 3T3-L1 adipocytes and body weight, and serum lipid profile measuring in diet-induced obese mice. The 3T3-L1 preadipocyte line has been proven to undergo complete differentiation into fully differentiated adipocytes [22]. We focused on observing the balance between lipogenesis and lipolysis, which is the mechanism of proposed anti-obesity. The present study provided evidence that LC treatment after a time interval of adipocyte differentiation is sufficient to prevent lipid accumulation in differentiated 3T3-L1 adipocytes and that it prevented body weight gain in mice.
In the in vitro experiment, treatment of preadipocytes with LC during the cell proliferative stage inhibited cell viability in a dose dependent manner with no apparent toxicity. Flow cytometric analysis demonstrated that treatment of differentiated 3T3-L1 adipocytes with LC did not affect the proportion of normal cells and apoptosis cells including cells in the early apoptosis stage. This data suggests that adipose tissue mass could not be decreased by the deletion of adipocytes via apoptosis in treatment with LC. The accumulation of triglyceride in differentiated 3T3-L1 adipocytes was decreased in cells treated with LC as compared with those in untreated cells. The results of our data thus demonstrate that LC had an inhibitory effect on lipid accumulation in differentiated 3T3-L1 adipocytes. Triglyceride hydrolysis proportionally release glycerol and free fatty acid from adipocytes, and this glycerol release was significantly increased after the treatment of LC on differentiated 3T3-L1 adipocytes, suggesting that the anti-adipogenic effects were partially mediated by increased lipolysis. Other natural compounds, such as conjugated linoleic acid (CLA), epigallocatechin gallate (EGCG), and curcumin have also induced lipolysis in adipocyte models [23-25].
We examined the protein expressions of adipogenic transcription factors by LC after adipocyte differentiation. The induction of adipocytes differentiation involves the cooperative interplay of members of the PPARγ and C/EBPα [26,27]. Once transcription of the PPARγ and C/EBPα gene has been initiated, its continued expression is assured through transcriptional autoactivation. This mechanism is believed to be responsible, at least in part, for maintaining expression of adipocyte genes transactivated by PPARγ and C/EBPα in the terminally differentiated state. Treatment with LC, except at the 5µg/mL dose, reduced the protein expression of the adipogenic transcription factors (PPARγ and C/EBPα). Given the fact that the level of Oil O red was not changed at the dose of 5 µg/mL, it is of interest to find the underlying mechanism for the increase in PPARγ level at a low level. It may be that the initial low-dose treatment of LC might have acutely stimulated the synthesis of PPARγ. Putting these results together, it is suggested that the anti-adipogenic effects of LC were mediated by reduced lipogenesis.
In vivo, we conducted animal studies to further assess the effects of LC on body fat metabolism and its potential role in the prevention and treatment of obesity. High fat diets are used widely and have been accepted in nutritional experiments as a good strategy to induce over-weight conditions and fat deposition in animals [28]. Thus, the period of high fat feeding induced a marked weight increase in mice. As a positive control, caffeine was used because it has been demonstrated in literature to reduce the body and adipose tissue weight in animal modelling [29]. For instance, Zheng et al. [30] have shown that a 0.05% caffeine intake for 10 weeks reduced the weight of intraperitoneal adipose tissues in mice fed a normal diet. Similarly, Yun et al. [31] reported that an intake of 0.025% caffeine for eight weeks reduced the body weight and epididymal adipose tissue weight of mice fed a high fat diet. A possible mechanism by which caffeine affects lipolysis involves inhibiting the phosphodiesterase-induced degradation of the intracellular cAMP [32]. Presently, possible evidence for the metabolic response to caffeine from mechanisms involving catecholaminergic stimulation of adipocyte or other cellular metabolisms seems less convincing [33,34]. In the results of this study, a high fat diet for 10 weeks resulted in obesity in mice, which was associated with increased body weight and fat mass with the development of hyperlipidemia. However, supplementation of caffeine or Lethariella cladonioides significantly reduced body weight and liver, epididymal and retroperitoneal adipose tissue, and spleen weight. Additionally, the triglyceride was more reduced in the CA and LC groups than in the HFD group. Lethariella cladonioides has phenolic compounds, such as canarione, thamnolic acid, usnic acid and etc. Polyphenolics, as compared with vitamin E, have been found to exert powerful antioxidant effects, to inhibit lipid peroxidation by acting as chain breaking peroxyl radical scavengers, to reduce plasma, inhibit hepatic lipid synthesis, and to increase cholesterol elimination via bile acids [35].
This is in agreement with Wei et al. [36], who reported that an ethanol extract of LC possesses strong antioxidant activity in vitro and hypolipidaemic activities in high fat diet mice.
As expected, total cholesterol was higher in HFD group than the normal (ND) group. This increase in total cholesterol was suppressed by both CA and LC treatment. Similarly, the glucose level was lower in the CA and LC groups than the HFD group. On the other hand, HDL-cholesterol was higher in the CA and LC group than the HFD group. These results suggest that LC exerts body weight loss and hypolipidemic effects in HFD fed mice. A high calorie diet is normally related to an increase of the synthesis of fatty acids in the liver and the delivery of free fatty acids to the liver [37]. It may also decrease β-oxidation of free fatty acids in the liver. Therefore, we investigated the lipid profiles, including triglyceride levels and total cholesterol, in the liver. Hepatic triglyceride and total cholesterol were lower in the CA and LC groups than the HFD group.
In conclusion, the results of this study showed that LC suppressed lipid accumulation and increased the amount of glycerol release into the medium. It also suppressed adipogenic gene expression in 3T3-L1 adipocytes and decreased body weight and modulated the lipid metabolism in obese mice. Although the exact mechanisms by which these effects take place remain to be elucidated, this study's results provide a basis for proposing that LC may have future application in the treatment of obesity.
 XML Download