

 PDF
PDF ePub
ePub Citation
 Print
Print


Introduction
Weight reduction behavior is common among adolescent girls. It occurs in not only overweight or obese girls, but also normal weight and underweight girls [1-7]. For weight reduction, the majority of adolescent girls adopted healthy strategies such as moderate dieting by reducing their meal sizes and snacks, and exercise, which can provide benefits to overweight and obese girls. However, at the same time, some female adolescents used unhealthy strategies to lose weight like skipping meals, fasting, vomiting, or taking diet pills [1,2,5,6,8].
For both overweight and underweight adolescents, attempting to lose weight over the long-term can cause serious consequences for physical and psychological development. Being overweight during adolescence tends to track into adulthood and is associated with a variety of chronic diseases and risk of adult mortality [9,10] and psychosocial problems [11]. Underweight and extensive weight reduction is also associated with negative health consequences such as nutritional deficiency, growth retardation, mental functioning, and reproductive capacity [12], and psychological problems like depression [13]. In addition, dieting is associated with the development of eating disorders [14]. Therefore, it is necessary to teach healthful strategies for weight reduction to overweight girls, and to prevent normal weight and underweight girls from unnecessary weight reduction.
For effective nutrition education about weight reduction, understanding factors affecting weight reduction behavior is important. Many studies investigated body-related factors leading weight reduction. Several motives for dieting were found in the studies with adolescents. Self-perception of overweight [2,3,5,7,15], lower body satisfaction [6,16-18], and an inaccurate perception of their weight [19] were the motives which drove them to go on a diet.
Socio-cultural factors, such as a value on thinness and friends' influences were associated with weight-related behaviors. Levine et al. [20] reported that 10 to 14 year old girls were concerned with being slender, and were prompted by parents, peers, and magazines in regard to weight management techniques and the importance of slenderness. Einsenberg et al. [21] reported that social norms of adolescent girls, particularly peer groups, had influenced unhealthy weight control behaviors. Hutchinson and Rapee [22] reported that friendship networks and peer influences were associated with a concern for body image, dietary restraint, extreme weight loss behaviors and binge eating, in a large community sample of young female adolescents. Leahey et al. [23] found that social contacts and normative beliefs had an influence on weight status and intentions for weight control in young adults.
Due to health implications of weight reduction behavior, it is important to explore the factors that predict the occurrence of them. The Health Belief Model (HBM) has been applied to explain weight control behavior among adolescents. The HBM is a psychological model that attempts to explain and predict health behaviors. This model suggests that changes in health behaviors are predicted by perceived susceptibility, perceived severity, perceived benefits, and perceived barriers, cues to action and self-efficacy. Perceived susceptibility is a belief about the likelihood of getting a disease or condition. Perceived severity is a belief about the seriousness of the condition. Perceived threat is a sum of severity and susceptibility. Perceived benefit is a belief that a certain action will reduce risk of impact and perceived barriers is a belief about costs of the action. Cue to action is a motive to readiness and self-efficacy is one's confidence in the ability to successfully perform an action.
Several Studies have been conducted which focused on weight control using the HBM. Kang et al. [24] studied factors affecting obese adolescents' intention to control their weight as measured by the elements of the HBM in the Seoul metropolitan area. She found that among the HBM variables, perceived benefit was the most important variable to explain female students' intention to control their weight. Lee [25] examined the effect of health belief (which consisted of perceived susceptibility, perceived severity, perceived benefits, and perceived barriers, and cues to action) and self-efficacy on weight control behavior and intention to control obesity among elementary school students. She also found that health belief included dietary self-efficacy was a significant predicting variable for weight control behavior and intention to control obesity.
O'Connell et al. [26] studied how to predict dieting among obese and non-obese adolescents. They found that benefits of dieting were the most powerful predictors of dieting behavior for obese adolescents, whereas susceptibility to the causes of obesity best explained the present dieting behavior of non-obese adolescents. In another study, with female college undergraduate students [27,28], perceived benefits and susceptibility were the significant predictors of weight reduction behavior.
Students had an inaccurate perception about their weight. For Korean female adolescents, independent of actual BMI categories, they were likely to consider themselves heavier than their actual weight. A considerable proportion of the underweight adolescents perceived themselves as normal weight, even as overweight. A substantial proportion of the normal weight girls perceived themselves as overweight or obese [2,4]. On the other hand, for American girls, a considerable proportion of students who were classified as overweight perceived themselves as normal weight, even as underweight. Some of the normal weight girls perceived themselves as overweight or underweight [15,19].
Perceived threats to obesity negatively predicted healthy eating behavior [29]. Perceived threat of obesity increases with an increase of weight, so they might feel a different level of threat according to their weights. If students perceived their weight inaccurately, they might underestimate (in case of overweight people) or overestimate (in case of underweight people) their threat to become obese. According to Moore et al. [30], overweight and obese women underestimated their weight categories and overweight women perceived the same threat to obesity as normal weight women. In addition, if students have misperceptions about their weights, they might perceive social pressure to be thin and friends' influences on weight reduction behavior (cues to action in the HBM) differently. Therefore, it is essential to investigate the HBM variables by weight status.
Female middle school girls are an important demographic for studying weight reduction behavior because many of them already have had experience with weight reduction. Moreover, the rate of weight reduction might increase with age. However, there has been little research conducted using the HBM with this demographic.
The purpose of this study was to examine the status about weight reduction behavior, and to explore the factors affecting behavioral intention of weight reduction by applying the HBM for female middle school students by weight status. The HBM variables examined in this study included perceived threat (a sum of severity and susceptibility), perceived benefits, perceived barriers, cues to action, self-efficacy in dietary life and exercise, and behavioral intention of weight reduction. The results of this study will be useful in planning nutrition education about weight reduction by providing different approaches for different weight groups.
Subjects and Methods
Subjects
The subjects of this study were recruited from three girl's middle schools in Gyeongju, Korea in May, 2011. From two of the schools, a classroom from the first, second, and third grade was chosen. For the other school, one classroom from the first and second grade was chosen, along with, two classrooms from the third grade, to obtain enough overweight students for statistical analysis, because there were more overweight students in the third grade according to a report by the Korean Ministry of Education, Science and Technology [31]. This decision was also recommended by a teacher at the sampled middle school. As a result, students were recruited from three first grade and second grade classrooms, and four third grade classrooms. The surveys were distributed to 335 participants. Surveys with missing data on key variables were excluded from analysis. Therefore, 299 surveys out of 335 were analyzed.
Questionnaire development and contents
The first version of the questionnaire was developed based on literature search of similar studies [16,25,32-34]. The first draft was modified for this sample and checked by a middle school teacher for students' understanding. After a pilot test with 10 students, some statements were rephrased and modified. The final questionnaire had three sections: general characteristics, experiences of weight reduction behaviors, and constructs of the HBM.
The general characteristics portion of the questionnaire consisted of questions about students' grade, height, weight, parents' obesity, parents' education and occupation, and family economic status. The experiences of weight reduction behaviors section consisted of questions about satisfaction with body weight and experience, frequency, methods, and reason for weight reduction behavior. Finally, the questions about constructs of the HBM consisted of perceived threat, perceived benefits, perceived barriers, cues to action, perceived self efficacy in dietary life, perceived self-efficacy in exercise, and behavioral intentions of weight reduction.
All of the variables of the HBM, except behavioral intention, consisted of 4-point Likert scales. The Perceived threat scale consisted of eleven items about susceptibility (possibility of becoming obese) and severity of obesity (severity of disease resulting from obesity), the perceived benefits scale with 11 items, the perceived barriers scale with 12 items, the cues to action scale with 6 items, the perceived self-efficacy in dietary life scale with 16 items, and the perceived self-efficacy in exercise scale with 9 items. The items for each scale are presented in Table 4~9. Possible responses for each variable were "completely disagree", "disagree", "agree", and "completely agree". A score was given for each response from 1 to 4, whereby higher scores indicated a stronger feeling of each variable. Cronbach's α of the perceived threat scale was 0.761, 0.859 for the perceived benefits scale, 0.805 for the perceived barriers scale, 0.764 for the cues to action scale, 0.843 for the perceived self-efficacy in dietary life scale, and 0.831 for the perceived self-efficacy in exercise scale.
Behavioral intention of weight reduction was measured using a 5-point Likert scale on five items. The results are presented in Table 10. Possible responses were "completely agree", "agree", "don't know", "disagree", and "completely disagree". "don't know" was added because intention could be undecided. A score of 1 to 5 was given to each response, whereby higher scores indicated a stronger intention. Cronbach's α of this scale was 0.843.
Statistical analysis
Weight groups were divided into three categories: underweight (BMI < 18.5 kg/m2), normal weight (18.5 < BMI < 22.9 kg/m2), and overweight (BMI > 23 kg/m2). There were few obese students, who were put into the overweight group. All statistical analyses were conducted according to the three weight groups. The SAS software program version 9.2 was used for analysis. Descriptive statistics were calculated for all relevant variables. Chi-square tests were applied to analyze categorized variable. The differences among the means were determined by ANOVA, followed by the Tukey test. Stepwise multiple regression analysis was completed to determine the factors associated with behavioral intention of weight reduction.
Results
General characteristics
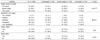
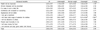
The mean height, weight, and body mass index (BMI) of students were 158 cm, 50 kg, and 20, respectively. The height of respondents was not significantly different among weight groups. The mean weight of the students in the overweight group was about 63 kg, 52 kg in the normal weight group, and 43 kg in the underweight group, respectively. There was a 20 kg difference between the underweight group and the overweight group. The weight of respondents was significantly different among weight groups (P < 0.001). The mean BMI of students in the overweight group was about 24.7 kg/m2, 20.5 kg/m2 the normal weight group, and 17.3 kg/m2 in the underweight group, respectively. The mean BMI was significantly different among weight groups (P < 0.001).
The subjects' weight groups by grade and weight-related characteristics are presented in Table 1. The distribution of weight groups was significantly different by grades (P < 0.01). Forty-one percent of the first grade students belonged to the underweight group, compared to 23% of the second grade students and 36% of the third grade students. On the other hand, 50% of the third grade students belonged to the overweight group, compared to 12% of the first grade students and 38% of the second grade students. As a whole, about 60% of the students had a normal weight, while 30% were underweight, and 11% were overweight.
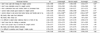
Data revealed that many students were not satisfied with their weight. Only about 20% of the students were satisfied with their weight, while about 50% of students were not. Students' satisfaction with their weights showed significant differences according to weight groups (P < 0.001). About half of the students in the underweight group were satisfied with their weight, while only 3% of students in the overweight group were satisfied. Almost all of the students in the overweight group were dissatisfied with their weight, while about 17% of the students in the underweight group were dissatisfied with their weight. Even in the normal weight group, only about 8% of the students were satisfied with their weight, while two-thirds of the students were not satisfied. Fourteen percent of the students answered that their mothers were obese, whereas 12% of the students answered that their fathers were obese. The rate of obesity for mothers was not significantly different, but was significantly different for fathers (P < 0.01). A higher percentage of students in the overweight group answered that their fathers were obese compared to those of in the underweight and normal weight groups.
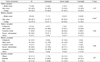
The results related to the family environment of the respondents are presented in Table 2. Regarding the education level of the students' parents, 42% of fathers and 53% of mothers graduated from high school, and 52% of fathers and 42% of mothers graduated from college or above. The education level of the students' fathers was not significantly different among weight groups. On the other hand, the education level of the students' mothers was significantly different among weight groups (P < 0.05). A higher percentage of mothers in the underweight group finished more than a college level of education than those in the normal and overweight groups. As for jobs, office worker was the most popular occupation for fathers (43%) and housewife the most common for mother (45%). There was no significantly difference among weight groups. Most students answered their economic conditions were moderate, while 11% were affluent, and 12% were poor. There was no significant difference among weight groups.
Behavior about weight reduction
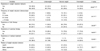
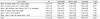
Experience, frequency, methods, and reason of attempting weight reduction of respondents who had experience with weight reduction are presented in Table 3. About half of the students had experience trying to reduce their weight, and there were significant differences among weight groups (P < 0.001). A higher percentage of students in the overweight group (71%) attempted to reduce their weight compared to the underweight (24%) and normal weight group (53%). The frequency of weight reduction behavior was significantly different among the weight groups (P < 0.001). Overall, about 60% of the students attempted to reduce their weight 2-3 times a year. This was similar among all three weight groups. However, 24% of the students in the normal weight group and 30% of the students in the overweight group tried to reduce their weight more than four times a year. On the other hand, only 5% of the students in the underweight group attempted to reduce their weight more than four times a year.
Many students controlled their diet and exercised to reduce their weight. Among the students who had experience attempting to reduce their weight, 73% of them tried diet therapy, 78% exercised, and only 4% underwent medical treatment. The methods which students employed for weight reduction were significantly different among the three weight groups (P < 0.001). A higher percentage of students in the overweight group tried diet therapy and medical treatment compared to the underweight group and the normal weight group. However, a higher percentage of students in the underweight group exercised compared to the normal and overweight groups. About two-thirds of the students responded that they attempted to reduce their weight to improve their appearance, while 26% did so for health. There were significant differences in the reasons for weight reduction among the weight groups (P < 0.001). Compared to students in the normal and overweight groups, a higher percentage of students in the underweight group answered that health was their reason for weight reduction. Compared to students in the underweight and normal weight groups, a higher percentage of students in the overweight group answered that a better appearance was the reason for weight reduction.
Perceived threat for obesity
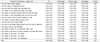
The students' perceived threat of obesity is presented in Table 4. The mean score of the total perceived threat for all respondents was 2.54 (range 1-4) and showed the highest score (3.14) in the item "If obese, one cannot wear clothes one want." followed by "Obesity cause various diseases" (3.08). Students in the overweight group showed the highest mean score (2.61).
The mean score of the total perceived threat did not show significant differences between the normal weight group and overweight group, but showed significant differences between these two groups and the underweight group (P < 0.01). There were significant differences among weight groups in the items "If leave me the way I am, I will be obese." (P < 0.001), "I am more susceptible to disease than others." (P < 0.05), "I am subject to hypertension, diabetes, heart disease more easily than others." (P < 0.001), "If obese, one will be a target of teasing" (P < 0.01), and "If obese, I don't have friends" (P < 0.05).
Perceive benefits of weight reduction
Students' perceived benefits they could get by reducing their weight are presented in Table 5. The mean score of the total perceived benefits for all respondents was 2.99 (range 1-4). Students in the normal weight group had the highest score (3.04) but there were no significant differences among the three groups. With regard to the item "I will have wide range of selection for choosing clothes", students in the normal weight group showed the highest score (3.31), which was significantly different (P < 0.05) than the other groups.
Perceived barriers to weight reduction
Students' perceived barriers to weight reduction are presented in Table 6. The mean score of the total perceived barriers for all respondents was 2.35 (range 1-4). Students in the normal weight group had the highest score (2.38) but there were no significant differences among the three groups. Students in the normal weight group showed significant differences (P < 0.05) for the item "I cannot refuse to eat some food when family and friends ask to try" compared to students in the underweight group.
Cues to action for weight reduction
Cues to action for weight reduction are presented in Table 7. The mean score of the total cues to action for all respondents was 2.77 (range 1-4). Students in the underweight group showed significant differences from the normal and overweight groups (P < 0.001). Students in the underweight group showed a significant lower score than the students in the normal and overweight groups for three items: "when my friends advise me to control weight" (P < 0.01), "when my friends control their weight" (P < 0.001), and "when I want to wear the clothes which I want" (P < 0.001). There were no significant differences between the normal weight group and the overweight group. Thus, it was found that students in the normal weight group were easily triggered from stimuli for weight reduction as much as students in the overweight group.
Perceived self-efficacy in dietary life and exercise
Self-efficacy in dietary life is presented in Table 8. The mean score of the total self-efficacy in dietary life for all respondents was 2.90 (range 1-4). Students in the underweight group had the highest score (2.94) but did not show significant differences from other weight groups. Self-efficacy in exercise is presented in Table 9. The mean score of the total self-efficacy in exercise for all respondents was 2.80 (range 1-4). Like self-efficacy in a dietary life, students in the underweight group had the highest score (2.87) but did not show significant differences from other weight groups. For the item "I can do light exercise every free moment", students in the underweight group had the highest score (3.17) and showed significant differences (P < 0.001) from other groups.
Behavioral intention of weight reduction
The students' behavioral intention of weight reduction is presented in Table 10. The mean score of the intention was 3.13 (range 1-4) for all respondents. They intended to reduce their weight by controlling their diet and exercising regularly more strongly than visiting a clinic and going to a fitness center. Students in the overweight group showed the strongest intention (3.59), followed by students in the normal weight group (3.28) and underweight group (2.66). There were significant differences among weight groups (P < 0.001). Different from other variables, all of the items in behavioral intention showed significant differences among groups. Thus, students in the overweight group showed a significantly (P < 0.001) higher score for the intention of visiting a clinic, exercising regularly, going to a fitness center, and attending school obese class than students in the normal and underweight groups. For the intention of controlling their diet, there were no significant differences between the overweight and normal weight groups, but showed significant differences between these two groups and the underweight group.
Predicting behavioral intention of weight reduction
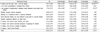
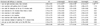
Stepwise multiple regressions were conducted to determine the relative importance of the variables of the HBM to behavioral intention of weight reduction. The results are presented in Table 11. When perceived threat, perceived benefits, perceived barriers, cues to action, and perceived self-efficacy (in dietary life and exercise) were regressed against behavioral intention, the model was highly significant even though it explained a relatively small variance (R2 = 0.155). While perceived benefits and perceived barriers were not significant, perceive threat (P < 0.01), cues to action (P < 0.001), and perceived self-efficacy (P < 0.01) were significantly associated to behavior intention of weight reduction. Cue to action seemed to be the most important among these three variables.
For the underweight group, perceived threat and perceived self-efficacy were the significant variables. For the normal weight group, there were no significant variables. For the overweight group, cue to action was the only significant variable.
Discussion
This study was conducted to investigate behaviors about weight reduction and factors influencing behavioral intention by applying the HBM. The mean height and weight of students were 158 cm and 50 kg, respectively. These results for height and weight were similar to other studies [2,3,35,36] and differences among them were insignificant. About 60% of the students were determined to have normal weight according to the BMI, while 30% and 11% of them were underweight and overweight, respectively. These results differed from other previous researches [1-3,31,35]. The most similar results were those of Kang and Lee [3], which showed that 54% of students were normal weight, 37% underweight, and 10% overweight and obese. Inconsistency with the results of other studies might be due to regional differences in sampling [1-3,35] or methodological differences [31]. This study calculated the BMI based on self-reported information, while the Korean Ministry of Education, Science and Technology [31] used direct measurements of height and weight.
Many girls responded that they were not satisfied with their body weight. Almost all of the students in the overweight group, and two-thirds of the students in the normal weight group were dissatisfied with their weight. Furthermore, about 17% of the girls in the underweight group were not satisfied. This trend was also found in other studies which focused on middle school girls [1,2,37]. Such body dissatisfaction may drive girls to try weight reduction. Studies with high school students [16] and high school and college students [17,38,39] revealed that body dissatisfaction was one of the important variables to predict behavioral intention of weight control and eating disorders. Students who were dissatisfied with their body weight suffered from high stress about obesity, tried to control their weight more frequently, and had a higher risk of having an eating disorder than those who were satisfied [14,17,35].
As for family environment, more fathers were obese and less mothers finished college in the overweight group. Studies with middle school students [4] and elementary school students [25,34] reported that more mothers and fathers were obese in overweight and obese groups. These studies also showed that parents' educational level was not related to children's obesity, unlike the present study. Parents' occupations and the economic conditions of families were not related to students' obesity. Lee's study [25] showed the same results.
About half of the students in this sample have tried to reduce their weight, including 70% of the students in the overweight group. About 60% of the students who have tried to reduce their weight have tried 2-3 times a year. Students in the overweight group tried more frequently than students in the underweight and normal weight groups. These trends were found in other studies with adolescents [2-7,11].
Students in this study have tried to reduce their weight by mostly diet therapy and exercise. A few students adopted medical treatment. The most common diet therapy was eating three reduced meals (28%), while unhealthy dieting methods such as skipping meals, eating one food, eating commercial diet food, and omitting particular foods covered about 40% (not shown in a table). Skipping meals was the most frequent (14%) method among diet therapy in the present study. Such results in middle school students were also found in other studies [1,2,37]. According to Neumark-Sztainer et al. [40], there were steep longitudinal increases in the use of unhealthy weight control behaviors and extreme weight control behaviors in females, between early and middle adolescents, from 1999 to 2004 in the United States. About 25% of underweight and 53% of normal weight students had experiences of reducing their weight. Therefore, nutrition education will be needed for preventing underweight and normal weight students from needless dieting, in addition to teaching overweight students desirable dieting methods.
About two-thirds of the students tried to reduce their weight to improve their appearance, including 74% of the overweight students. A desire to have a better appearance or thin body was the main reason for trying to control body weight in other studies with middle school students [1-3]. Boyd et al. [41] suggested that a girl's sense of herself was shaped by her identity group membership. They also insisted that her body was culturally and socially located, concretely experienced, and actively interpreted, affecting all aspects of her life and experiences, including perceptions about body weight and inclinations to control her weight. Judging from the results of this study and others which referred to the above experiences, the frequency and reasons for controlling body weight, and dissatisfaction with body weight, women's thinness has been overstressed in Korean society. Such a high value on thinness in our society might pressure many middle school girls (even 60% of underweight girls in this study) to try to control their weight. Students thought that a benefit which they could get from reducing their weight was fitting a wide range of clothes. Students also attempted to reduce their weight when they wanted to wear clothes which they desired. Such results also might reflect lookism, which is rampant in our society.
Students knew the health problems of obesity. They also thought improving their health and preventing chronic diseases were benefits which they could get from reducing their weight. Overweight students perceived more threats from obesity including diseases such as hypertension, diabetes, and heart disease than underweight and normal weight students. A study with African American women [30] found that normal weight women reported the same perceived threat of obesity-related diseases as overweight women. Students in the normal weight group showed significantly higher threat about becoming a teasing target and not having friends due to obesity, compared to those in the overweight groups. However, overemphasis on the threats of obesity and benefits of weight reduction might influence underweight and normal weight students to try to unnecessarily reduce their weight.
Friends, family, and mass media were influences on the students' behaviors of reducing weight. The results reflect that family and friends were also barriers to the students to refrain from foods. This study is consistent with other studies [20-22] which explained the influences of parents, peers, and magazines on weight control behaviors. Thus, school-wide nutrition education about desirable weight control is needed for students and parents, and mass media campaigns are also needed to moderate lookism.
The students' perceived self-efficacy in dietary life and exercise did not show any significant differences among weight groups. This result was not consistent the results of other studies [4,42] which showed that when the obesity rate was high, self-efficacy was low.
Perceived threat, cues to action, and perceived self-efficacy were the significant variable to predict behavioral intention of all respondents. Cues to action seemed to be the most important among the three variables. Cues to action refer to influences of social environment such as family, friends, mass media, and boyfriends. Again, social environment could be an important factor affecting adolescent's weight reduction behavior. For the underweight group, perceived threat and perceived self-efficacy were the significant variables. For the overweight group, cue to action was the significant variable. This was not consistent with other studies [24-26] which showed that perceived benefit was the most important variable.
Variance from regression analysis was not big enough. This might be due to other variables affecting students' behavior of weight reduction. Other studies [16,17] reported that dissatisfaction with the body was the most important variable that influences weight control. Pesa [13] insisted that self-esteem was the strongest contributing factor differentiating dieters and non-dieters.
In conclusion, the significant variables to predict behavioral intention of weight reduction were perceived threat, cues to action, and perceived self-efficacy. It is desired for overweight students to properly increase the threat of obesity, social influences, and self-efficacy for weight reduction. However, many normal weight students felt threatened about obesity as much as overweight students had. Moreover, normal weight students look vulnerable to social influences. Therefore, intervention about weight management should be targeted to different weight groups with different, appropriate educational contents.
This study has several limitations. As with most studies of this kind, the study samples were convenient samples, not random samples. Also, data was collected using a self-report nature. Additionally, this was a cross-sectional study, so causal relationship could not be established. Finally, this study had a small number of samples from a limited area, so the results cannot be generalized.

 XML Download