

 PDF
PDF ePub
ePub Citation
 Print
Print


Introduction
The prevalence of obesity has increased in Korea, with more than one third of the adult population currently obese [1]. Obesity is a major risk factor for many diseases, including cardiovascular diseases, diabetes, and certain types of cancer, resulting in an increased risk of death [2].
Obesity is a condition of excessive accumulation of fat due to an imbalance between energy intake and expenditure. Efforts have been made to identify dietary patterns, nutrient intake and composition, and other behavioral factors associated with obesity. Wang and Beydoun [3] reported that meat consumption was associated with risk for obesity among US adults, based on data from a 1999-2004 National Health and Nutrition Examination Survey. Higher proportions of energy consumed from protein and animal protein were shown to be associated with the risk for obesity in 2,470 women from the southwestern United States [4]. Self-reported snacking was identified as a major factor in the development of obesity in a Spanish cohort study, which followed up for 4.6 years [5]. Snack consumption and energy intake from snacks were higher in obese adolescent girls in Korea [6]. Certain eating patterns, such as skipping breakfast and lunch, eating at night, and larger self-reported portion sizes of main meals have been related to obesity [7]. While Howarth et al. [8] reported that eating frequency was positively associated with energy intake, and eating more than three times a day was associated with obesity, Mills et al. [9] showed that eating frequency was not associated with obesity. It appears that key dietary factors that contribute to the development of obesity are diverse and depend on the characteristics of the study population.
The prevalence of obesity increases with age. According to the Korean National Health and Nutrition Examination Survey (KNHANES) conducted in 2007, the highest prevalence of obesity in men was observed in those in their 40s (41.1%) and in women in their 60s (43.8%) [10]. Obesity increases the risk of developing metabolic diseases. The prevalence of metabolic diseases, such as hypertension, diabetes, and hypercholesterolemia, increased significantly in people over 50. On the other hand, the prevalence of elevated triglyceride levels was highest in men in their 40s and women in their 60s, which coincides with the prevalence of obesity. In the general Korean population, incidences of metabolic disease and metabolic syndrome are not high in young adults. However, young adults who are obese have an increased risk for metabolic diseases and have a greater risk for developing metabolic diseases as they age.
In this study, we investigated the clinical and biochemical parameters of obese young adults to determine the metabolic abnormalities associated with the obesity. In addition, dietary intake, exercise patterns, and alcohol consumption were determined to identify factors that may contribute to obesity in young adults.
Subjects and Methods
Subjects
Thirty subjects older than 19 and younger than 60 years of age with body mass index (BMI) over 25 kg/m2 (obese group) and 15 subjects with BMI between 18.5 and 23 kg/m2 (normal weight group) were included in the study. None of the 45 subjects had evidence of any chronic illness, including endocrine, hepatic, renal, thyroid, or cardiac dysfunction. None of the subjects were taking medications known to affect serum lipid levels or nonsteroidal anti-inflammatory drugs, such as aspirin. Subjects who were taking dietary supplements were excluded from the study. The protocol was approved by the Seoul National University Institutional Review Board (SNUIRB) and written informed consent was obtained from all subjects.
Assessment of dietary intakes
Dietary intake was evaluated using a food frequency questionnaire (FFQ) and 3-day dietary records. The FFQ used was developed by Ahn et al. [11] with data from the Korea Health and Nutrition Examination Survey (KHANES) conducted in 1998 and included 103 food items. The validation and reproducibility of this FFQ has been evaluated for Korean adults [12]. Dietary records from 3 days (2 weekdays and 1 weekend) were recorded by the subjects, then the intake and amount of foods consumed was confirmed with an interview using pictures of the foods in actual size. An analysis of nutrient intake from the dietary records was performed using CAN-Pro 3.0, a nutritional analysis program developed by the Korean Nutrition Society.
Anthropometric measurement
Body weight and waist and hip circumferences were measured using InBody 520 (Biospace, Korea). Standing height without shoes was measured using a stadiometer.
Blood samples
Blood was collected in blood collection tubes after a 12-hour overnight fast. Blood for serum biochemical analysis was collected in serum separator tubes (BD vacutainer® SST, Becton Dickinson, United Kingdom). Blood for complete blood cell (CBC) analysis was collected in EDTA tubes (Standard Plus & Medical Co.,Ltd., Korea).
Biochemical analysis
Blood glucose, total cholesterol, HDL-cholesterol, and triglycerides were measured using Cobas Integra® 400 plus (Roche, Switzerland). LDL-cholesterol was measured by elimination and an enzymatic assay in Green Cross Reference Lab (Korea).
Measurement of serum free fatty acids
Nonesterified fatty acid levels in serum were measured using SICDIA NEFAZYME (Shinyang Chemical Co.,Ltd., Korea).
Blood pressure measurement
Blood pressure was measured after 10 or more minutes of rest using an automatic blood pressure monitor (Jawon Medical, Korea).
Statistical analysis
Data were analyzed using the SYSTAT statistical package (SYSTAT 10.0, 2000; SYSTAT, Inc., Evanston, IL). An ANOVA for overall effect of group and sex was carried out for dietary intake outcomes followed by Fisher's Least-Significant-Difference test for individual group comparisons. Pearson correlations were used to determine associations between dietary intakes assessed by 3-day dietary records and FFQs. A student's t-test was used to test for differences in clinical parameters between obese and normal weight groups. A Kruskal-Wallis nonparametric test was used for parameters that were not normally distributed. A Chi-square test was used to test for differences in the prevalence of dyslipidemia and metabolic syndrome. Data are reported as means ± SEM. Significance was set at P < 0.05.
Results
Demographic and anthropometric characteristics of subjects
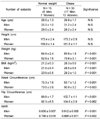
The demographic and anthropometric characteristics of test subjects are shown in Table 1. The mean age of the obese group was 29.9 ± 1.7 years and that of the normal weight group was 26.5 ± 1.3 years. There was no significant age difference between the two groups. The average heights of the obese and normal weight groups were similar for both men (173.3 ± 0.9 cm and 173.4 ± 2.4 cm, respectively) and women (161.6 ± 1.1 cm and 159.0 ± 1.4 cm, respectively). Weight and BMI were significantly different between the obese and normal weight groups as we recruited subjects based on BMI (Table 1). Waist circumferences were significantly higher (P < 0.001) in the obese group. Within the obese group, the average waist circumferences of both men and women were large enough for them to be classified as obese based on waist circumference alone.
Clinical characteristics of subjects
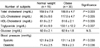
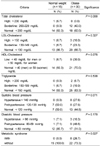
Fasting blood glucose levels, blood pressure measurements, and serum lipid profiles, including total cholesterol, LDL-cholesterol, HDL-cholesterol, and triglycerides, are presented in Table 2. The obese group had significantly higher levels of total cholesterol (P = 0.003, 30.0 mg/dL higher), LDL-cholesterol (P = 0.005, 30.7 mg/dL higher), and triglycerides (P = 0.007, 42.7 mg/dL higher) and significantly lower levels of HDL-cholesterol (P = 0.005, 10.3 mg/dL lower) as compared to the normal weight group. Systolic (P = 0.030) and diastolic blood pressures (P = 0.036) were also significantly higher in the obese group. There was no significant difference in blood glucose levels between the two groups. Although obese group's total and LDL-cholesterol levels and triglycerides were significantly higher than those of the normal weight group, their average values were still within the normal range (Table 2). This is most likely due to the fact that the subjects were fairly young, most of them being in their 20s. When the number of subjects with abnormal levels of clinical parameters was counted, the obese group had a higher percentage of subjects with dyslipidemia and metabolic syndrome (Table 3). The number of people with metabolic syndrome and abnormal levels of total cholesterol was significantly different between the obese and normal weight groups, determined by Chi-square test.
Serum free fatty acid level
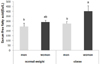
Serum free fatty acid (FFA) levels tended to be higher in the obese group (330.6 ± 28.6 Eu/L) than in the normal weight group (265.8 ± 21.0 Eu/L, P = 0.087; Fig. 1). Overall, women had higher levels than men (P = 0.040), but this difference was due to the very high levels in women in the obese group. In the normal weight group, there was no significant difference in FFA levels between men and women (244.3 ± 35.0 Eu/L and 290 ± 19.3 Eu/L, respectively). In the obese group, women had significantly higher FFA levels than men (275.4 ± 21.8 Eu/L and 402.7 ± 54.5 Eu/L, respectively, P = 0.025). Serum FFA showed a significantly positive correlation with fat mass in the obese group (r = 0.416, P = 0.022) but not in the normal weight group (r = -0.015, P = 0.959).
Comparison of nutrient intake in obese and normal weight groups
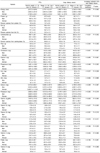
The nutrient intakes assessed by the FFQ and 3-day dietary record are shown in Table 4. No significant difference in nutrient intake between the obese and normal weight subjects was found from the FFQ. Differences in the intake of several nutrients were found between men and women with the FFQ. Carbohydrate intake was significantly higher for men than women (477.3 ± 40.1 g and 355.4 ± 29.2 g, respectively, P = 0.041). Energy (2975.2 ± 234.7 kcal in men and 2331.6 ± 180.4 kcal in women, P = 0.059) and cholesterol (438.2 ± 42.4 mg in men and 347.8 ± 32.3 mg in women, P = 0.082) intakes tended to be higher for men than women.
Nutrient intake measured with a 3-day dietary record showed that the absolute amount of fat intake tended to be higher for obese subjects than normal weight subjects (82.0 ± 7.4 g and 60.5 ± 4.2 g, respectively, P = 0.065). The percent of calories from fat was significantly higher in the obese group (33.7 + 1.8% in obese subjects and 27.8 + 1.3% in normal weight subjects, P = 0.032). Overall, vitamin B1 intake was significantly higher in men (1.56 ± 0.13 mg in men and 1.16 ± 0.10 mg in women, P = 0.045), and niacin intake tended to be higher in men (21.1 ± 2.0 mg in men and 16.2 ± 1.0 mg in women, P = 0.073). The FFQ and 3-day dietary record showed strong correlation (P < 0.05) for energy, protein, carbohydrate, fiber, calcium, phosphorus, iron, potassium, vitamin A, vitamin B1, vitamin B2, vitamin B6, and niacin intakes (Table 4).
All of the nutrient intake levels determined from the FFQ were above the dietary reference intakes for Koreans (2010). However, energy, fiber, folate, and vitamin C intake levels from the 3-day dietary record were below the dietary reference intakes for Koreans. The levels of vitamin A and vitamin B2 intake from the 3-day dietary record were below the dietary reference intakes for Koreans only for normal weight men. Potassium intake from the 3-day dietary record was below adequate intake for Koreans.
Usual exercise pattern and alcohol consumption
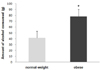
The average frequency and duration of exercise in the study subjects did not differ significantly between the obese (2.6 times/wk, 1.1 hrs each time) and normal weight group (1.8 times/wk, 0.7 hr each time). The frequency of drinking episodes per week did not differ between obese and normal weight subjects (0.8 times/wk and 0.7 times/wk, respectively). However, the amount of alcohol consumed per drinking episode was significantly higher in the obese group (78.5 g in obese group and 41.5 g in normal weight group, P = 0.034) (Fig. 2). Men consumed significantly more alcohol than women in both groups (104.2 g and 44.8 g, respectively in the obese group and 60.8 g and 18.7 g, respectively in the normal weight group).
Discussion
In this study, we examined the clinical characteristics and nutrient intake of obese and normal weight adults, most of them in their 20's, to identify dietary factors contributing to obesity and the impact of obesity on otherwise healthy young adults. The results of serum lipid profiles and blood pressure levels in our study confirmed that obesity is associated with an increased risk of dyslipidemia and metabolic syndrome [13,14]. Obese subjects had significantly higher total cholesterol, LDL cholesterol, triglycerides, and blood pressure, and significantly lower HDL cholesterol than normal weight subjects. However, the average levels of serum lipids in the obese group were within the normal range, and the obese group did not have higher blood glucose levels than the normal weight group. This is likely due to the fact that subjects in this study were mostly (> 85%) in their 20's.
Although the obese group's averages were within normal ranges, it is clear that obesity is associated with abnormal lipid metabolism and a higher risk of metabolic syndrome in young people. The percentage of subjects with abnormal lipid levels and blood pressure was higher in the obese group than the normal weight group. According to the diagnosis criteria for metabolic syndrome used by KNHANES, 26.7% of the subjects in the obese group of this study had metabolic syndrome, while none of the subjects in the normal weight group met the criteria. Results from the 2005 KNHANES reported that the prevalence of metabolic syndrome was 4.4% for Koreans in their 20's and 14.9% for those in their 30's. The prevalence of obesity in the same survey was reported to be 19.4% for Koreans in their 20ss and 29.0% for Koreans in their 30's [1]. Given the relatively low prevalence of metabolic syndrome reported in the 2005 KNHANES, even with obesity rates around 20 and 30%, the higher prevalence of metabolic syndrome reported in the obese group in this study demonstrates that obese young adults have the increased risk of developing metabolic syndrome.
An increased level of nonesterified FFA has been suggested as a possible mediator of insulin resistance and cardiovascular disease associated with obesity [15,16]. Overall, serum FFA levels tended to be higher in obese subjects in this study, mostly due to the high levels observed in the obese women. The significantly higher FFA levels in women in the obese group, even though fat mass was not significantly different between the genders, may pose a differential risk associated with obesity for women.
In this study, only a few dietary factors were shown to be significantly different between the obese and normal weight groups. The absolute amount of dietary fat intake from the 3-day dietary records tended to be higher in the obese group. When the percent of calories from fat was compared, obese subjects consumed significantly more calories from fat (about 20% more) than did normal weight subjects. Field et al. [17] observed a weak positive association between percent of calories from fat and weight gain in 41,518 women in a Nurses' Health Study, and calories from animal fat showed a stronger association. In this study, percent calories from animal fat consumed tended to be higher in the obese group. There are many dietary factors suggested to contribute to obesity, including eating frequency, meat consumption, calories from protein, snack consumption, and skipping breakfast [3-8,18,19]. We did not observe any differences in snack consumption between obese and normal weight groups. In addition, there were no significant differences in the number of side dishes consumed between obese and normal weight subjects.
Nutrient intake assessed from the FFQ and 3-day dietary record showed strong correlations in energy, protein, carbohydrate, fiber, calcium, phosphorus, iron, potassium, vitamin A, vitamin B1, vitamin B2, vitamin B6, and niacin intake. Crude correlation coefficients between the FFQ and dietary records in our study were comparable to the validation results from Ahn et al. [12], except for fat, cholesterol, zinc, sodium, vitamin C, folate, and vitamin E intake. Generally, nutrient intake assessed from the FFQ was higher than that assessed from the 3-day dietary record, except for vitamin E.
Energy intake was not significantly different between obese and normal weight subjects. Similar results have been reported in other studies [6,7,18]. A possible explanation may be an underreporting of dietary intake by obese subjects. Singh et al. [20] documented an increase in underreporting of dietary intake with increasing body weight in teens, determined from food records, total energy expenditure assessed using doubly labeled water, and metabolizable energy intake measured by bomb calorimetry. Weight management efforts of obese subjects via reduction of dietary intake may have also influenced their energy intake. Among the obese subjects in this study, 83% of them had tried to lose weight in the past by controlling dietary intake (52%), exercising (84%), and/or using alternative therapy or medication (12%).
Physical activity is an important factor in the regulation of energy balance and prevention of the development of obesity. Sedentary lifestyles have been associated with obesity [21,22]. In this study, the frequency and duration of exercise did not differ significantly between obese and normal weight subjects. Therefore, a sedentary lifestyle does not seem to be a major determinant of obesity in these subjects.
In this study, the amount of alcohol consumed per drinking episode was significantly higher in the obese group. The frequency of drinking episodes was similar for both groups. Conflicting results exist on the relationship between alcohol consumption and the development of obesity [23,24]. However, Yoon et al. [25], using 1998 KNHANES data, reported that abdominal obesity was positively associated with alcohol consumption in Korean adults with average ages of 44.2 (men) and 45.1 (women).
In conclusion, our study results suggest that obesity in otherwise healthy young adults is associated with disturbances in lipid metabolism and a greater risk of metabolic syndrome. Certain dietary factors, including higher fat intake and alcohol consumption, seem to be contributing to obesity in these subjects.
 XML Download