

 PDF
PDF ePub
ePub Citation
 Print
Print


Introduction
As the public's awareness increases on the high relevance between health, life style-related diseases and obesity to nutrition and dietary habits, interest in dietetic therapy for patients or food and nutrition for general consumers is gradually increasing. In particular, interest in nutritional values of food items and desire for the related information rise in case continuous dietetic therapy is necessary for weight control, diabetes, kidney diseases, osteoporosis, and children's growth. Accordingly, the necessity of a nutrient database for convenient use by general consumers is increasing.
However, the existing nutrient databases available in Korea are only for use by the experts. The nutrient contents in food items are expressed per 100 g of the edible portion of a food item [1]. Therefore, in order for general consumers to understand nutrient contents in the actual intake, it involves the difficulty of converting the contents per 100 g into those per the actual intake quantity.
In the United States (US) and Japan, the portion size for a single intake by a single person is set based on the actual intake quantities [2,3]. On the basis of this, a variety of nutrient databases are being developed and published as small booklets for convenient use by general people. Contrary to this, previous studies in Korea on the portion size for a single intake by a single person mostly used data of diet survey per household rather than individual and of diet survey in certain regions rather than a nationwide survey or were dependent on document review or experimental cooking [4-6]. Consequently, these results display differences from the actual intake quantities per individual and therefore are difficult to be applied to the actual lives of general people.
This study aimed to establish one portion size of food items frequently consumed for convenient use by general consumers in food selection, diet planning, and nutritional evaluation. For this, we selected food items of regular use by adults aged 20 ~ 64 years and analyzed the portion size based on the quantity of food intake per individual using the original data of National Health and Nutrition Examination Survey 2005 (NHANES 2005) a nationwide survey on dietary intake per 'individual' conducted in Korea [7].
Subjects and Methods
Subjects
The portion size was analyzed using the original data on 5,436 persons (60.87%) aged 20 ~ 64 years among 8,930 persons to whom NHANES 2005, a nationwide dietary intake survey per individual, was conducted [7].
Selecting food items of regular use
For food items of regular use, we selected food items consumed by the intake frequency of 30 or higher among the 500 most frequently consumed food items. Although not among the top 500, those of frequent intake supplied for foodservice operations or in restaurants were added to the food items of regular use.
Analyzing portion size of food items of regular use
Estimation of portion size for a single intake by a single person was carried out based on the portion size analysis data and methods to calculate reference values for nutrition labeling of the US [8,9]. The portion size of food items was set on the basis of the median (50th percentile) of the portion size for a single intake by a single person was analyzed. This is because median is generally used rather than the mean value as a measurement of central position since the original data of NHANES 2005 is not of normal distribution; diverse and extreme values can be eliminated and average of values measured in the units of 5 and 10 may even be subject to the problem of validity. Therefore, in this study, the portion size was based on the median and was rounded off in the units of 5 and 10 g considering the mean value and mode. Here, for items of which the quantities are less than 10 g, portion size was set in the unit of 1 g. Also, for items in liquid form, portion size was set in the unit of mL. For seasonal food items, portion size was set with the quantities used in the main season. As for food items that include bones, skin and shell, portion size was set based on the edible part.
Results
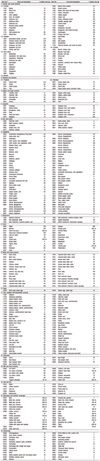
Portion size for a single intake by a single person of food items of regular use selected per each category of food items is shown in Table 1. The food items of frequent consumption were classified into 16 categories based on the food groups of Korean food composition table [1]. For convenient use by consumers, general food items were classified into the generally recognized food categories. 374 varieties of food items of regular use have been selected. These include 60 varieties of cereals and cereal products, 8 of potatoes and starches, 10 of sugars and sugar products, 12 of legumes, 9 of nuts and seeds, 74 of vegetables, 6 of mushrooms, 23 of fruits, 28 of meats and meat products, 2 of eggs, 56 of fish, shellfish and fish/shellfish products, 7 of seaweeds, 12 of milk and dairy products, 10 of oils and fats, 29 of beverages and alcoholic beverages and 26 of seasonings. In cereals, the portion size of well polished rice was 80 g. In meats, the portion size of Korean beef cattle was 25 g. Among vegetable items, the portion size of Baechukimchi was 40 g.
Discussion
Setting of taking size for a single intake by a single person may differ according to the purpose of use or guidelines such as meal planning, nutrient database, and nutrition labeling [10,11]. Taking size for a single intake by a single person is interpreted in two ways. One is as a serving size and the other is as the actual portion size. The serving size can be utilized as the guidelines of nutritional education for healthful meal planning. For example, a reference quantity recommended for a single intake in the food pyramid is the serving size. On the other hand, portion size refers to the amount individual consumers select for eating at a single intake. This may be smaller or larger than the serving size.
As such, setting portion size of food items is very important not only in terms of meal planning, nutrition education and nutrition assessment, but also in establishing the government's food policies [12]. Nevertheless, due to the characteristics of culinary culture in Korea to make most dishes by mixing a number of ingredients, it is very difficult to set the portion size of food items. Furthermore, there is yet to be any nationwide data on quantities of food intake per individual. So, almost no studies have been conducted on this subject. Several researchers have carried out studies on setting portion size for a single intake by a single person or representative recipes using the limited data available [4-6]. However, these cannot be regarded as nationwide information. In Korea, NHANES, the nationwide survey on dietary intake, was conducted in individual units for the first time in 1998 [13]. Based on the data of food intake quantities produced by this survey, Lee et al. developed the 'food composition table for convenient use by general consumers' by setting portion size of the representative food items and dishes [14]. This study is very much significant in terms of setting portion size on the basis of the nationwide data of food intake quantities for the first time. The main objective of this study was to assist consumers in conveniently and easily estimating quantities of food items consumed.
As Korean NHANES began to be conducted in a new cycle and the result of the survey in 2005 was announced [7], this study intended to select representative food items and dishes for amendment of 'nutrient database for convenient use by general consumers' using the original data of the Korean NHANES 2005 and therefore to set the portion size of these food items [15]. While 314 varieties of representative food items respectively were used in the study by Rural Development Administration [14], approximately 60 varieties of food items were added in this study, which was conducted on 374 varieties of food items. Although it is difficult to compare portion size of all food items and dishes against those of the previous studies, there was no change in the portion size of white rice (80 g). As mentioned, the Korean Nutrition Society has set the serving size for a single intake by a single person of white rice as 90 g [16]. Therefore, the result and use are different from those of this study.
In the US, portion size has continuously increased over the last 30 years. This is being pointed out as one of the causes of the increase in the obese population [17,18]. Accordingly, it is necessary in Korea to conduct NHANES on a periodical basis, to announce the results and to continuously conduct studies on setting the portion size of the food items of regular use in the future. As data builds up, it will also be necessary to conduct studies to compare and analyze the data.
In this study, we selected food items of regular use by adults aged 20~64 years using the data of Korean NHANES 2005 and therefore set and reported the portion size of these food items. For portion size of food items of regular use set in this study, life-sized photographs and nutritive values of food items per portion size for a single intake by a single person have been added to enhance usefulness of the data. With this, the 'food composition table for convenient use by general consumers' of 2009 was published [15]. These data and the results of this study will be conveniently and effectively used by general consumers in making food selections for a nutritionally balanced diet. In addition, these will be used as the basic data in setting the serving size for a single intake by a single person in meal planning, single intake quantities in nutrition labeling of processed food items and quantities for a single meal supply outside homes, which are the national nutrition education guidelines.
 XML Download