

 PDF
PDF ePub
ePub Citation
 Print
Print


Introduction
The goals of hospital foodservice are to provide in-patients with nutritious meals for their recovery and health and to present them with a nutritional model with meals tailored to their specific health conditions. When meals are carefully planned and served and when patients consume what they are served, the goals can be achieved [1,2]. Hong, Kirk [3] stated that meal consumption of in-patients was a good indicator of dietary status and satisfaction with meal service. Furthermore, foodservice quality is known to influence patients' satisfaction with hospital stays [4,5].
Since the health care industry is becoming more competitive and patients are becoming more discriminating about quality, the health care industry has redefined patients, recognizing them as customers [6,7]. The competitive environment has forced dietitians to provide higher-quality foodservice with limited resources. As Parasuraman et al. [8] asserted, quality is "an elusive and indistinct construct" and is not an easy one to define. The American Society for Quality [9] defines quality in two ways: "the characteristics of a product or service that bear on its ability to satisfy stated or implied needs and a product or service that is free of defects." In service marketing literature, service quality is conceptualized as service meeting customers' expectations [10]. Considering these definitions of quality and the goals of hospital foodservice departments, hospital foodservice quality can be defined as foodservice that meets nutritional requirements of in-patients.
Even with the established definition, improving foodservice quality in hospital settings remains as a difficult challenge. Since foodservice encompasses both tangible and intangible aspects, quality improvement for foodservice should involve various components including menu items, quantities of food, tray presentation, sanitation, and service [11,12]. It has been reported that in-patients evaluate foodservice quality based on various factors including taste, nutrition, sanitation, temperature, portion size, meal time, and servers' attitudes. Among the various factors, food temperature, service, meal time, food taste, portion size, menu selection, offering nutritional information, responsiveness to food problems, menu variety, and sanitation were evaluated negatively [2,11,13-15].
Most research in hospital foodservice quality, to date, has focused on patients' expectations, perceptions of performance, and satisfaction. Although it is the patients who define and evaluate quality, findings based on patients' surveys do not provide rich enough information on what causes quality problems or what foodservice professionals have to do in terms of quality improvement. Hospital foodservice is a system where subsystems, including procurement, production, distribution/service, and safety/sanitation, are interrelated [16]. Thus, a decision in one part can influence another part of the system, and quality should be managed in an integrated way.
Parasuraman et al. [8] presented their Service Quality Model for investigating problems related to service quality management and identifying causes of the problems. According to the model, service quality management is the process that maintains a balance between customers' expectations and perceptions of service quality and minimizes the discrepancy between the two. The gap between expectation and perception is a service problem that results from four other gaps on the service provider's side. Parasuraman et al. [8] stated that a service manager should identify causes of the four other gaps on the side of the service provider and develop strategies to reduce the gaps to improve service quality.
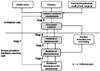
To better understand hospital foodservice quality management, the Service Quality Model [8] was modified to reflect the hospital foodservice environment based on the review of literature. The modified Service Quality Model was named "Hospital Foodservice Quality Model" (Fig. 1). For this study, hospital foodservice quality was defined as "foodservice meeting patients' nutritional requirements" based on the review of literature and the modified model. The purposes of the study were to evaluate hospital foodservice quality and to identify causes of quality problems and improvement strategies for hospital foodservice quality using the new model.
Subjects and Methods
The study was conducted in two steps to assess hospital foodservice quality and to identify the causes of the quality problems and improvement strategies.
Step 1: Assessment of hospital foodservice quality and identification of critical control points of hospital foodservice management
Three general hospitals, two located in Seoul and one in Chon-An, were selected for the study. Data were collected over 3 randomly selected days (2 weekdays and 1 weekend day) between March 2007 and May 2007. Regular, diabetic, and low-sodium diets were studied. Nutritional standards for each diet were determined by the diet manuals of the hospitals, and planned menus and recipes for the selected diets were obtained from the hospitals. Served and consumed meals were measured using a weighed plate method.
A total of 516 in-patients (373 for regular diet, 106 for diabetic diet, and 37 for low-sodium diet) were selected randomly and served meals on different colored trays. Since diabetic diets varied by energy levels, different colored stickers were placed on the bottoms of the trays to distinguish energy levels. Before the meal trays were delivered to the patients, three trays were randomly chosen for each diet type and the menu items were weighed. An obtained average weight of the items was considered as a portion size. At the end of the meal time, foodservice staff collected the selected trays and scraped menu items remaining on the trays into separate containers. Dietitians measured the collected plate waste and divided the weight by the number of the trays collected to calculate the average plate waste for each menu item. Average consumption by patients was calculated by deducting the average plate waste from the portion size.
Average consumption (g) = portion size (g) - average plate waste (g)
It was assumed that the patients consumed all milk and fruits served since many patients ate them as snacks even though they were served with meals. Nutrient contents of the each menu item and meals planned, served, and consumed were calculated using CAN Pro (Ver 3.0). The nutrients analyzed included energy, carbohydrates, protein, and fats, which were specified on the diet manuals of the hospitals. Then the gaps in the Hospital Foodservice Quality Model were calculated by percentage and the problematic gaps were determined as critical control points (CCPs).
Step 2: Identification of quality hazards and corrective actions at ccps of hospital foodservice quality management using a case study
To investigate causes and control measures of quality problems at the identified CCPs, a case study was conducted in Hospital A. First, a total of 14 menu items were selected based on the characteristics of the ingredients and preparation methods. The selected menus were cooked rice, rice gruel, seaweed soup, Chinese cabbage soup with perilla seeds, egg custard with imitation crab meats, braised beef shank, broiled salted mackerel, sautéed beef and shiitake mushrooms, chicken salad, mini tofu and veggie burgers, seasoned fresh bellflower roots, seasoned spinach, soy sauce glazed konyak and sea tangles, and fried vegetables.
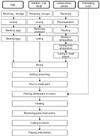
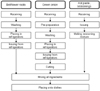
For each menu item, then, a process flow diagram was drawn and production processes were observed and recorded by researchers. Examples of the process flow diagrams are presented in Fig. 2 and Fig. 3. The process included all steps - receiving, storage, pre-preparation, preparation, portioning, tray assembly, holding, and meal service. Finally nine dietitians including two manager-level dietitians, five clinical dietitians, and two dietitians) were interviewed about the causes of the gaps and strategies for decreasing the gaps were discussed. The working experiences of the dietitians ranged from less than 1 year to longer than 25 years (one for longer than 25 years, one for 10-25 years, one for 5-10 years, four for 1-3 years, and two less than 1 year).
Results
General characteristics of the dietary departments
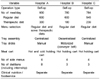
General characteristics of the participating dietary departments are presented in Table 1. In Step 1, three hospital dietary departments participated in the study and one of them (Hospital A) participated in the study in Step 2. In all the hospitals, foodservice was self-operated. Selective menus were available for regular and some therapeutic diets in Hospital A whereas selective menus were available only for the regular diet in Hospitals B and C. In Hospitals A and C, tray assembly was centralized but Hospital B used a decentralized tray assembly system. To maintain appropriate meal temperatures during distribution, Hospital A used hot and cold holding carts, but Hospitals B and C used hot holding carts. All hospitals served four side dishes (excluding rice and soups/stews). A clinical nutrition division operated independently of the foodservice management division at each hospital.
Assessment of hospital foodservice quality and identification of critical control points of hospital foodservice quality management (Step 1)
According to the Hospital Foodservice Quality Model (Fig. 1), five different gaps in hospital foodservice quality exist. Gap 5 is the discrepancy between nutritional requirements and nutrient consumption of in-patients, which has significant bearing on hospital foodservice quality as defined in the study. If the nutrient contents of the meals consumed by the patients are equal to their nutritional requirements, the hospital foodservice quality is considered good. If patients consume more or less than their nutritional requirements, however, the foodservice has quality problems. Since the sizes and directions of Gaps 1-4 determine Gap 5, Gap 5 is a function of the other four gaps in the model (Fig. 1).
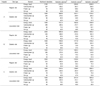
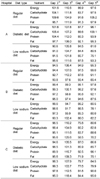
Nutritional standards (specified on diet manuals), nutrients of planned menus and served meals, and nutrients consumed are presented in Table 2. The gaps calculated based on the results are shown in Table 3. In terms of Gap 5, protein consumption of patients on a regular diet and carbohydrate consumption of the patients on a diabetic diet met nutritional requirements, but energy, carbohydrate, and protein consumption of patients on a low-sodium diet were less than 90% of the requirements in Hospital A. In Hospital B, fat consumption of patients on regular and diabetic diets, and energy, carbohydrate, protein, and fat consumption of patients on low-sodium diets were below 90% of the nutritional requirements. In Hospital C, patients consumed only 70-90% of the required energy, carbohydrates, protein, and fat (with the exception of protein consumption by patients on diabetic diets and fat consumption by patients on low-sodium diets). In particular, fat consumption by patients on regular and diabetic diets met 70 and 75% of the requirements, respectively.
Next, Gaps 2, 3, and 4 were examined to determine the causes of the foodservice quality problems (Gap 5). Hospital dietary departments should provide different types of meals that, with limited resources, meet the various nutritional requirements of the patients. Diet manuals are therefore used in hospitals to standardize nutrition management and to help dietary departments perform in an economical and efficient way. Doctors place orders and dietitians plan menus based on the diet manuals. Gap 1 occurs when a doctor places inappropriate diet orders (Fig. 1). Since Gap 1 is beyond the control of the dietary departments, it was determined that the research was limited to Gaps 2-5. Thus, nutritional requirements of the patients were assumed to correspond with the nutritional standards in the diet manuals (Gap 1 = 0).
Gap 2 is the discrepancy between nutritional standards on diet manuals and nutrient values of planned menus (Fig. 1). In Hospital A, planned menus for regular diets provided 102-110% of nutritional standards for energy, carbohydrates, and protein, but 96% of the standard for fat (Table 3). Planned menus for the diabetic diet provided 98-105% of the nutritional standards for all the nutrients and the discrepancies were considered acceptable. Planned menus for the low-sodium diet, however, did not meet the nutritional standards specified on the diet manual for energy, carbohydrates, protein, and fat. In Hospitals B and C, the nutrients of the planned menus for regular, diabetic, and low-sodium diets did not meet the nutritional standards on the diet manual, but the differences were less than 10% of the nutritional standards.
Gap 3 was determined by comparing nutrients on the planned menus with meals provided to the patients (Fig. 1). In Hospital A, more nutrients were provided than planned nutrients for regular, diabetic, and low-sodium diets. Most significantly, patients on the regular diet were served more than 110% of the planned standards for energy, carbohydrate, and fat. In-patients on diabetic and low-sodium diets were served 112% of their protein and fat planned, respectively.
In Hospital B, the fat levels of the regular diet; energy, protein, and fat levels of the diabetic diet; and energy, carbohydrate, and protein of the low-sodium diet did not meet the planned nutrient standards, but the rate of discrepancy was less than 10%. Hospital C provided more energy, carbohydrates, protein, and fat than the planned for all diet types. Protein and fat served on the regular diet, protein served on the diabetic diet, and protein and fat served on the low-sodium diet all amounted to more than 110% of the planned standards.
Gap 4, the discrepancy between nutrients served and consumed, was the biggest gap in all three hospitals. Except those on regular and diabetic diets in Hospital B, all patients consumed less than 90% of the nutrients they were served. Big discrepancies were found in the low-sodium diets of all three hospitals, which indicated low meal acceptance by patients. Patients on the regular diet in Hospital C consumed only 59% of the fat they were served.
As an accumulative result of the discrepancies at Gaps 2-4, the patients did not consume the nutrients they needed. To decrease the quality problem and improve hospital foodservice quality, dietary departments should control Gaps 2 through 4, which determine Gap 5. When considering the adverse effects on Gap 5, Gap 3 and Gap 4 were determined to be critical control points (CCPs) in hospital foodservice quality management. The efforts of the dietary departments should be focused on these.
Identification of quality hazards and corrective actions at critical control points of foodservice quality management using a case study(Step 2)
A case study was conducted in Hospital A to identify causes of hospital foodservice quality problems and improvement strategies at the CCPs identified in Step 1 (Gap 3 and Gap 4). The causes of the gaps were qualified as "quality hazards" since they caused deterioration in hospital foodservice quality. The improvement strategies were labeled as "corrective actions" for the purposes of this study.
Quality hazards and corrective actions at gap 3
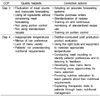
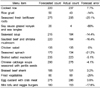
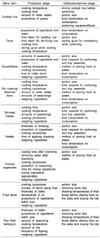
Gap 3 occurred because patients were not served the meals that dietitians planned based on diet manuals. A process analysis and interviews with dietitians revealed various quality hazards at Gap 3 (Table 4). The first quality hazard was fluctuation of quantity demands and inaccurate forecasting. Errors in forecasting differed by menu item (Table 5). The highest error rate (80%) applied to the soy sauce glazed konyak and sea tangles, which was in little demand. Inaccurate forecasting was also a problem for seasoned fresh bellflower roots, fried vegetables, and seasoned spinach. On the other hand, no forecasting error was found for chicken salads. Accurate forecasting was also performed for braised beef shank, Chinese cabbage soup with perilla seeds, and broiled salted mackerel (Table 5). The establishment of an accurate forecasting system was identified as a corrective action for this quality hazard.
The second quality hazard at Gap 3 related to the food production process. It was observed that foodservice staff used all food ingredients received on the production day without considering standardized recipes or dietitian's planned quantities. To correct the problem, dietitians should order the required amounts of ingredients based on forecasted meal demands and the foodservice staff should be trained to follow production plans (Table 5).
The third quality hazard also related to the production process. The process analysis revealed that cooking times and temperatures, amount of water added, preparation procedures, and cooking equipment all influenced quality and total yields of end-products (Table 6). Even though standardized recipes were available at the hospital, the foodservice staff did not use the recipes. To prevent this quality hazard, dietitians should make an effort to improve standardized recipes and provide foodservice staff with education and training on how to use standardized recipes. Use of standardized recipes should be emphasized continuously.
The last quality hazard at Gap 3 was lack of portion control. The foodservice staff did not conform to specified portion sizes. As a corrective action, it was noted that foodservice staff should be trained on the importance of portion control and how to comply with portion sizes. To make portion control easier, staff must be provided with proper equipment and tools.
Quality hazards and corrective actions at gap 4
Gap 4 resulted from patients not eating what they were served. The quality hazards and corrective actions at Gap 4 are presented in Table 4. The quality hazards at Gap 4 were menus with low preference, inconsistency of menu quality, a lack of menu variety, and improper food temperature. Patients not understanding their nutritional requirements were another quality hazard.
Corrective actions for the quality hazards included periodic patient surveys, meal rounding, menu development, and more opportunities for menu selection (Table 4). In addition, dietitians should test product quality before serving meals to the patients and to maintain food temperatures during distribution. Finally, patients should be provided with information about their diets and educated on the importance of their diets to their health and recovery. They need to understand the importance of consuming the provided meals.
Discussion
In this study, hospital foodservice quality was defined as "foodservice meeting patients' nutritional requirements" and measured by the discrepancies between patients' nutrient consumption and their nutritional requirements. In evaluating Gap 5, it was discovered that patients consumed 80-90% of their nutritional requirements, which means problems existed in hospital foodservice quality. Previous research also reported that more than 90% of in-patients experienced protein-energy malnutrition and weight loss [17,18] and that the problems resulted from poor monitoring of nutritional status, inadequate nutrient intake prior to and following admission, and influences of diseases [19,20].
Using a plate waste study, Yang et al. [21] found that diabetic patients did not consume RDAs for energy, protein, calcium, iron, and vitamins B1 and B2 during hospital stays. Energy and protein consumptions were at 85-96% and 85-87% of the RDAs, respectively, which proves similar to the result of this study. Yang et al. [22] also reported that patients on a regular diet consumed 97.7% and 118.5% of RDAs for energy and protein, respectively. However consumption of calcium, iron, and vitamin B2 were all less than the RDAs. In the same study, patients served a soft diet did not consume the RDAs for energy, calcium, iron, vitamin B2, and niacin.
The nutrients of the planned menus met 90-110% of the nutritional standards on the diet manuals in the three hospitals. Although the discrepancies seemed small, they should not be ignored. The nutrients of the planned menus in Hospitals B and C, in particular, did not meet the nutritional standards for any of the diets. A planned menu is one of the most important controls in foodservice [16,23]. Since the planned menus play a role as standard in evaluating meals served to in-patients, careful menu planning should be emphasized and an evaluation process of the menu planning should be followed.
The bigger discrepancies were found at Gap 3 and Gap 4. More nutrients than planned were provided for in-patients in Hospitals A and C, and more than 110% of planned amounts of some nutrients were provided. On the other hand, a few nutrients provided in Hospital B did not meet the planned nutrient amounts. Since the planned menus did not comply with the nutritional standards specified on the diet manual for diabetic and low-sodium diets in Hospital B, the accumulative discrepancies lead to patients not being served the nutrients they required. Patients on diabetic and low-sodium diets in Hospital B could not consume what they needed even though they ate everything they were served.
The quality hazards identified at Gap 3 were fluctuations among meal demands and a lack of control during production and portioning. The fluctuation of meal demands is natural in hospital settings, due to the continuous admission and discharge of the patients, the order of NPO (nothing by month), and changes in diet orders. The dietary departments should try to improve the accuracy of forecasting systems since over- and underproduction create managerial problems and affect the bottom line of the foodservice departments [16]. Overproduction increases waste of food ingredients, energy and utilities, and labor, while underproduction results in increased costs, patient dissatisfaction, and job stress on the employees [16,23].
Accuracy of the forecasting seemed to be influenced by menu preference and quantities of the meals produced. Demand data were likely to be accurate for highly preferred or in-demand menu items. However, large deviations in forecasts were found for seasoned spinach and stir-fried beef and shiitake mushroom, even though they were in demands. Observation revealed that these two items were side menus for liquid diets. Diet order changes after surgery, from a liquid diet to a soft diet, and then to a regular diet, were the root of the deviations. Accurate forecasting should be more strongly emphasized as more hospitals provide selective menus in the increasingly competitive health care industry.
The major quality hazard at Gap 3 was a lack of production control. Due to the lack of control during production, the meals produced did not conform to quality and quantity standards set by dietitians. Control is defined as "the process of ensuring that plans have been followed" [16]. Control includes comparing what was planned (standards) with what was done and taking any necessary corrective actions [16]. During food production, both quality and quantity are objects of control. Quantity control means preparing the amount needed and quality control means assuring consistency in served meals.
In Hospital A, purchase orders were placed 3-4 days prior to production, based on forecasts. Then, on production day, dietitians provided foodservice staff with a new forecast as part of a production plan. It was observed, however, that the foodservice staff did not consider the new meal count forecast and rather used all ingredients that were received on a given day, which resulted in overproduction. Kim et al. [24] also reported that hospital foodservice staff did not measure ingredients using measuring equipments and did not use the standardized recipes during production.
To correct the problem, standardized recipes should be used. All recipes should be standardized and management should educate foodservice staff on, and encourage them to use, standardized recipes. In particular the standardization of recipes and use of standardized recipes should be emphasized for the preparation of therapeutic diets. Kim et al. [24] reported that foodservice staff did not control quantities of sodium, protein, or potassium in the diets of patients with renal failures, despite the critical nature of the nutrient components to such diets.
Room for improvement was found in portion control. Instead of using measuring tools and portioning specified amount, staff tended to determine portion sizes based on meal counts and total yields. Kim et al. [24] also found a similar phenomenon. Portioning should be strictly controlled since patients perceive meals served in hospitals as a model for a healthy diet that they could follow even after discharge [25]. Therefore, education on the importance of portion control and portioning methods should be provided for foodservice staff.
Gap 4, measured as the discrepancy between provided nutrients and consumed nutrients, was the biggest and negative in direction. In Hospital A, more nutrients were served to patients than planned, but the patients did not consumed all they were served. Therefore, they consumed less than their nutritional requirements with the exception of a few nutrients. In Hospital B, patients did not consume their nutritional requirements either. Nutrient consumption by patients on low-sodium diet in particular met less than 80% of nutrient requirements. In Hospital C, patients on regular diets consumed only 70% of fat served. Thus patients' meal acceptance seemed to be low. In a survey study conducted in Hospital A, B, and C, patients on the regular diet responded that they consumed 72%, 69%, and 68% of cooked rice, soups, and side dishes they were served [2]. The patients on the diabetic and low-sodium diets were reported to consume less than 70% of the cooked rice, soups, and side dishes served [2]. Jung [26] also reported that in-patients consumed 70% of the meals served.
Dupertuis et al. [27] asserted that in-patients did not consume adequate nutrients even though they were provided for adequately and only 36.7% of in-patients with long hospital stays (longer than 46 days) ate more than 50% of the meals they were served [28]. Yang et al. [21,22] reported that 30%, 50%, and 16.4-27.1% of the meals served were not consumed and ended up as plate waste for regular, soft, and diabetic diets, respectively.
Gap 4 resulted from menus not reflecting patients' preference, inconsistency of food quality, a lack of menu variety, and improper food temperatures. Patients also did not understand their nutritional requirements. According to surveys done on in-patients, patients did not eat what they were served because they did not have much strength, they had no appetite, the foods were not tasty, or too much food was served [1,2]. The most frequent response was, "I do not have much strength," for regular diets, and "the foods were not tasty," for therapeutic diets [2].
To decrease the discrepancy at Gap 4, periodic patient surveys, menu development, meal quality management, more food choices, and meal rounding were proposed. Meal tests conducted by dietitians prior to service and temperature control were also necessary. Kim et al. [29] reported that plate waste of soups was primarily due to improper temperatures and Kim et al. [2] also reported that patients on therapeutic diets evaluated food temperatures and consistency of taste as poorer than those on regular diets did. However, Yang et al. [22] asserted that food taste and temperatures were not significant predictors of consumption rate for regular diets and plate waste was correlated positively with portion size, but negatively with menu preference. Bigger discrepancies found for the low-sodium diet at Gap 4 suggested that menu development was important for increasing consumption of the low-sodium diet. Menus should be evaluated and updated continuously to reflect the changes of the patients' preferences and foodservice trends.
Other researchers found that food quality was not the only cause of low consumption in hospitals. McLymont et al. [30] reported that some patients did not eat because they slept or left the beds for medical tests during meal times. Even though they were allowed to request late trays, they did not want to bother others. Recently, new delivery systems including spoken menus and room service have been successfully introduced to improve satisfaction with foodservice and to increase patients' meal consumption in hospitals [31-33]. Under the spoken menus, called "menuless restaurant style service", patients order their meals 1-2 hours prior to meal time instead of selecting a menu the day before service. Polio et al. [32] reported that the spoken menu concept increased overall patient satisfaction and tray accuracy without cost increases. In addition, more patients perceived that the quantity of food was enough after the spoken menu system was implemented.
A room service program allows patients to eat the meal they want when they want it. The room service system is expected to be more prevalent in US hospital settings in the near future [31]. Advantages of the room service model include more food choices, decreased plate waste, patient empowerment, and improved food quality. However, the room service system also involves a disadvantageous increase in labor costs [5]. Considering the results, introducing a new delivery system can be a corrective action.
Kim et al. [2] reported that consumption of cooked rice was higher amongst the in-patient groups that received nutrition education (P < 0.05) and an explanation of therapeutic diets. Yang et al. [21] reported similar results. According to Gam et al. [34], approximately 80% of surveyed patients expected dietitians' meal rounds once or twice a week. Along with serving the patients well planned meals, dietary departments should conduct basic nutrition management and provide nutrition education and counseling services. Nutrition education and counseling will help patients understand relationship between diets and their diseases and the importance of consuming all foods they are served.
Improving hospital foodservice quality is complicated since hospital foodservice includes both tangible and intangible aspects and foodservice is a system where subsystems including procurement, production, distribution/service, and safety/sanitation are interrelated. Therefore, quality improvement strategies should be developed from a holistic point of view. This was the first attempt at investigating hospital foodservice quality at all stages, from menu planning to meal service.
To date, one of the most serious quality hazards, a lack of control has been overlooked in foodservice quality management. Foodservice professionals in hospitals can be compared with engineers in manufacturing factories. Engineers continuously research, plan, and manage production processes to improve quality of products and efficiency of processes. Once dietitians set goals and standards by planning menus, they should manage and control the processes to a point where the goals are met. Foodservice staff should be trained and empowered as valued team members in hospital foodservice quality management. Communicating with patients should be bi-directional, which involve dietitians listening to patients' voices and helping patients understand their nutritional requirements. The findings of this research can be used to strengthen the competitive edges of dietary departments in the health care industry. A process analysis for quality control during production and process improvement will be the next research topics.
 XML Download