

 PDF
PDF ePub
ePub Citation
 Print
Print


Introduction
Oxidative stress induced by high glucose concentration plays a central role in complications of diabetes (Medvedeva et al., 2002), though it is not clear yet whether increased oxidative stress has a primary role in the pathogenesis of diabetic complications, or it is simply a consequence of them (Miranda et al., 2007). Oxidative stress induces the production of highly reactive oxygen radicals that are toxic to cells and has been attributed to protein glycation and/or glucose auto-oxidation owing to a hyperglycemic environment (Kesavulu et al., 2001). Oxygen radicals also interact with the lipid bilayer and produce lipid peroxides particularly in cell membranes (Haygaard, 1968; Miranda et al., 2007). Lipid peroxidation of cellular structures is thought to play an important role in atherosclerosis and late complications of diabetes (Kesavulu et al., 2001). Hence, it is likely that a substance known to reduce hyperglycemia and oxidative stress in vivo would reduce progression of cell damage in clinical diabetes. Although controlling blood glucose level is the most important approach in the management of complications of diabetes, abnormalities in lipid metabolism are known to contribute to the pathogenesis of progressive renal disease (Feldt-Rasmussen et al., 1986). Change in the plasma lipid concentration is a frequent complication in patients with diabetes mellitus (Hartnett et al., 2000; Howard et al., 1978; Nikkila & Kekki, 1973; Qureshi et al., 2002). The important role of lipid abnormalities in the pathogenesis of glomerular injury is understood by the almost invariable presence of hyperlipidemia in patients with renal disease (Babu & Srinivasan, 1999; Moorhead, 1991).
Onion (Allium cepa. Linn), commonly used in our daily diet, has been extensively studied for its therapeutic uses. Onion oil has been reported to effectively decrease the lipid levels in experimental animals (Bordia et al., 1975; Bordia et al., 1977). It also has flavonoids, such as quercetin and quercetrin, which have antioxidant and anticancer effects (Carson, 1987; Reddy et al., 1993). Aqueous extraction of onion showed an antithrombotic effect in stretozotocin (STZ)-induced diabetic rats (Jung et al., 2002). However, there is a little information about the effect of onion on the complication of diabetes.
The present study was designed to extend the current information on the hypoglycemic and hypolipidemic effects of onion as well as to determine its effects on renal antioxidant enzyme systems in diabetic rats to establish the mechanism of the anti-diabetic effects of onion.
Materials and Methods
Animals
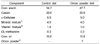
Weanling male Sprague-Dawley rats (180~230 g) were purchased from Samyouk Animal Center (Seoul, Korea). The animals were housed in the cages under standard conditions (12:12 h light/dark cycle, 50% relative humidity at 21℃) and given free access to a semi-purified diet (Table 1) and water. After 7-d acclimation, experimental diabetes was induced by a single intraperitoneal injection of streptozotocin (Sigma) in citrate buffer at a dose of 60 mg/kg body weight. Blood samples were obtained from the tail vein of the animals at 72 hours after STZ injection and fasting blood glucose levels were determined. Rats with fasting blood glucose levels above 250 mg/dl were used as the diabetic animals. Just after STZ injection, two groups of diabetic rats and two groups of normal rats in parallel were fed experimental diet and maintained on the diets for 5 weeks. The onion-supplemented diet was made of 7% of freeze-dried onion powder added into control diet (Table 1). Food and water consumptions were measured every day and weight gain was measured every week. At the end of 5 weeks, the animals were decapitated after overnight fasting and the kidneys were quickly excised and processed for enzyme assays.
Blood glucose and serum lipids
Blood glucose was measured from the blood of all the animals, taken from the tail vein using a kit (Medisense 2, Korea) every week. The concentrations of serum total lipid, total cholesterol, HDL-cholesterol and triglyceride were determined using a commercial kit (Asan, Korea) at the end of the experiment. Atherogenic index and HDL-cholesterol / total cholesterol ratio were calculated from the data.
Antioxidant enzyme activities in kidney
An appropriate portion of kidney was homogenized in ice-cold Tris buffer, pH 7.4. The homogenates were centrifuged at 12,000xg for 20 min at 4℃, then again at 105,000xg for 1hr at 4℃. The supernatant (cytosol) was used for measuring the activities of glutathione peroxidase (Tapple, 1978), glutathione reductase (Carlberg & Mannervick, 1985), and glutathione S-transferase (Habig et al., 1974). Glucose 6-phosphatase activity (Banginski et al., 1983) and TBARS contents were measured in the microsome. Protein content was measured according to the Lowry method (Lowry et al., 1951).
Results
Body weight, food intake and water intake
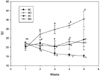
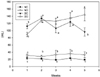
Diabetic rats fed the control diet showed no significant difference in food intake compared to normal rats. However, the food intakes of diabetic rats supplemented with onion were significantly higher than those of other groups (Fig. 1). Diabetic rats showed low body weight gain regardless of diet. Onion increased the feed efficiency ratio in the diabetic rats, even though it was still lower than those of normal groups (Table 2). Water intakes of the diabetic rats were higher than those of the normal rats. Onion did not show any appreciable influence on the water intakes in the diabetic animals (Fig. 2, Table 2).
Fasting blood glucose and serum lipids
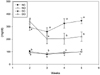
Levels of fasting blood sugar in the diabetic rats were significantly higher than those of the normal rats throughout the experimental period. Blood glucose in the diabetic rats supplemented with onion became lower when the rats had been fed onion for 3 weeks and was significantly lower than that of diabetic rats fed the control diet at the end of experiment (Fig. 3).
Onion did not affect serum total lipid, triglyceride and HDL-cholesterol in the normal rats. HDL-cholesterol/total cholesterol ratio and atherogenic index of the normal rats were also not affected by onion. Serum total lipid, triglyceride, total cholesterol and atherogenic index of the diabetic rats fed control diet were increased by 235%, 275%, 136% and 146%, respectively compared to normal rats. However, serum total lipid, triglyceride and the atherogenic index of the diabetic rats were decreased by onion and not significantly different from those of normal rats fed the control diet (Table 3). Serum total cholesterol of the diabetic rats was decreased by onion but not significantly different compared to diabetic rats fed the control diet (Table 3).
Renal antioxidant enzymes and TBARS content
Diabetes induced high activities of glutathione peroxidase (GPx), glutathione reductase (GR) and glutathione S-transferase (GST) in the rats fed the control diet (Table 4). Increased activities of these enzymes in the diabetic rats were significantly decreased by onion. TBARS content and glucose 6-phosphatase (G6Pase) activity showed no difference between the control and the diabetic rats.
Discussion
Streptozotocin (STZ) induced diabetes in animals caused weight loss due to abnormal carbohydrate and lipid metabolism and increased catabolism of protein. For this reason, weight reduction is being used as a marker of diabetes mellitus induced by STZ (Ghosh et al., 1994). In the present study, onion decreased weight loss in the diabetic rats by the increase of feed efficacy ratio. Onion did not show any appreciable influence on the water intakes in the diabetic animals.
Hyperglycemia can induce lipid peroxidation and thereby atherosclerosis (Medvedeva et al., 2002). It also induces gene expression of angiotensinogen in the kidney and insulin receptor resistance (Zhang et al., 2000). In the present study, onion significantly decreased blood glucose in the diabetic rats. Onion might play an important role to prevent complications of diabetes by maintaining blood glucose.
We observed onion lowered serum lipids in the diabetic rats. The lowering effect on serum lipids in the diabetic animals might be associated with a good glucose control by onion. A good glucose control was reported to improve the parameters of serum lipid profile in patients with diabetes mellitus (Medvedeva et al., 2002). Onion itself was also reported to have a serum lipid lowering effect in hyperlipidemic experimental animals (Bordia et al., 1975; Bordia et al., 1977; Carson 1987). Serum lipid lowering effect of onion can be one of the mechanisms of anti-diabetic effects and contribute to the prevention of diabetic nephropathy. Hyperlipidemia is a risk factor for declining kidney function in patients with diabetic nephropathy (Bordia et al., 1975). It was also reported that patients with low serum cholesterol concentration exhibited a lower degree of kidney lesions than those with high serum cholesterol concentration (Mulec et al., 1990).
The increase of free radical mediated-toxicity is well documented in clinical diabetes (Nourooz-Zadeh et al., 1997) and STZ-induced diabetic rats (Wohaie & Godin, 1987). Diabetes-induced changes in antioxidative defense enzyme activities are known to be tissue specific (Irizar & Ioannides, 1995; Obrosova et al., 1998). In the kidney, SOD, GPx, GR, and GST, but catalase, appeared up-regulated in short term diabetes, which is consistent with a number of reports (Irizar & Ioannides, 1995; Kakkar et al., 1997; Mak, 1996). Glutathione related antioxidant enzymes such as GPx, GR, and GST are the most important enzymes of the cellular antioxidant system (Dincer et al., 2002). In the present study, enzyme activities of GPx, GR and GST in the kidneys were increased in diabetic animals. GPx activity might be increased in response to increased oxidative stress. TBARS content showed no difference between the control and the diabetic rats in the present study. It might be correlated to increased GPx activity. Kakkar et al. (1997) reported that increased GPx activity was observed in the 2nd, 3rd, and 4th weeks with progression of diabetes and correlated to the lack of rise in TBARS levels at this period. Most of the diabetes-induced changes were reverted to near normal values by onion in this study. The possibility that modulation of the hyperglycemic status by onion contributed to the amelioration of renal lesions cannot be ruled out. Another possibility is that onion itself acted as an antioxidant and could attribute to the amelioration of free radical induced toxicity in the diabetic kidneys. A variety of sulfur-containing compounds and their precursors are the main compounds, which attribute to the antioxidant activity of Allium plants (Nuutila et al., 2003). In addition to sulfur-containing compounds, onion has a large amount of quercetin, which has antioxidant effects (Jung et al., 2002; Reddy et al., 1993). Therefore, we can conclude that oxidative stress was induced in the kidneys of diabetic animals and effectively prevented by onion.


 XML Download