

 PDF
PDF ePub
ePub Citation
 Print
Print


Introduction
The prevalence of obesity among children has increased dramatically in recent years in the developed countries. Currently, the increase in being overweight among children is also a growing concern in Korea (Ha, 2007). The proportion of Korean children aged between 10 and 12 who are either overweight or obese is over 20% (Kim et al., 2001; Yoon, 2002). In addition, the prevalence of obesity has increased by 6.4 times in boys and 4.7 times in girls from 1979 through 1996 (Kang et al., 1997).
The dietary causes of obesity are complex and poorly understood. Although energy intake and eating patterns have been implicated in obesity (McDonald et al., 2009; van Horn et al., 2005), few attempts have been made to identify patterns of beverage consumption in this regard. Recently the energy intake from beverages, especially sweetened beverages has increased among children (French et al., 2003; Nielsen & Popkin, 2004; O'Connor et al., 2006). A few studies showed that high intakes of fruit juice and soft drink have been associated with being overweight among children (Dennison et al., 1997; Ludwig et al., 2001). Investigators have asserted that the displacement of milk with carbonated drink in children might lead to excessive energy intake, which may be contributing to childhood obesity (Harnack et al., 1999; Lambert et al., 2005; Marshall et al., 2005). Recently, beverage consumption, including soft drinks, has also increased among children of school age in Korea (Chung et al., 2004).
In most beverage consumption studies, data are collected in only a few days or one season of a year because the burden on participants and the costs for researchers are very high. The climate of the two seasons, especially summer and winter are clearly different in Korea, therefore, food and beverage consumptions might be different between the two seasons (Kim et al., 2001; Yang et al., 2007). However, the seasonality influences on beverage consumption in elementary students has rarely been investigated in Korea. Gender differences may exist in the views on the preference and choices in beverage consumption (Her et al., 2008; Kang et al., 2006). Boys are more likely to drink milk than girls, who in turn are more likely to drink a juice (Park & Bae, 1999). However, relatively little is known about the effect of gender differences on beverage consumption patterns in elementary school children. Eating habits begin to be established, but are still not permanent in elementary school children. That is why nutrition education during the school years is believed to be an effective method of developing a nutritionally informed adult. A better understanding of the status of beverage consumption is needed for nutrition education to reduce sweetened beverage intake in children. Hence, the purpose of this study was to examine the beverage consumption patterns in relation to seasonal and gender differences in elementary students.
Subjects and Methods
Subjects
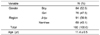
As shown in Table 1, a total 160 subjects aged 11.4 participated in this study. They consisted of 84 boys (52.5%) and 76 girls (47.5%). All subjects were grade 5 and recruited from two public elementary schools located in urban and suburban areas of Gyeongnam (Jinju city and Namhae). In this longitudinal study, surveys were carried out two times from November 2005 to February 2006, for the winter season and from June to July 2006, for the summer season.
Beverage intake and classification
Data of beverage intake was collected using a quantitative food frequency questionnaire (FFQ) that assessed beverage consumption during the previous 4 weeks. The FFQ contained 28 beverages which were commonly drunk by Koreans. Eight frequency categories ranged from, never in the past 4 weeks, to more than two times per day; each category was subsequently converted to total daily drinking moment. The respondent was also asked to describe the amount of his or her usual intake. One glass measuring cup (200 ml) and a can (365 ml) for soft drinks were used to help participants estimate beverage portion size. The number of drinking moments per month and the amount per drink were entered into a computer database, which multiplies these by the nutrients contained in each beverage and arrives at an estimated nutrient intake.
For the purposes of analysis, 28 beverage items were combined into 6 types of beverage, for example, milk, soybean milk, yoghurt, juice, carbonated drink, and functional drink. Furthermore, 6 beverage types were classified into two categories; one is "healthy beverage" included milk, soybean milk and all the other types of beverages are included as "sweetened beverage".
Dietary methodology
Daily nutrients intakes of the children in winter were assessed by food consumption surveys carried out in November 2005 and February 2006. Food intakes of children were assessed using a 24-hour recall method during three nonconsecutive days, two days on weekdays and one day on weekends. Detailed descriptions of all foods and beverages consumed and estimated food portion sizes were recorded by well-trained interviewers using food models as memory aids. Nutrient intake was calculated using a computerized nutrient database, which was a compilation of nutrient data mainly from the KNS Nutrient Database (The Korean Nutrition Society, version 8). The same dietary recall interview protocol was used in food intakes in summer, from June to July 2006.
Anthropometric measurements
Height and body weight were measured by stadiometer and electronic balance (Model: DOLPHIN 100A, CAS) with children wearing light clothes without shoes, respectively. Measurements were performed on the school premises, in the presence of a teacher. The BMI was calculated as weight in kilograms divided by the square of the height in meters. Body fat mass and fat ratio were measured by the Bioimpedence method (Model: Inbody 3.0, Biospace, Korea). Waist and hip circumferences of children were also measured.
Statistical analysis
All analyses were performed with the Statistical Analysis System (version 9.1, 2002-2003, SAS Institute, Cary, NC). Descriptive statistics were generated as means and standard deviations for continuous variables. Student's t-tests were employed to examine the effects of gender or season on consumption of beverages, daily nutrient intakes and anthropometric measurements. All statistical tests were two-tailed and p values less than 0.05 were considered statistically significant.
Results
Anthropometry
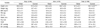
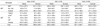
Table 2 summarizes the anthropometric measurements of the subjects by gender and season. The anthropometric results, except height, fat ratio, and diastolic pressure, were not different between winter and summer of both genders. Body fat ratio was 24.6% in winter, which was higher than the value of 22.4% in summer (P < 0.01). However, mean values of BMI were not different from the two seasons.
Daily energy and nutrient intake
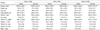
Daily energy and nutrient intakes for children were compared in boys and girls during the winter and summer seasons (Table 3). For both seasons the nutrient intakes were not different in boys and girls. However, energy, calcium, niacin, and vitamin C intakes for all subjects in winter were significantly higher than those in summer (P < 0.05). Meanwhile, vitamin A intake was higher in summer than in winter (P < 0.05).
The number of drinking moments of beverages per month by gender and season
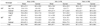
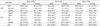
The numbers of drinking moments of beverages per month during winter and summer seasons are given in Table 4. Total drinking moments of beverages for all subjects in winter were 94.1 per month, which were not significantly different from the frequency of 93.5 in summer. However, the number of drinking moments of juice in girls were 21.2 in summer, which was significantly higher than 12.4 in boys (P < 0.05). Among various beverages, the frequency of milk consumption was highest for both sexes and both seasons. The number of drinking moments of milk for all subjects was 38 in winter and 36 in summer; these are not significantly different.
The amount of beverage consumption per day by gender and season
Mean amount (ml) of beverage consumption, by beverage category in both seasons is presented in Table 5. The total amount of all beverage consumption was 637.1ml in winter and 626.6 ml in summer; these were not significantly different. Milk was the highest amount of beverage consumed among all beverages in both seasons, 264.7 ml in winter and 253.8 ml in summer, respectively; these were not significantly different. However, the amount of juice consumption accounted for 174.5 ml in girls in summer, which was significantly higher than 96.6 ml in boys (P < 0.05). In addition, the amount of carbonated beverage was also significantly higher in girls than in boys in summer (P< 0.01). The overall amounts of beverages consumed, except milk and juice, were less than 100 ml per day which were not high. The amount of sweetened beverage, which was defined as all beverages except milk and soybean milk was 345.7 ml in winter; this was not significantly different from the amount of 354.5 ml in summer.
Energy intakes from various beverages consumption
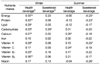
As shown in Table 6, the total energy intakes from the beverage consumptions per day during two seasons (341.6 kcal in winter, 328.5 kcal in summer) were not significantly different from each other. Energy from milk consumed was 158.0 kcal, which was the highest arising from the beverages consumed followed by 58.3 kcal from juice consumption in winter. The energy intakes from milk and from juice were 151.1 kcal and 62.3 kcal in summer, respectively. In summer, the energy from juice (P < 0.05) and carbonated beverage (P < 0.01) consumptions in girls were significantly higher than those in boys, respectively. The energy intake from sweetened beverage in girls was also significantly higher than that in boys in summer (P < 0.05).
The proportion of energy intakes from two types of beverages to the daily energy intake
The proportion of energy intake from all beverages accounts for 20.3% to the daily energy intake in summer. The proportion fell to 18.7% in winter, however, those were not significantly different from each other. When all consumed beverages were classified as health beverages and sweetened beverages based on their potential roles in the health and prevention of obesity in children, the percentage of energy intake from the health beverages to the daily energy intake was 9.6% and that from sweetened beverages was 9.1% in winter. The percentages of energy from the health beverages and the sweetened beverages were 9.8 and 10.5 in summer, respectively. The percentage of energy intake from sweetened beverages in girls was significantly higher than that in boys in summer (P < 0.05). Except for that, the percentages of energy intake from all other beverages in girls were not significantly different from those in boys, in both seasons.
Correlation coefficients between caloric intakes from two types of beverages and daily nutrient intake
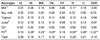
Table 8 indicates that the energy intake from the health beverages in girls was significantly correlated with most of the nutrient intakes, except iron, vitamin C, and niacin in winter. However, the energy intake from the health beverages in girls was correlated with only two nutrients, calcium and vitamin C in summer. The energy intake from the sweetened beverages in girls was inversely associated with energy, protein, vitamin A, and niacin consumptions in summer. However, there were no associations between the energy intake from the sweetened beverages and most of the nutrients except carbohydrates in winter.
Correlation coefficients between caloric intakes from beverages and anthropometric measurements
Beverages except milk, soybean milk, yoghurt, juice, and carbonated drinks were categorized as "functional drink" which included sports drinks, diet drinks, functional drinks, and traditional drinks. The energy intake from the functional drink in boys in winter was significantly correlated with weight (P < 0.05), BMI (P < 0.05), fat mass (P < 0.05), waist (P < 0.01), hip (P < 0.05), and WHR (P < 0.01).
Discussion
The aim of the present study was to assess beverage consumption in elementary students in the Gyeongnam area of Korea and how the beverage consumption patterns were associated with the daily nutrient intakes and their BMIs, not only in relation to season but also in relation to gender differences.
Beverage consumption of children was higher than the data from the Third Korea National Health & Nutrition Examination Survey (Ministry of Health & Welfare, 2006) showing that 150 g and 50 g of milk and carbonated drinks, respectively. However, beverage consumption in the present study was similar to that of children in developed foreign countries (Troiano et al., 2000). Unexpectedly, total beverage consumption was not different between summer and winter. However, consumption of certain beverage items was different with gender and season. The amount of carbonated drinks consumed by girls was significantly higher than that consumed by boys in summer (Table 5). However, as shown in Table 4, the number of drinking moments of carbonated drinks were not different between boys and girls. In other words, boys drank a lesser amount of carbonated drinks when drinking occurred. Those results may be partially due to the boys' patterns of beverage consumption. Usually, boys are willing to share their portions with friends around them. These friends often don't have a snack or they have a different kind of beverage. Whereas girls were less likely to share a beverage with friends. A carbonated drink was the most favorite beverage for female students, whereas, male students loved sports drinks like "ion drink" (Kang et al., 2006). A few studies also showed that boys liked sports drinks more than girls (Her et al., 2008; Song et al., 2005). Therefore, the different preferences for beverages between boys and girls might have worked as another contributor to the lower amounts of carbonated drinks consumed by girls.
The juice consumption showed the same trend as carbonated drinks in girls. Moreover, both of the drinking episodes and the consumed amounts were higher than those in boys in summer. Little empirical research has been done about the effect of gender differences on beverage consumption patterns in elementary school children in Korea. That is why we have difficulty in identifying possible underlying reasons for the higher consumption of juice in girls. However, in explaining why some people choose to eat a certain food, dimensions such as the pleasure derived from the food and the health value associated with it are typically mentioned (Cabanac, 1995; Lindeman & Sirelius, 2001). Preference for the taste of beverage was the strongest predictor for the beverage consumption (Grimm et al., 2004). Her et al. (2008) reported that juice was the most favorite beverage for girls. A few studies about food preference in elementary children showed that girls had a tendency of higher preferences for fruits and consumed them more frequently than boys (Joo & Park, 1998; Seo & Jang, 2007). Girls choose "fruit and juice" as the second favorite snack item whereas, the three most favorite snack items for boys were all high carbohydrate foods (Nam et al., 2006). Generally girls have healthy eating patterns. They infrequently skip meals and make healthier food choices (Nam et al., 2006) than boys. Moreover, a few studies showed that nutrition knowledge (Jeong & Kim, 2009; Yon et al., 2008) and food habit scores (Cho, 1998; Kim, 1999) were higher in girls than in boys in elementary school children. Considering our results and other findings all together, girls had high preferences and consideration for juice as a health beverage, which was possibly linked to the higher consumption of juice in girls.
We can find that some season-specific milk drinking behaviors exists in these subjects, especially in girls. In summer, girls considered milk to be a cold beverage, and most often drank only milk for quenching their thirst. However, they prefer to sip milk with various snacks, like sweet potatoes, bread, and cookies in winter. Such drinking habit was also revealed in a study in which milk was the most favorite beverage for preschool children to drink together with snacks (Choi & Yoon, 2003). Children were provided a pack of milk per day in the school cafeterias in the present study. If they want to drink additional milk, they can get milk from the family refrigerator after returning to their homes and they can easily get snacks in the same place. Therefore, the energy intake from the "milk & soybean milk" in girls was significantly correlated with most of the nutrient intakes, except iron, vitamin C, and niacin in winter.
Meanwhile, the energy intake from the sweetened beverages in girls was negatively correlated with energy, protein, vitamin A, and niacin consumption in summer. Some researchers have shown that sweetened beverages can drop subjects' appetites and food intakes (Sturm et al., 2004; Woodend & Anderson, 2001). Therefore, the finding that appetites of girls get weaker after consumption of sweetened beverages, especially in a hot summer, can be explained.
In winter, the energy intake from the functional beverages was significantly correlated with weight, BMI, fat mass, waist, hip, and WHR in boys (Table 9). The eating practices in snacks were somewhat different between normal and obese children (Ha, 2007). Obese children reported eating high sugar-snacks or drinking sweetened beverages more frequently than did normal weight children (Ha, 2007). Functional drinks included some kinds of beverages like, sports drinks, diet drinks, and traditional drinks in the present study. Mothers, or care givers, were not likely to provide such kinds of beverages for their children at home. Middle school students who have more money for their own use, more frequently choose to buy sports drinks as a snack (Song et al., 2005). They usually buy the beverage in the supermarket. Perhaps, children picked up these beverages by themselves at the vending machine in educational institutes after school or in the supermarket on the way home from school. In the present study, the amount of the functional drink consumption was significantly associated with the amount of juice, yoghurt, soybean milk and the total amount of all beverage consumption in boys in winter (Table 10). Not surprisingly, the amount of milk consumption was not associated with the functional drink consumption. In other words, in the period of time from after school until going back to their home, drinking those beverages takes place independently, more frequently in some boys than in others. Our findings imply that boys with higher consumption of functional beverages tended to drink sweetened beverages more often; these children have a possibility to be overweight. The girls with higher consumption of sweetened beverages, including juice, are likely to consume poorer diets, thereby potentially adversely affecting health status. Sweetened fruit drinks have been discussed as a potential source of high-energy, low-nutrient-dense beverages that could be related to the prevalence of obesity among children (Dennison et al., 1997; Ludwig et al., 2001). Meanwhile, a study pointed out that the hazardous perception of sports drinks was low in parents of elementary school students compared to other snacks and beverages (Jung et al., 2009). Therefore, it needs to develop nutrition education programs designed to encourage consumption of water and fruits instead of functional drinks and juice not only for children but also for their parents.
In conclusion, total beverage consumption was not different between summer and winter. However, there were different effects of consumption patterns of beverages on daily nutrient intake and BMI between gender and season. In girls, health beverages consumed were related with daily nutrient intakes in winter, whereas consumption of sweetened beverages may contribute to low intakes of nutrients in summer. However, consumption of beverages were not related with daily nutrient intakes and BMIs of boys in both seasons, except for functional drinks which were positively correlated with BMI in winter.


 XML Download