

 PDF
PDF ePub
ePub Citation
 Print
Print


Introduction
The prevalence of overweight and obesity is increasing worldwide and this is leading to dramatic increases in complications such as hyperlipidemia, heart disease and type II diabetes mellitus (Kim et al., 2005; WHO, 2006). Obesity is defined as the accumulation of excess adipose tissue resulting from an imbalance between energy intake and expenditure. Overeating is one of the major causes of obesity and restriction of energy intake is the basis of dietary therapy. However, simple food restriction reduces both body fat and body protein, and the low-energy diet consumed by obese people decreases the protein efficiency ratio. Thus, the treatment of obesity requires both the reduction of excess body fat and maintenance of adequate body protein by ingestion of an adequate diet (Aoyama et al., 2000a; Frank, 2005).
Much attention has been focused on components in several plant foods and dietary peptides, namely the functional protein hydrolysates, which might have beneficial effects on nutrient metabolism. It is thought that these substances have various physiological actions including antiobesity, antihypertensive, antithrombotic and anticarcinogenic actions (Aoyama et al., 2000a; Aoyama et al., 2000b; Horiguchi et al., 2005; Lee et al., 1997; Lee et al., 2004; Motoi & Kodama, 2003). As plant proteins usually have inferior functional qualities compared with animal proteins, particular attention has been given to the enzymatic hydrolysis of plant proteins. Among the plant sources, soybean is used widely to obtain protein hydrolysates, but several studies on the preparation of corn gluten (CG) hydrolysate have been reported (Lu et al., 2000; Miyoshi et al., 1990; Suh et al., 2003; Yamaguchi et al., 1996a; Yamaguchi et al., 1996b; Yang et al., 2007; Zheng et al., 2006).
Corn is a major cereal crop throughout the world. CG is used mainly for animal feed because it lacks functional properties essential for food. However, based on its biochemical structure such as high hydrophobicity, low price and high abundance, CG is becoming a potentially interesting source for food and non-food applications (Lu et al., 2000). The effects of cornpeptide on angiotensin-converting enzyme inhibition (Miyoshi et al., 1990; Suh et al., 2003; Yang et al., 2007), alcohol metabolism (Yamaguchi et al., 1996a; Yamaguchi et al., 1996b) and antioxidant capacity (Zheng et al., 2006) were reported. Producing hydrolysates with functional properties from CG could increase its effectiveness and availability. Corn has a high amount of branched chain amino acids (BCAAs), especially of leucine playing an important role in body weight metabolism (Layman, 2003; Layman & Walker, 2006). A potential role of CG and its hydrolysate in the control of body weight makes this an interesting area for further investigation.
Therefore, this study was aimed to examine the effect of CG and its hydrolysates on weight reduction in rats fed high-fat diet.
Materials and Methods
Animals
Eight-month-old male Sprague-Dawley rats (CD (SD)IGS, Outbred, Charles River Origin; Jung-Ang Lab. Animal, Inc., Korea) were placed in individual stainless steel wire-mesh cages in a climate-controlled room. The room had a 12:12 h light-dark cycle, a temperature of 22-24℃ and a relative humidity of 45 ± 5%. This study was conducted at the nutrition laboratory of Ewha Womans University, in compliance with the Guide for the Care and Use of Laboratory Animals (Committee on Animal Nutrition, 1995).
Experimental design and diets
The rats were fed a pellet diet (Samyang Co., Korea) for the first six days (adaptation period). At the end of the adaptation period, the rats weighed 560.24 ± 7.60 g (± standard error). The rats were then fed the modified American Institute of Nutrition (AIN)-93M diet (Reeves et al., 1993) with high fat (40% of energy as fat) for a month. The lipid sources in the high fat diet were lard and soybean oil. Each amount of protein, fiber, minerals and vitamins per total calorie in the high fat diet was equalized to that of the AIN-93M diet (Woods et al., 2003). The rats weighed 627.68 ± 6.52 g after this period. They were then stratified according to the body weight, randomly blocked into four treatment groups and raised for two months. The rats were allowed free access to the experimental diets and deionized water during the experimental period.
The experimental diets were formulated according to the nutrient contents of the AIN-93M diet (Reeves et al., 1993). The four experimental diets differed in protein sources. The protein sources were casein (control group), intact CG (CG group), CG hydrolysate A (CGHA group, 30% of protein as peptides and 70% as free amino acids) and CG hydrolysate P (CGHP group, 93% of protein as peptides and 7% as free amino acids). CG was from Doosan Food Company (Korea). CG hydrolysates were manufactured using the alcalase, protamex and flavourzyme (Novo Nordisk's Enzyme Business, Denmark) by Sempio Foods Company (Korea). The composition of dietary protein sources was analyzed and is shown in Table 1. The composition of the experimental diets is shown in Table 2. All other materials were purchased from Dyets Inc. (USA).
Measurement
Body weight was recorded weekly. To determine the food intake, the amount of food offered was weighed and the weights of scraps and waste were recorded three times per week. Food efficiency ratio was calculated as follows; food efficiency ratio = body weight change (g) for experimental period / food weight (g) consumed for experimental period (Héliès et al., 2005). Feces and urine were collected using the metabolic cages for the final three days of the experimental period. Blood samples were collected directly from the heart using syringes treated with heparin. They were centrifuged at 2,800 rpm for 30 minutes at 4℃ and frozen at -80℃. The liver was removed, weighed and cut into small pieces, which were frozen in liquid nitrogen and stored at -80℃ until analysis. Perirenal and epididymal fat pads and brown adipose tissues were removed and weighed after sacrificing the animals.
Analyses
The contents of protein, lipid, carbohydrate and dietary fiber in the dietary protein sources were measured to identify the compositions by the methods of Association of Official Analytical Chemists (AOAC, 1990). The profiles of total and free amino acids of dietary protein sources were analyzed using the Waters AccQ-Tag method (Waters, USA).
For fecal analysis, frozen feces were lyophilized, weighed and ground with a mortar. The nitrogen content in feces and urine was analyzed using the vario MAX CN (Elementar, Germany) and a conversion factor of 6.25 was used. Nitrogen balance as the biomarkers for protein metabolism was calculated as follows: nitrogen balance = IN- FN- UN, where IN is dietary nitrogen intake, FN is fecal nitrogen, and UN is urine nitrogen output. The energy value of feces was measured with an autocalculating bomb calorimeter (Parr 1261 Oxygen Combustion Bomb Calorimeter, Parr Instrument Co., USA). The apparent digestibility of energy, protein and lipid was calculated as follows: apparent digestibility (%) = (I - F)/I×100, where I is dietary energy, protein, or fat intake, and F is fecal energy, protein, or fat output (Aoyama et al., 2000a).
For lipid metabolism, we measured the total lipids concentrations in plasma (Frings & Dunn, 1970), liver and feces (Bligh & Dyer, 1959). Plasma concentrations of triglyceride, total cholesterol and high-density lipoprotein (HDL) cholesterol, hepatic and fecal concentrations of triglyceride and total cholesterol were measured using the commercial kit (Asan Pharmaceutical, Korea). Hepatic activities of carnitine palmitoyl transferase (CPT) (Bieber & Markwell, 1981; Markwell et al., 1973), fatty acid synthase (FAS) (Nepokroeff et al., 1975), malic enzyme (ME) (Geer et al, 1980) and glucose-6-phosphate dehydrogenase (G6PDH) (Noltmann et al., 1961) were measured.
Results
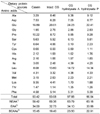
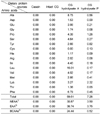
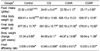
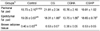
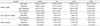
Total amino acid compositions of dietary protein sources are shown in Table 3. The BCAAs' contents were higher in the corn diets (CG, CGHA and CGHP diets) than in the control diet, especially the highest in the CGHA diet. The free amino acid compositions of dietary protein sources are shown in Table 4. There are little free amino acids forms in the casein and the CG diets. Comparison of the data in Tables 3 and 4 shows that most essential amino acids and BCAAs in the CGHA diet existed as free amino acid forms. Especially, all of leucine existed as free amino acid forms in the CGHA diet, while those in CG and CGHP diets existed as peptide forms.
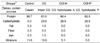
Daily food intake, initial body weight, final body weight, body weight change and food efficiency ratio are shown in Table 5. Daily food intake was the lowest in the CGHA group and the highest in the CGHP group. Body weight gain and food efficiency ratio in the CGHA group were significantly lower than those in other groups. Only CGHA group showed weight reduction.
The weights of the perirenal fat pad, epididymal fat pad and brown adipose tissue are shown in Table 6. Rats fed the CGHA diet had the smallest weights for all of these adipose tissues and only epididymal fat pad weight was significantly lower in rats fed the CGHA diet than in rats fed other diets.
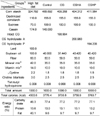
Nitrogen intake, fecal and urinary nitrogen excretion and nitrogen balance are shown in Table 7. Nitrogen intake was the highest in rats fed the CGHP diet and the lowest in rats fed the CGHA diets and the difference between these groups was significant. Fecal and urinary nitrogen excretions were the highest in rats fed the CGHA diet and the lowest in rats fed the control diet and the differences between these groups were significant. As a result, the CGHA group showed negative nitrogen balance.
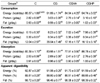
The consumptions, excretions, absorptions and apparent digestibilities of energy, protein and fat of rats fed diets with different protein sources are shown in Table 8. The consumptions of energy, protein and fat were the lowest in rats fed the CGHA diet and the highest in rats fed the CGHP diet and the differences between these groups were significant. Energy excretion was higher in the corn groups (CG, CGHA and CGHP groups) than in the control group and the differences between the CG group and the control and CGHA groups were significant. Protein excretion was the highest in the CGHA group and the lowest in the control group and the difference between these groups was significant. Fat excretion was significantly higher in the CG group than in other groups. Absorptions of energy, protein and fat were the lowest in the CGHA group and the differences between the CGHA and CGHP groups were significant. Apparent energy digestibility was significantly lower in the corn groups (CG, CGHA and CGHP groups) than in the control group. Apparent protein digestibility was significantly lower in the CGHA group than in other groups. Apparent fat digestibility was significantly lower in the CG group than in other groups.
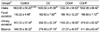
Lipid concentrations in plasma, liver and feces are shown in Table 9. Plasma total lipids, triglyceride and total cholesterol concentrations were the highest in rats fed the control diet and the lowest in rats fed the CGHA diet and the differences between these groups were significant. Hepatic lipids concentrations were not significantly different among all groups but total lipids and total cholesterol concentrations in the CGHA group tended to be the lowest. The CG group excreted significantly higher total lipids and total cholesterol than other groups. Fecal total lipids excretion in the corn groups (CG, CGHA and CGHP groups) tended to be higher than in the control group.
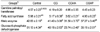
The activities of hepatic enzymes are shown in Table 10. CPT activity tended to be the highest in rats fed the CGHA diet. The activities of FAS, ME and G6PDH were the highest in the control group and the lowest in the CGHA group.
Discussion
The aim of this study was to examine the effect of CG and its hydrolysates on weight reduction in rats fed a high-fat diet. Body weight was decreased only in the CGHA group and the nitrogen balance in this group was negative. There were some studies that examined the effect of plant protein and their hydrolysates on weight reduction in experimental animals (Aoyama et al., 2000a; Aoyama et al., 2000b; Gutierrez et al., 1998; Hwang et al., 2001; Lee & Chang, 2001). Some soybean protein isolates showed the weight reduction effect (Aoyama et al., 2000a; Aoyama et al., 2000b) but other plant protein hydrolysates did not (Gutierrez et al., 1998; Hwang et al., 2001; Lee & Chang, 2001). We speculate cautiously that the different results of various studies examining the effects of plant proteins and their hydrolysates on body weight may be explained by several possible differences such as the ratio of free amino acids and peptides in the experimental diets, the amounts of BCAAs and indispensable amino acids in the experimental diets, the fecal lipid excretions or the activities of hepatic enzymes related to lipid metabolism in the experimental animals.
At first, the main difference among the experimental diets was the ratio of free amino acids and peptides. It was suggested that the ingestion of free amino acids has a unique role in body weight regulation (Daenzer et al., 2001). The results from other studies (Boirie et al., 1997; Boza et al., 2000; Ishihara et al., 2003) confirmed that free amino acids from the amino acid mixture diet were metabolized to provide energy, rather than being used for protein synthesis. In our study, the CGHA group showed negative nitrogen balance whereas other groups showed positive nitrogen balance, and the differences between these were significant. Urinary nitrogen excretion was significantly higher in the CGHA group and this seems to be the main reason for the difference in nitrogen balance. These results were similar with other studies (Canolty et al., 1995; Daenzer et al., 2001; Metges et al., 2000) which compared the effect of intact protein, protein hydrolysates and an equivalent mixture of free amino acids on nitrogen balance. In addition to this effect of ingesting free amino acids on protein metabolism, the type of protein seemed to affect protein absorption and apparent protein digestibility in the experimental animals. Protein absorption and apparent protein digestibility were the lowest in the CGHA group and the latter differed significantly from those of other groups.
According to our results of nitrogen balance and apparent protein digestibility, the ingestion of free amino acids seems to contribute to the weight reduction in the CGHA group by decreasing the apparent protein digestibility and possibly catabolizing the lean body. Moreover, weight reduction and negative nitrogen balance in the CGHA group seems not to be the result from the insufficient intake of energy because daily food intake amount and daily consumptions of energy and protein in the CGHA group were not significantly different from those in the control and the CG groups.
Second, the dietary factor that might have influenced body weight in our study is the contents of BCAAs, especially leucine. The BCAAs' contents, especially leucine, were higher in the corn diets than in the control diet and the highest in the CGHA diet, followed by the CGHP diet. Although increased leucine concentration has been known to stimulate muscle protein synthesis (Layman & Walker, 2006), leucine has been recently demonstrated to decrease food intake and body weight by stimulating hypothalamic mammalian target of rapamycin (mTOR) signaling (Cota et al., 2006). Moreover, although leucine is known to be an enhancer of insulin sensitivity, it seems to be that prolonged very high intakes of leucine may lead to insulin resistance and this may ultimately lead to a blunting of the stimulation of muscle protein synthesis (Garlick, 2005). In our study, we confirm this fact by the result that protein catabolism was increased in the CGHA group.
Third, the amounts of indispensable amino acids in the experimental diets were different among our experimental diets. Most of the available information on amino acid requirement is for growing animals, not for adult animals and the data about amino acid requirement for the maintenance of laboratory rats are rare and controversial (Committee on Animal Nutrition, 1995). In corn, the limiting amino acids are lysine and tryptophan, but the lysine contents in the CG, CGHA and CGHP diets were greater than the rat's requirement suggested by the "Nutrient requirement of laboratory animals" in the NRC data (Committee on Animal Nutrition, 1995), but these were extremely low in comparison with "Amino acid defined AIN 93M diet" (Reeves et al., 1993). By these data, it seems that the amount of lysine is critical for growing animals but not for adult animals. Therefore, the inadequate amount of indispensable amino acids in the corn diets, especially the amount of lysine, hardly seemed to contribute to the weight reduction in rats fed the CGHA diet.
Our study showed the hypolipidemic effect of CG and its hydrolysates. Other studies that examined the effect of plant proteins and their hydrolysate also showed the hypolipidemic effect (Aoyama et al., 2000a; Aoyama et al., 2000b). Suggested mechanisms for this hypolipidemic effect are the excretion of fat by the hydrophobicity of hydrolysate itself or peptide made during the ingestion process and the changes of hepatic enzymes related to lipid metabolism.
Many studies (Anderson et al., 1995; Kagawa et al., 1998; Nagata et al., 1982) in animal and human have shown the hypocholesterolemic effect of soybean protein and it was presumed to the effect of predominantly macropeptides that may be formed as isolated soybean protein is digested and absorbed in the gastrointestinal tract on the excretory process of bile acid and cholesterol. In our study, fecal total lipids and total cholesterol excretions tended to be higher in the corn groups than in the control group. Plasma total lipids and triglyceride concentrations tended to be the lower in the CGHA and CGHP groups than in the CG group, but the excretions of fecal lipids were not higher in the CGHA and CGHP groups than in the CG group as shown in other studies. Therefore, we speculate that the hypolipidemic effect of hydrolysates in our study was not mainly owing to the fecal lipid excretion and weight reduction in the CGHA group was not due to the fecal lipid excretion.
The activity of the hepatic enzyme CPT, which is involved in fatty acid oxidation, was the highest in the CGHA group. The activities of FAS, ME and G6PDH were significantly higher in the control group and lower in the CGHA group than in other groups. Epididymal fat pad weight was significantly lower in the CGHA group than in other groups. FAS is a lipogenic enzyme that sequentially adds two-carbon units from malonyl CoA to the growing fatty acyl chain to form palmitate. ME and G6PDH generate NADPH which functions as a reductant in various anabolic pathways including fatty acid synthesis (David & Michael, 2004).
Iritani et al. (1996) studied the effect of dietary soybean protein on gene expression of lipogenic enzyme and found that hepatic mRNA expression and activities of lipogenic enzymes were significantly lower in rats fed soybean protein than in those fed casein. In another study by Iritani et al. (1986), in fasted rats fed a fat-free diet containing various sources of protein for three days, the hepatic activities of FAS, G6PDH, ME and acetyl-CoA carboxylase were markedly lower in rats fed soybean protein or gluten than in those fed casein or fish protein. In addition, replacing dietary soybean protein with amino acids to simulate soybean protein maintained the effects on the activities of lipogenic enzymes, although at a slightly reduced rate. Thus, some effects can be ascribed to the protein itself and some to the amino acid composition of the diet.
Several studies (Hwang et al., 2001; Lee & Chang, 2001; Nagata et al., 1982) have shown that ingestion of hydrolysate up-regulates the activity of hepatic lipolytic enzymes and down-regulates the activity of hepatic lipogenic enzymes. In the study of Moriyama et al. (2004), activities of CPT and acyl-CoA oxidase related to fatty acid β-oxidation were higher and the activity of FAS was lower in soy protein hydrolysate-fed mice than in casein-fed mice.
In our study, down-regulation of hepatic lipogenic enzymes activities rather than up-regulation of hepatic lipolytic enzymes activities seemed to contribute to the decreased body and adipose tissue weights, but we could not know the exact mechanism. In addition, although the effects of the CGHA diet on body weight may be explained by several factors such as free amino acids/peptides ratio or the amount of BCAAs in the experimental diets, we could not know how much each dietary factor has contributed to the weight reduction and the working mechanism of each dietary factor. We suggest that this would be examined in further study.
In conclusion, the CGHA diet which had relatively high amounts of free amino acids and BCAAs, especially leucine, had a weight reduction effect by lowering adipose tissue weight and the activities of FAS, ME and G6PDH in experimental animals, but it seemed to be a negative result induced by lowering protein absorption, increasing urinary nitrogen excretion and protein catabolism.
 XML Download