

 PDF
PDF ePub
ePub Citation
 Print
Print


Introduction
Nutritional status in childhood affects physical growth and development. The assessment of nutritional intakes of young children is critical because any nutritional inadequacies or toxicities may have important short- and/or long-term adverse consequences. Several studies (Choi & Yoon, 2003; Joung et al., 2000; Kang, 2005; Kim & Chyun, 2001; Lim, 1999; Shin et al., 2005) have reported selected nutrient intakes of Korean young children, but some of the essential nutrients, such as zinc, vitamin E, vitamin B6, and folate, were not reported in these studies (Choi & Yoon, 2003; Joung et al., 2000; Lim, 1999). Kwangju is the sixth largest metropolitan city in South Korea with 1.4 million in population. Research on the nutrient intakes of young children in Kwangju is limited.
Most of the published dietary intake studies (Choi & Yoon, 2003; Joung et al., 2000; Kang, 2005; Kim & Chyun, 2001; Lim, 1999; Shin et al., 2005) in Korea compared the intakes with previous nutrient recommendations of Recommended Dietary Allowances (RDAs) for Koreans (The Korean Nutrition Society, 2000). The World Health Organization (WHO) has indicated that it is inappropriate to examine mean values of population intake with the RDA to define the population at risk of nutritional inadequacy (World Health Organization/Food and Agriculture Organization, 2004). In 2005, Dietary Reference Intakes (DRIs) for Koreans, including Estimated Average Requirement (EAR), Recommended Intake (RI), and Adequate Intake (AI), were established. The EAR represents the requirement of 50% of healthy individuals. The AI is used as a goal for the nutrient intake of individuals when an EAR is not available for calculation of the RI, which is expected to meet the needs of the vast majority of individuals in a life stage group; the RI is similar to the RDA (The Korean Nutrition Society, 2005). The EAR is appropriate for assessing the prevalence of inadequate intakes within a group. The Korean DRIs for children with regard to most of the nutrients were extrapolated from data obtained in studies of adults based on body weights (The Korean Nutrition Society, 2005). Currently, no research has been published regarding comparisons of nutrient intakes of Korean young children and the Korean DRIs along with anthropometric measurements. Therefore, the objectives of this study were to determine anthropometric indices, estimate selected nutrient intakes of young children in Kwangju, Korea, and compare these intakes with current DRIs for Koreans (The Korean Nutrition Society, 2005).
Subjects and Methods
Subjects
One hundred and thirty-six children aged 2-6 years were recruited by advertisement at preschools and kindergartens located in Kwangju between June and July, 2005. The University of Nebraska-Lincoln Institutional Review Board approved the study, and informed consent, written in the Korean language, was obtained from parents of all participating children. The parents were interviewed to obtain information regarding each child's age, current illnesses, medications taken, intakes of dietary supplements, and appetite. All interviews were conducted by a trained interviewer and were in Korean. One trained interviewer collected all nutrient intakes and two trained interviewers collected anthropometric measurements.
Anthropometric measurement
Trained interviewers measured children's weights and heights in light clothing without shoes (Gibson, 2005) at the children's preschools or kindergartens. Anthropometric data were calculated as Z-scores using WHO Growth Standards (De Onis et al., 2007; World Health Organization, 2006). Stunting and underweight were defined as Z-scores < -2SD for height-for-age and for weight-for-age, respectively (World Health Organization, 1995). The Body Mass Indices (BMIs) were also calculated (Hammer et al., 1991) and compared with International Obesity TaskForce (IOTF) BMI cutoffs (Cole et al., 2000) to identify the prevalence of overweight and obesity in the subjects. Overweight of the subjects was also determined using WHO Growth Standards (De Onis et al., 2007; World Health Organization, 2006), defined as Z-scores > 2SD for BMI-for-age (World Health Organization, 1995).
Nutrient intake assessment
A trained interviewer recorded the foods eaten by the subjects at their preschools or kindergartens; in addition, three consecutive 24-h food recalls (2 weekdays and 1 weekend day) were obtained from a parent of each subject using food models and cross-checking at preschools or kindergartens or by visiting the children's houses (Gibson, 2005). Nutrient intakes were estimated using a computer-aided nutritional analysis program developed by the Korean Nutrition Society (The Korean Nutrition Society, 2002) utilizing values of the Korean Food Composition Table (National Rural Living Science Institute, 2001). Dietary vitamin A and E intakes were calculated using reported values (Kim et al., 2006; Kim et al., 2007a; U.S. Department of Agriculture, Agricultural Research Service, 2005). Information regarding brand names of dietary supplements and frequencies of the consumption was collected from a parent of each child taking dietary supplements. Daily nutrient intakes from dietary supplements were calculated by using frequency and nutrient contents of the supplements.
Statistical analysis
Data were analyzed by age and gender using 1-way ANOVA with the Least Significant Difference post-hoc test (Rosner, 2000) of SAS (SAS Institute, Inc. version 9.1.3, Cary, NC, USA). Differences were considered significant at p < 0.05. Data are reported as LSmeans ± SE.
Results
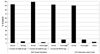
Healthy Korean boys (n=65) and girls (n=71), 2-6 y old, participated in this study, with the mean age being 4.1 years. Table 1 summarizes anthropometric characteristics of the subjects. No differences in these characteristics were observed by gender (p ≥ 0.05). Fig. 1 shows body weight categories of the subjects given as % subjects. The prevalence of stunting and underweight based on WHO Growth Standard Z-scores for height-for-age and weight-for-age of the subjects were only 3.7% and 1.5%, respectively. Based on WHO Growth Standards, 8.1% were overweight as defined by Z-scores > 2SD for BMI-for-age. According to the IOTF BMI cutoffs (Cole et al., 2000), 8.1% of the subjects were overweight and 2.2% were obese, while 89.7% were normal weight.
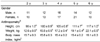
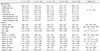
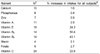
Selected macronutrient and micronutrient intakes of Korean children are given in Table 2. Parents of the majority of the subjects reported that these were typical of their usual intakes. No differences in the nutrient intakes of the subjects were observed by gender (p ≥ 0.05). Energy, carbohydrate, and protein intakes of 2 and 3 y olds were significantly lower (p < 0.05) than those of 4, 5, and 6 y olds. Most of the mean intakes for nutrients in the age groups were in line with the Korean EAR for children; however, the mean calcium intakes of 6 y olds and mean folate intakes of 3 y olds were lower than the Korean EAR for calcium and folate, respectively. Mean vitamin E intakes for each age group were lower than the Korean AIs for vitamin E. Eighteen percent of the children (n=25) in this study took supplements containing one or more of the minerals and vitamins. There were 11 different types of supplements taken, and all the supplements, except for two types, contained vitamin C. Table 3 shows mean % increased vitamin and mineral intakes by dietary supplementation for all subjects including those both taking and not taking supplements. Vitamin E intakes were 24.3% increased by adding intakes from vitamin E-containing dietary supplements. Twenty-four children consumed dietary supplements containing vitamin C; this consumption contributed a 22.9% increase of vitamin C intakes.
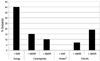
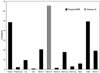
The energy intakes of 40% of the subjects were lower than Korean Estimated Energy Requirements (The Korean Nutrition Society, 2005), while none of the subjects in this study consumed < Korean EAR for protein (Fig. 2). Approximately, 19% of the Korean children in this study had higher fat intakes than the Korean Acceptable Macronutrient Distribution Ranges for fat intake (1-2 y, 20-35% of energy intake and 3-19 y, 15-30%) (The Korean Nutrition Society, 2005), while 7.4% were lower. Fig. 3 shows the prevalence of young Korean children consuming < Korean EAR (The Korean Nutrition Society, 2005) for selected minerals and vitamins. The prevalence of subjects having vitamin E intakes < the Korean AI is also given. The majority of the children consumed > Korean EAR for iron (90.4%), zinc (99.3%), vitamin B1 (98.5%), vitamin B2 (82.4%), vitamin B6 (97.1%), and niacin (94.1%). Approximately half of the subjects consumed < the Korean EAR for calcium (51.5%) and for folate (50.7%). The vitamin E intakes of 65.4% of the subjects were < the Korean AI. As mentioned earlier, the EAR is utilized as a mean of assessing the prevalence of nutrient inadequacy in a group of individuals.
Discussion
In this study, anthropometric measurements and dietary intakes of young Korean children (n=136) were estimated. Z-score values for height-for-age and weight-for-age of the children were generally within normal ranges (World Health Organization, 1995), although a few children had Z-score values indicative of their being stunted (3.7%) and underweight (1.5%) (Fig. 1). The prevalence of overweight (8.1%) of the children based on the WHO Growth Chart was the same as the prevalence of overweight using the IOTF standards. The prevalence of overweight and obesity (10%) in this study was in line with the obesity prevalence of 5-9 y old children in the Third Korea National Health and Nutrition Examination Survey (KNHANES III), 2005 (Ministry for Health and Welfare/Korea Health Industry Development Institute, 2006), while it was lower than the findings of the Japanese National Nutrition Survey of 1996 to 2000, of approximately 20% for 6-8 y old children based on the IOTF standards (Matsushita et al., 2004). According to the 2002 Health Survey for England using IOTF criteria, the prevalence of overweight and obesity of 6-10 y old boys and girls was approximately 20% and 30%, respectively (British Medical Association, 2005). The prevalence of childhood obesity is increasing in almost all industrialized countries, and continuing increases in obesity among children are of public health concern. Thus, though the prevalence of obesity of Korean children is lower than that of at least most other industrialized countries, the obesity rate of young children in Korea may have increased as the economic status of Korea has become more like that of other developed countries (Central Intelligence Agency, 2008).
Mean energy, protein, and total fat intakes of the children in this study were in line with those of young Korean children reported elsewhere (Choi & Yoon, 2003; Joung et al., 2000; Kang, 2005; Kim & Chyun, 2001; Lim, 1999; Ministry for Health and Welfare/Korea Health Industry Development Institute, 2006). Mean intakes of calcium, iron, riboflavin, niacin, and vitamin C were similar with those of 3-6 y olds in KNHANES III (Ministry for Health and Welfare/Korea Health Industry Development Institute, 2006), while intakes of phosphorous and vitamin A were lower. Intakes of zinc, vitamin E, vitamin B6, and folate were not determined in KNHANES III. Mean intakes of phosphorus, iron, zinc, vitamin B2, vitamin B6, niacin, folate, and vitamin C in the present study were similar to those reported elsewhere for Korean children (Choi & Yoon, 2003; Joung et al., 2000; Kang, 2005; Kim & Chyun, 2001; Lim, 1999). Mean vitamin B1 intake was higher than reported in other Korean studies (Choi & Yoon, 2003; Kang, 2005; Joung et al., 2000; Kim & Chyun, 2001; Lim, 1999). However, mean calcium, vitamin A, and vitamin E intakes were lower than those reported elsewhere for Korean children (Kang, 2005; Shin et al., 2005). The mean intakes of energy, protein, calcium, phosphorous, zinc, vitamin E, vitamin B2, niacin, folate, and vitamin C in the present study were in line with the nutrient intakes of Japanese children aged 1-6 y old in the 2002 National Nutrition Survey in Japan, but fat, carbohydrate, and vitamin A intakes were lower than those of the Japanese children (National Institute of Health and Nutrition, 2004). Mean intakes of energy, protein, total fat, calcium, phosphorous, iron, vitamin A, niacin, and vitamin C in the current study were lower than those of Spanish 2-5 y old children in the enKid Study, 1998-2000 (Serra-Majem et al., 2006).
In the current study, 18% of children consumed dietary supplements containing one or more minerals and vitamins. Daily nutrient intakes of selected nutrients were increased from 0.4% up to 50.4% by dietary supplementation; therefore, to measure accurate nutrient intakes of Korean children, it may be important to collect the information regarding consumption of dietary supplements.
In the current study, approximately half of the subjects had calcium intakes < Korean EARs. Calcium is one of the most important minerals for the growth of bones and teeth in children. Thus, young children in Korea, especially in the Kwangju area, need to eat more calcium-rich foods (milk and dairy products; bony fish and shellfish; selected vegetables - bok choy, broccoli, and seaweed; and legumes and legume products), including calcium-fortified foods such as fruit juices and breakfast cereals. Also, it may be important to encourage dietitians or meal planners to provide meals and snacks containing calcium-rich foods or calcium-fortified foods in preschools and kindergartens for normal growth of children.
Vitamin A (including provitamin A carotenoids), vitamin E, and vitamin C are involved in antioxidant activities (Institute of Medicine, 2002). Adequate status of these nutrients may be important for young children to protect against oxidative stress or damage along with other antioxidant nutrients in the body. Inadequate intakes of vitamin A (21%) and vitamin E (65%) were observed. Vitamin A (Kim et al., 2007b) and vitamin E (Giraud et al., in press) status including biochemical indices of the children in the current study were reported elsewhere. Many of the children had inadequate vitamin A (Kim et al., 2007b) or vitamin E (Giraud et al., in press) status; thus, monitoring the status of vitamins A and E and encouraging intakes of foods rich in these vitamins may be critical to prevent health problems related to inadequacies of these vitamins in young Korean children.
In this study, 50% of Korean children had folate intakes <Korean EARs. Folate status of these children including biochemical indices have been also reported elsewhere as one-quarter of the subjects had marginal status of folate (Kim et al., 2007c).
It has been reported that vitamin C intakes of Korean children and adults (Kang, 2005; Shin et al., 2005; The Korean Nutrition Society, 2005) are usually adequate as mean intakes of vitamin C were higher than previous Korean RDAs (The Korean Nutrition Society, 2000). In the current study, mean dietary intakes of vitamin C were equal to or higher than current Korean RI (The Korean Nutrition Society, 2005) and 18% of subjects consumed supplements containing vitamin C. However, approximately 19% of Korean children consumed < Korean EAR for vitamin C in this study. Thus, some young children in Kwangju, Korea, may be at risk of vitamin C inadequacy. At present, no study has been published on the vitamin C status including biochemical indices for Korean young children. Major vitamin C sources are strawberry, orange and orange juice, lemon, pepper, tangerine, broccoli, tomato, and green leafy vegetables (The Korean Nutrition Society, 2005). However, the vitamin C contents of diets likely vary by season and types of foods consumed (The Korean Nutrition Society, 2005). Some of vitamin C sources are seasonal (strawberries in spring and tangerines in winter) or expensive, such as oranges, lemons, and broccoli, so that vitamin C intakes might vary depending upon season and family incomes. In Korea, research is needed to determine seasonal variations in vitamin C intakes for young children as well as vitamin C status, including biochemical indices.
In the current study, anthropometric indices of the children living in Kwangju, Korea, were within normal ranges, and about 10% of the subjects were overweight or obese. Intakes of iron, zinc, vitamin B1, vitamin B2, vitamin B6, and niacin intakes of these Korean children were generally > Korean EAR, although intakes of calcium, vitamin A, vitamin E, vitamin C, and folate < the Korean EAR or AI were prevalent. To improve these nutrient intakes, parents and healthcare professionals should encourage the children living in Kwangju, Korea, to consume foods rich in calcium, vitamin A, vitamin E, vitamin C, and folate. In Korea, some of the food companies have fortified, using selected nutrients, their breakfast cereal products, milk and milk products, fruit juices, or snacks/chips; therefore, parents or meal providers in schools can select the foods fortified with calcium, vitamin A, vitamin E, vitamin C, and folate to improve children's intakes of these nutrients.
 XML Download